READ THESE TERMS AND CONDITIONS CAREFULLY BEFORE USING THIS WEBSITE. https://nrc-publications.canada.ca/eng/copyright
Vous avez des questions? Nous pouvons vous aider. Pour communiquer directement avec un auteur, consultez la première page de la revue dans laquelle son article a été publié afin de trouver ses coordonnées. Si vous n’arrivez pas à les repérer, communiquez avec nous à PublicationsArchive-ArchivesPublications@nrc-cnrc.gc.ca.
Questions? Contact the NRC Publications Archive team at
PublicationsArchive-ArchivesPublications@nrc-cnrc.gc.ca. If you wish to email the authors directly, please see the first page of the publication for their contact information.
NRC Publications Archive
Archives des publications du CNRC
This publication could be one of several versions: author’s original, accepted manuscript or the publisher’s version. / La version de cette publication peut être l’une des suivantes : la version prépublication de l’auteur, la version acceptée du manuscrit ou la version de l’éditeur.
Access and use of this website and the material on it are subject to the Terms and Conditions set forth at
Porosity and pore-size distribution in ordinary portland cement paste
Sereda, P. J.; Feldman, R. F.; Ramachandran, V. S.
https://publications-cnrc.canada.ca/fra/droits
L’accès à ce site Web et l’utilisation de son contenu sont assujettis aux conditions présentées dans le site LISEZ CES CONDITIONS ATTENTIVEMENT AVANT D’UTILISER CE SITE WEB.
NRC Publications Record / Notice d'Archives des publications de CNRC:
https://nrc-publications.canada.ca/eng/view/object/?id=3ac93bd4-3bb8-4e07-9875-340353d2744e
https://publications-cnrc.canada.ca/fra/voir/objet/?id=3ac93bd4-3bb8-4e07-9875-340353d2744e
National Research
Conseil national
1
*
Council Canada
de recherches Canada
POROSITY AND PORESIZE DISTRIBUTION IN
ORDINARY PORTLAND CEMENT PASTE
by P.
J.
Sereda,
R.F.
Feldman and V.S. Ramachandran
ANALYZED
Reprinted from
7th International Congress on
the
Chemistry of Cement
VoL I, Paris 1980
p. VI*1/10
-
VI-1/21
DBR
Paper
No.
977
Division of Building Research
Price
$1.25
OTTAWA
Ser
88%
.
N21d
10.977
c.
2
BLDG
N R C-
C # 4 T IBLDG.
RES.
L I B R A R Y
i
I
Rech.
Bdtirn.
I
C . 9NRCC
19445
Plusieurs des plus importantes techniques de mesure de la porositg et de la rgpartition du diamPtre des pores sont discutges. Les techniques de mesure de la porosit6 sont la diffusion inslastique neutronique, l'injection d'hglium et la pycnomgtrie. La diffusion neutronique permet de distinguer l'eau libre de l'eau cornbinge; l'injection d7h61ium d6montre l'effondrement des couches lorsque l'eau combin6e est Gliminite, permettant de sgparer l'espace entre Tes couches de l'espace interstitiel. L'adsorption d'azote, la condensation capillaire et la porosim6trie au mercure donnent 2 la fois la valeur totale du volume des vides, qui correspond 5 la valeur obtenue suite 5 la pycnomgtrie au h6lium, et une r6partition du diamGtre des pores, qui concorde dans tous les cas; toutefois, certains travailleurs ont obtenu dans le cas de la condensation capillaire des pentes plus raides et un volurne des vides beaucoup plus 6levG en dessous de
SUB-THEME
V I
-
1
Structure formation and
development
in hardened cement pastes
P.J. SEREDA
R.F. FELDMAN
V.S. RAMACHANDRAN
Conseil National de
Recherche du Canada
Ottawa
-
CANADA
2. POROSITY AND PORE-SIZE DISTRIBUTION IN ORDINARY PORTLAND CEMENT PASTE
This section of the paper will deal with some of the more important techniques used to measure porosity and pore-size distribution, which have helped deternine the structure of hydrated portland cement. Pore structure is one of the most important
parameters controlling the pro~erties of porous
materials. Many procedures to determine the pore structure of a solid have involved mercury
porosimetry and nitrogen or water-vapour adsorption isotherms. Calculations based on these have been relatively successful for materials with pore structures that remain stable on removal or addition of water.
Measurements for unstable materials such as hydrated portland cement, however, have been difficult to interpret. Water used as a medium always gives a higher poroslty for hydrated portland cement than that obtained by other media, e.g., nitrogen,
methanol and helium (1.2). In order to measure many
of the properties of hydrated portland cement, it must be dried; this presents a major problem since decomposition of some of the hydrates will occur. One may expect changes in porosity, surface area and other. physical properties (3-10). Also, on exposing the material to water, rehydration of the decomposed hydrates may occur (ll),.
In recent years, several advances have be.en made in the application of two techniques that have been widely used on a variety of materials for measuring porosity and pore-size distribution. These are the capillary condensation method, which uses several different adsorbates (mainly nitrogen and water on cement paste), and mercury porosimetry. These will be presented and discussed.
However, since the Moscow Symposium, two new techniques have been applied to the hydrated port land system. These are:
(i) the quasi-elastic or inelastic neutron-
scattering method (12) ;
(ii) the helium inflow and helium pycnometric technique (13).
With the first technique, the fractions of free and bound water can be determined to quite a good approximation. Previously, nuclear magnetic resonance had been used on these types of hydrated silicates to distinguish between protons having different inducticn decay times caused by different types of bonding 114,15), but the relative amounts of differently bor..:ed protons for samples containing appreciable fract1.w of free water, as occurs in a
saturated cement p ste, were not measured.
With the second t-,.,!nique, changes to the structure
can be f)llowed as water is removed from the system
or as wa.er re-enters the system. This is important
because mu h work has been done with the aim of
relating p' rosity dr,termined by water with that
d.?termined t.v other techniques. The difference has
been termed '-1- -sing porosity" or "gel pores." The
h e l i u m flow t ,'unique has detected this missing
p#rosity, whi is, in fact, the interlayer space
normally occu, .ed by approrimtely one layer of water whcn the material is in the wet condition. On drying
ant1 removal of the interlayer water, this space
partially collapses. The effort and controversy related to the study of the "missing porosity" and its importance relating to mechanical properties has justified its inclusion in a discussion on porosity.
2.1 INELASTIC NEUTRON-SCAITERING METHOD
Neutron inelastic scattering is sensitive to the mobility of atomic nuclei, especially those of hydrogen, which has an exceptionally .large neutron- scattering cross-section. A bound molecule
undergoes vibration with some particular frequency, characteristic of the particular mode, and gives rise to an inelastic scattering distribution of neutron energies, which reflects the density of vibrational states, together with elastic peaks reflecting the time-averaged position of the molecule. In contrast, a mobile molecule has no particular time-averaged positibn and so gives rise to no strictly elastic peak in the spectrum, but rather a quasi-elastic distribution that reflects the Doppler shifts in frequency caused by the molecular motions.
In the context of a water phase in a cement, Harris, Windsor and Lawrence (12) considered it plausible to postulate a multi-component structure, each component obeying Fick's law individually (16), having a distribution of diffusion constants. In the analysis of water in vermiculite clays, workers fitted their results to a single diffusion constant (17).
The cement paste spectra correspond quite accurately to those of two-component systems with free
components given by the pure-water spectrum and bound components by a resolution function. There is no evidence from the shape of the quasi-elastic frequency distribution that any more complicated model than a two-component system with free and bound water states should be used.
Table 2.1 (based on ref. 12) contains a spmary of experimental measurements by neutron scattering and conventional methods, on four saturated cement pastes approximately 2 years old. The weight losses incurred by drying at 100°C and by evacuation at room temperature are consistently greater than the amount of free water calculated from neutron scattering measurements on the saturated pastes
(Rows 2 and 3 respectively). This can be explained if one concludes that some combined water has been removed during drying.
The volume fraction of free water calculated from the neutron scattering estimate of free water is approximately equal to the calculated (18) capillary
water content (Rows 5 and 8). Other data (19) show
that this capillary volume is approximately equal to the total volume available to liquid nitrogen in pre-dried pastes. As previously mentioned, the free water volume by drying a$ 100°C is much more than that determined by neutron scattering (Rows 7 and 5 respectively).
These results are very significant because they agree with nitrogen adsorption data, suggesting that nitrogen adsorption gives realistic values and that evaporable water is partly combined. They also suggest that the neutron-scattering technique can be used to elucidate the structure of saturated cement pastes because it avoids the uncertainties associated with drying.
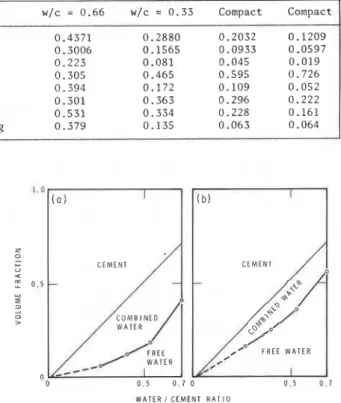
The results from this work are illustrated in Fig. 2.1 (12). which shows the volume fractions of
_ _ _ _ _ _ _ _ _ _ _ _ _ _ _ _ _ _ _ - - - L L - - -
TABLE 2.1 - Estimation of free and combined water by neutron scattering and conventional methods (based on ref; 12)
Row Properties
-
saturated pastes w/c = 0.66 w/c = 0.33 Compact Compact 1 Ignition loss, weight fraction at 1000°C 0.4371 0.2880 0.2032 0.1209 2 Drying loss, weight fraction at 100°C 0.3006 0.1565 0.0933 0.0597 3 Free water by weight by neutron scattering 0.223 0.081 0.045 0.0194 Cement volume 0.305 0.465 0.595 0.726
5 Free water volume by neutron scattering 0.394 0.172 0.109 0.052 6 Combined water volume by neutron scattering 0.301 0.363 0.296 0.222 7 Free water volume by loss on drying at 100°C 0.531 0.334 0.228 0.161
8 Capillary water volume, from weight loss on drying 0.379 0.135 0.063 0.064
cement, combined water and free water determined from (a) neutron scattering data, and (b) from traditional concepts using the usual drying techniques. The over-estimate of the porosity by the conventional techniques is obvious in this illustration. 2.2 HELIUM FLOW AND HELIUM PYCNOMETRIC TECHNIQUE This technique involves the normal pycnometric measurement of the solid volume of a body during which the helium surrounding the body is compressed to 2 atm. Immediately after this period (a total of 2 min from the time helium is first admitted to the sample) the rate at which helium penetrates the body under an absolute pressure of 2 atm is measured for a period of 40 h (13). In other techniques such as sorption, weight or volume changes are measured as a function of partial pressure of sorbate, which does not take into account removal or replacement of, in this case, water from or to the molecular structure. The helium flow technique is capable of following these changes and has been used to study hydrated CgS and portland cement as well as some relatively well-defined systems (20).
The study of the C-S-H gel found in hydrated portland cement by the helium flow technique has revealed that much of what was formerly thought to be adsorbed water is associated with the solid as interlayer water. The removal or replacement of the interlayer water results in changes to the solid volume, density and porosity; which can be measured. Ageing effects that occur during wetting and drying treatments can also be detected.
The volume of interlayer space and the change in volume due to water removal or re-entry can be readily monitored by a combination of solid-volume and helium-inf low-change measurements. These measurements, together with those of other properties such as surface area, can determine hydraulic radius or average surface-to-surface separation and shape of the interlayer spaces.
Several of the pertinent experimental observations and types of calculations made through this technique are described in the following three sections. 2.2.1 Density and Porosity Measurements
Several types of density measurements can be made on hydrated portland cement (2). The most obvious density is that where most hydrates have been left intact. This can be partially obtained by measuring the solid volume of specimens conditioned at 11% RH, using the helium pycnometer. However, a constant procedure has to be adopted where the time-to-helium exposure is limited because of the problem of helium
0 5 0 . 7 0 0 5 0.7 W A T E R 1 C E M E N T R A T I O
Fig. 2.1 - The volume fractions occupied by cement, combined water and free water in saturated cement pastes (12). (a) Composition from neutron scattering; (b) Composition from drying loss
flowing into vacated interlayer spaces. The value for this density at different water contents drying from 11% RH is shown in Fig. 2.2 (2).
Once density has been measured, porosity can be calculated from the apparent volume. Porosity was calculated for d-dried hydrated portland cement from the data in Fig. 2.2 (2) and compared with that obtained with methanol and with water. The results, shown 'in Fig. 2.3 (2) for several water/cement ratio pastes, indicate that the porosities obtained with helium and methanol are very similar over the whole range. When water is used, porosity is about 8% more at a waterlcement ratio of 0.4. This corresponds approximately to the value estimated by scanning isotherms (21) for the quantity of interlayer or hydrated water. When water is used to measure porosity or density of hydrated portland cement dried only to 11% RH, the values are similar to those obtained with both helium and methanol (2). This shows that most of the interlayer water is retained in the solid at this condition.
Density may also be calculated by including as pore space the volume of interlayer space that is free of water and in an uncollapsed state (22). In order to calculate this volume, the total volume of helium inflow at 40 h is subtracted from the solid volume measured by the helium pycnometer. The results
:
2. 35
I I 1 I I I 1 I I I I plotted in Fig. 2.4 (2) show that density
L W increases with weight loss up to 5 to 6%
after which it decreases. The maximum
o 0 . 4 W I C S T D P A S T E
0 0 . 6 W / C S T D P A S T E density occurs because collapsing sheets
n 0 . 8 W I C S T D P A S T E retard the inflow of helium into the
0 . 4 WIC S T D P A S T E interlayer space and in the 40 h of
2 . 3 0
-
v 0 . 6 0 . 8 W I C S T D P A S T E W I C S T D P A S T E measurement complete filling of the volumedoes not occur. Thk low final density at the dry state is a result of the layers only partially collapsing which prevents helium from fully entering the space.
2.2.2 Collapse of Layered Structure on
-
Drying
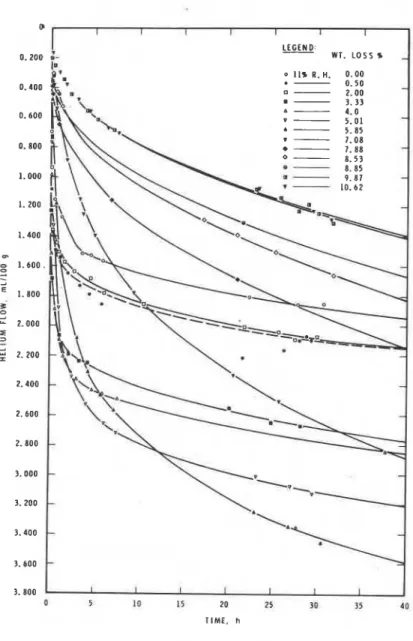
Figure 2.5 (2) shows typical helium flow curves with time for a hydrated portland cement dried from the initial 11% RH
condition to a final condition obtained by
2 . 2 0
-
-
heating at 140°C under vacuum for 6 h.Weight losses are recorded from the 11% condition.
Individual rate curves are functions of the volume of vacated interlayer space remaining
2.15 I I I I I I I I I I I and the size of the entrances. When the size
0 1 2 3 4 5 6 7 8 9 1 0 11 1 2 of the entrances are large, rate of flow will
I
W E I G H T L O S S , r be rapid but because collapse occurs(11% R H I initially from the entrances, the rate will
decrease even though more vacated space may
L'
Fig. 2.2
-
Relationship between density exist. This is illustrated by the crossing and weight loss for cement pastes with over of the rate curves in Fig. 2.5 (2). w/c ratios of 0.4, 0.6, 0.8 and 1.0 (2) The effect of the withdrawal of water may bemore clearly observed in Fig. 2.6 (23). The total inflow after all moisture is withdrawn is less than that at the initial 11% condition, mainly because there is an abrupt reduction in inflow over a very low
weight-loss range. This is due to partial 'collapse of the interlayer spaces. Solid volume and total interlayer space
-
vacated by water on drying. - Removal of
0 * interlayer water leads to a change in "solid
a 203
-
.
-
volume" (AV) and to a change in total heliumM L T H A N O L
0 H E L I U M inflow, AD. Because part of the vacated
I0
-
0 W A T E R-
interlayer space has collapsed, resulting ina change in solid volume, an assessment of
0 I I I the space occupied by the water molecules can
0 . 4 0.5 0 . 6 0. 7 0 . 8
WATER l C E M E N T R A T I O
Fig. 2.3
-
Relationship between porosity and w/c ratio for portland cement pastes (2)2 . 1 0
-
E
.d
Fig. 2.4
-
Relationship between density(corrected for helium inflow) and weight
-
loss for cement pastes with w/c ratios I I I I I I I . I I I I
.
of 0.4. 0.6, 0.8 and 1.0 (2) 0 1 2 3 4 5 6 7 8 V L 0 1 1 1 2
I
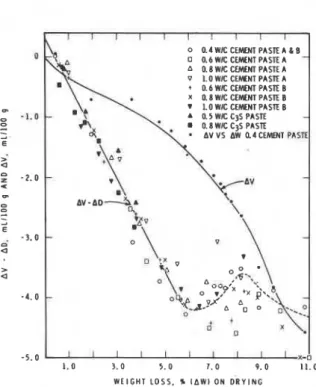
W E I G H T L O S S . %only be made by combining these parameters. n u s , a parameter AV-AD is obtained where, owing to increased weight loss, the decrease in volume is a negative A V , and increased inflow, AD, is regarded as positive. This then accounts for the space vzcated by the water if helium enters all the space in 40 h.
Figure 2.7 (23) shows a plot of AV-AD and
AV against weight loss, for 10 different
samples. The AV-AD plot is linear up to 5.5% weight loss of slope 0.7886 mL/g, which is the space occupied by 1 g of water; the inverse is 1.27 g/mL ('0.08 g/mL), which is the density of the water. Between 6 and 11% weight loss, there is very little change in AV-AD even though there is an increase in rate of change of A V . The departure from linearity of the plot in Fig. 2.7 (23) is due to the reduction in helium inflow because of a restriction in the entrances of the interlayer spaces and their partial collapse.
2.2.3 Reopening of Layered Structure When strongly dried hydrated portland cement is exposed to water vapour, water molecules re-enter between the sheets
(6,ll); as the material is exposed to higher humidities, more water molecules re-enter the structure. This re-entry can be investigated by exposing material to various humidities before measuring helium inflow at 11% RH; helium inflow increases with re-entry and as the interlayer space becomes filled, helium inflow decreases. Evidence of
repenetration of water molecules has also been obtained from low-angle X-ray scattering measurements (24).
The penetration of the layered structure by water molecules leads to a variation of solid volume and density. Drying and
wetting cycles result in a significant 0 5 10 I5 20 25 30 95 40
increase in solid volume, an example of
ageing of the structure. I I M E , h
Measurement of total space occupied by repenetrating water. - The AV-AD vs weight
change plot for re-ex~osure to water vauour
is
resented
in Fig. 2.8 (6). It recoids an increase in AV-AD of only 1.75 mL/g for weight gain of up to 6.0%, on exposure upto 42% RH. The helium is not fully
measuring the volume of the water that has entered structure. Beyond 6.0% a good -
linear correlation is obtained, resulting in a density calculation of 1.20 g/mL for the interlayer water.
The weight gain up to 42% RH would imply an impossibly high density for the water, and it is obvious that the water molecules are mainly entering the interlayer structure
Fig. 2.6
-
Helium flow at 50 min and 40.h. plottedas a function of weight loss for 0.6 w/c ratio cement paste (23)
Fig. 2.5
-
Helium flow into 0.8 w/c ratio cement paste at different water contents as a function of time (2)I 1 I I I I I I I I 3.000 - m Q E
I
mnl
~ I U M FLOW A t 50 min WEIGHT LOSS.*
O N D R Y I N GI I I I I I I : I I . or packing during changing conditions, then 3 At/E
o O . ~ W I C C E M € N T P A S T E A & B is equal to the fractional volume change of the
0 o 0.6 WIC CMNT PASTE A
-
solid phase of the body. A 0.8 W K CEMENI PASTE Av 1.0 WIC CENYNT PASTE A A measurement of the solid volume by helium
+ 0.6 W K CEMNT PASTE B
x 0.8 WIC CEMENT PASTE B pycnometry would include the adsorbed water, as 1.0 WlC CEMENT PASTE B well as the solid in the expanded state. By measur-
- 1 . 0 ing the solid volume at the dry state and at 11% RH,
where the adsorbed water is approximately equal to a AV VS AW 0.4 CEMENT P A S t l monolayer, one would obtain the volume of a
monolayer of adsorbed water plus the increase of the solid. This is referred to as AV/,,.
. 2 . 0 -
The difference of the volume changes would then be equal to the volume of the adsorbed water as a fraction of the total volume of the solid. This may be written as follows:
- 3 . 0
-
AV/,-
3 ~ a / a = vlvwhere "v" is the volume of adsorbed water and "V1' the volume of the solid (25).
- 4 . 0
-
The measurement of both these volume changes assumesthat during the change of condition from Oto 11% RH.
no ageing occurs. Previous work (7) has shown this
to be the case.
- 5 . 0 I I 1 I I I I I I I , + , , Because ''v" is the volume of the monolayer of I. 0 3 . 0 5 . 0 7 . 0 9 . 0 1 1 . 0 adsorbed water on the surface bounding the porosity,
WEIGHT L O S S . % I A W I O N D R Y I N G the surface area can be readily calculated. The hydraulic radius of a pore system is computed by
Fig. 2.7 - Plot of AV-AD and AV as a function dividing the total pore volume of the system by its
of weight loss for 10 different pastes (23) surface area; thus the hydraulic radius can also be
readily calculated, as shown in Table 2.11 for
hydrated portland cement paste of w/c = 0.4, 0.6 and
0.8. that had partially collapsed on drying. This also
indicates that the monolayer of adsorbed water on the were obtained lo different of
open surface is a relatively minor part of the 6.0% hydrated portland cement and C3S of various water/
sorbed up to this stage. were also determined by nitrogen adsorption, using cement.ratios. The surface areas of these samples
Beyond this point, the water is completely held in the same drying technique. These quantities are
interlayer positions because all these measurements plotted in Fig. 2.9 (based on unpublished work by
are made at 11% RH, and a monolayer on the exterior one of the authors.) Although a deviation occurs at
surface is complete at 11% RH. The linear plot in this region indicates that helium fully enters the interlayer
space (after exposure to 42% RH and up) 7 . 0 .
,
and measures the volume of the inter-
,
I I I 1layer water and the remaining space.
6 . 0 - ,., ,,- 1.7
Hydraulic radius and surface area of
capillary porosity.
-
When d-driedhydrated portland cement paste is exposed to water vapour, the water molecules enter the pores, adsorb on the solid that is bounding the pores, and some molecules penetrate the layered structure within the solid. The solid particles swell, not only because of the interlayer penetration, but also because of the physical interaction of water on
I the surface of the solid. This i's
called Bangham swelling and is due to a decrease in surface tension forces that compress the solid. This swelling should be transmitted through the
porous body and is referred to as AP./P.,
which is the measured linear ex~ansion
1
of the porous body. If AE/C isa small,3 AP./P. is the volumetric expansion.
If there is no change in porosity
"!I. 0 0 . 4 5 . 0
-
0 . 8 m 0 0 . 6 0 1 . 0 0 ; 4 . 0-
0 . 8 2 n d D R Y I N G E 1 . 0 2nd D R Y I N G 0 a $ 3 . 0-
> a/ I
, / O 2 . 0-
0 D / O m 1 . 0-
.
',I.' / A - 0 - c , - ~ , - , I 0 2. 0 4.0 6 . 0 8 . 0 10.0 1 2 . 0 W E I G H T G A I N . % I A W I O N R E W U T I N GFig. 2.8 - Plot AV-AD as a function of weight
- - - + - * - + - - -
TABLE 2.11 - Surface area and hydraulic radius of hydrated portland cement by helium pycnometry
Water/cement Surface area. Hydraulic radius,
ratio m2/g
1
0.4 35.0 39.4 0.6 49.0 64.2 0.8 44.0 107.0 6 0-
5 0-
4 0-
-
30-
0 HYDRATED C3S WIC 0 . 8 - HYDRATED C3S WIC 0.5 2 0-
A HYDRATED PORTLAND CEMENT-
WIC 0 . 8 - LIGNOSULFONATE
A HYDRATED PORTLAND CEMENT WIC 0 , s . 0.4. 0.6, 0.8
-
0 AVTOCLAVED 0. 2. 10% SULFURI I I I I I
Fig. 2.9 - Surface area by nitxogen adsorption and by helium pycnometry (Feldman, in process) the lower surface areas, the agreement justifies the assumptions and confirms the general validity of the equation. The concept that the instantaneous helium pore volume is the same as the pore volume determined by nitrogen, and that the remaining pore volume is that of the partially collapsed interlayer space is sound. This confirms the validity of the inelastic neutron scattering experiments already discussed (2). Hydraulic radius of the interlayer space. - As mentioned previously, the hydraulic radius of a pore system is computed by dividing the total pore volume of the pore system by its surface area. Until recently, this calculation could not be made without assuming a particular structure for the C-S-H gel. but the low-angle scattering data of Winslow and Diamond (24) has provided this value. In addition, as discussed earlier, the interlayer space is re-opened by exposure to 42% RH; at this condition, helium can fully enter the internal space within 40 h of flow time. The volume of the interlayer space can thus be measured on the partially-open or fully-open state depending on the relative humidity of exposure. using helium to measure the remaining volume. The results from measurements on a hydrated cement paste cured at a water/cement ratio of 0.6, using the helium-volume-change method reported here, give a value of 1.35% of water for the monolayer on the external surface which gives a surface of 49 m2/g. After exposure to 100% RH. 10.8% water was
retained at 11% RH (11). This leaves 9.45% in the interlayer structure. A space of 2.4 mL unoccupied by water was also measured in the structure by helium inflow. Using 1.20 g/mL as the density of the water, referred to earlier, results in a volume of 10.28 mL as the internal space. The surface area for the internal space is 670 m2/g, determined by Winslow and Diamond (24), resulting in
670-49 = 621 m2/g for the interlayer surface, and a hydraulic radius of 1.65
1
(0.165 nm).Assuming that the pores are bounded by two parallel platgs, the average separation between the plates is 3.3 A (0.33 nm) (twice the hydraulic radius). This model is consistent with the internal system
composed of layers separated by, on the average, one water molecule. The impact of this calculation may be enhanced by another simple calculation.
If 9.45% of water is held as a single layer between two sheets, it will cover twice the normal area per molecule, i.e., 10.8 x 2
a2
(0.216 nm2). This results in a surface area of 687.2 m2/g compared to 621 m2/g given by low angle X-ray scattering. This. however, assumes that all the water is held as a single layer, while in fact there may be "kinks" in the alignment of the sheets, leaving room for more than one layer of water. On the other hand, a coverage of 10.8K2
(0.108 nm2) per molecule may be too high.The hydraulic radius can be calculated for the sample when exposed only to 42% RH and where 5.15% water and 2 mL of space exist between the sheets. One gbtains an average hydraulic radius of
1.0 A (0.1 nm), obviously a result of a partially collapsed state.
Calculations of this type have also been obtained from data of Brunauer, Odler and Yudenfreund (261, and Mikhail and Abo-El-Enein (27). In these cases. the internal volume was obtained by measuring the difference between the total water and the total nitrogen porosity; the surface areas were determined by the difference between the surface areas given by Winslow and Diamond (24) and the surface area determined by nitrogen adsorption.
The res;lts calculated from the data of B ~ n a u e r , Odler and Yudenfreund (26) are shown in
Table 2.111 ; an average of 1.23
1
(0.123 nm) was obtained for the four pastes at water/cement ratios between 0.35 and 0.57.In Table 2.IV. the data of Mikhail and Abo-El-Enein (27);corrected forde ree of hydration, give an average value of 2.51
$.
(0.251 nm) when the first value at 18.50% hydration is excluded. These data were obtained for pastes cured at a water/cement---*-*----
TABLE 2. I11
-
Surface areas, porosities and hydraulic radii of portland cement pastes
-s
water/ 'N~,
T N*,
V~,o-V~Z
v
-v
(XI
'H*O N~ cement I ratio mZ/g m2/g m ~ / g S ~ - S ~ 2 0.35 56.7 580-56.7 0.0516 0.99 0.40 79.4 642-79.4 0.0717 q.50 97.3 642-97.3 0.0823 1.51 = 0.57 132.2 670-132.2 0.0617 1.14
---*--- TABLE 2.IV - Internal radius of low porosity pastes
Sample Degree of VHZO-VN2 676-SN Hydraulic
No. Hydration, 2, radius,
P m2/g
ii
I 18.50 0.92 644 14.4 I I 33.80 0.175 628 2.78) I11 49.30 0.144 -646 2.22 IV 57.1 0.155 655 2.36 avg = V 62.0 0.184 667 2.78 2.51 VI 74.1 0.168 668 2.51 VII 78.1 0.166 671 2.48ratio of 0.2. This value is much higher than that obtained from the other data (Table 2.111). but is consistent with other results for low waterlcement ratio pastes. Very low surface areas (27) and relatively low densities (28) are obtained for these pastes, and it must be concluded that there are many kinked regions in the stacking of the sheets and trapped space, due to lack of space during hydration. Thi$ is illustrated in Fig. 2.10, a further modifica- tion of a modification by Daimon et a1 (29) of a model by Feldman and Sereda.
2.3 MERCURY POROSIMETRY
The mercury porosimetry method enables the widest range of pore-size distribution to be measured. The upper diameter limit can be as high as 1000 urn; the lower limit can be as small as 30
1
(3 nm), depending on the pressure available and the contact angle used in the calculation.A review of the porosimetry technique was published
by Orr (30). More recently, Liabastre and Orr (31)
assessed the structure of a.graded series of controlled pore glasses and Nucleopore membranes, both of which have pores with right-cylinder charac- teristics, using both electron microscopy and mercury penetration. The data showed good comparison if a
simple pressure correction was applied. It was suggested that pores are compressed to an hour-glass shape, thereby exhibiting an effectively smaller diameter until mercury actually enters them. Upon the entrance of mercury, the pores expand because of the equalisation of hydrostatic pressure, and return to nearly their original volume. The partial closing and reduction in diameter accounts for the. apparent entry of mercury into pores smaller than they actually are, and the subsequent return to shape explains correct volume measurements.
A survey of the method as applied to cement systems and some results for cement pastes at different water/cement ratios was made by Winslow and Diamond
(32). It was observed that the pore volume left
unintruded by mercury at 15 000 psi (102 MPa) was significantly less than the 28% by volume that should represent gel pores.
Diamond and Dolch (33) again addressed themselves to the problem of whether there is a se arate class of "gel pores" in the range of tens of ingstr8ms. They showed that for a mature paste (318 days old) the pore volume, intruded below about 60 1( (6 nm) in diameter, is not only less than that predicted by a log normal plot, which suggests that all the pores intruded belong 'to a single pore-size distribution. but is almost negligible in absolute terms. The plot of cumulative percentage of pore volume intruded vs pore diameter is given in Fig. 2.11 (33) for this sample. The total pore volume in this sample was measured as 0.306 cm31g. The volume intruded besween pressures corresponding to pore diameters of 77 A
(7.7 nm) and 25
1
(2.5 nm) is only 0.011 cm31g. In their study of capillary porosity, Auskern and Horn (34) showed that the addition of a small amount of water. does not affect the porosity measured by mercury, contrary to the findings of Winslow andDiamond (32). The porosity by mercury intrusion of
an oven-dried sample up to 50 000 psi (340 MPa) was 0.108 cc/g; the oven-dried sample exposed to 5% RH had a porosity of 0.115 cclg. This type of result
was also observed by Beaudoin (35). As a result.
Auskern and Horn (34) used 117 deg as the contact
ENTRANCE
PORE
Fig. 2.10
-
Modification ofFeldman and Sereda model (29)
L 0 . 6 W I C R A T I O PASTE 0 a 8 0
-
318 DAYS-
W Y 0 0 0 0 - 15 0 0 0 p s i R U N u =5
:
1
0 - 5 0 0 0 0 p s i RU.Nz z
6 0-
-
P: w w 0-I1
~2 2 0 4 0-
-
c > 5~ = =%a.
=:
2
20 -%
-
0%,
Ip--9----
0 . 0 0 1 0 . 0 1 0 . I 1 I0 PORE D I A M E T E R . prnFig. 2.11
-
Cumulative mercury pore-size distributionangle for all their work. They also found limited
"-.
.? 24 I I Ipenetration below about 80
b:
(8 nm) and concluded E Uthat the "missing porosity" relative to the porosity
-
as determined by water adsorption must be smaller
than 35
x
(3.5 nm). They found that the porosity-
measured by carbon tetrachloride saturation is close to, but a bit larger than, the porosity measured by mercury penetration. Beaudoin (35) measured total porosity by mercury porosimetry up to 60 000 psi
(408 MPa) pressure and found that mercury porosimetry and helium pycnometric methods could be used
interchangeably to measure porosity if the water/ cement ratio was equal to or greater than 0.40.
These results are shown in Fig. 2.12
(after
ref. 35).Included in this Figure are results for other materials, including porous glass in which mercury
was able to penetrate only 69% of the pore space. E F F E C T I V E P O R E D I A M E T E R , pm
Average pore diameter of this material was measurgd
by other techniques (36) to be between 50 and 60 A Fig. 2.13 - Intrusion curves for a series of
(5 and 6 nm)
.
hydrating C3S pastes (w/c = 0.4) (37)1 I I I I I
0 HYDRATE0 PORTLAND CEMENT PASTE
-
,
/ - / I 0 / L I N E O F-
/ - E Q U A L I T Y-
/ // / 0 I-
'0-
/ + l P O R O U S G L A S S 1-
0? "-
,/'
I-
-
/ 0,
0 / 0 / I I I I I P O R O S I T Y ( H E L I U M P Y C N O M E T R Y I . %Fig. 2.12
-
Mercury porosity vs helium porosityfor hydrated portland cement paste (after ref. 35)
-
It is apparent that the results from the mercury intrusion method agree with those of other techniques described previously, and especially with the helium inflow measurements. The results showed that the porosity was made up of a pore structure into which helium could rapidly enter, and of interlayer spaces
of hydraulic radius less than 1
b:
(0.1 nm) when thepaste is oven dried.
In a study of capillary porosity during hydration of CjS and 'the effect of admixtures, Young (37) found that, on measuring the mercury intrusion, the pastes showed a threshold diameter that decreased with hydration; the results are shown in Fig. 2.13. This was in agreement with the finding of Winslow and
Diamond (32). It was suggested by Young that the
large intrusion immediately below the threshold diameter results from filling of the void spaces between C-S-H gel needles, and the filling of larger pores accessible only through intergrowth of needles.
Diamand (38) investigated the evolution of pore structure of cement paste at two temperatures and two water/cement ratios, 0.4,and 0.6. Results for
W/C = 0.6 in Fig. 2.14 (38) show that there is a
slight difference in the character of the product formed slowly at low temperatures as compared to that formed rapidly at higher temperatures; this shows up in the pore structure. After about one year of hydration, the pore volume of the paste cured at 40°C is higher than that cured at 6OC because of greater
volume of pores smaller than 500 A (50 nm).
I ' ' ' ""'I " " " " I ' ' "-" 0 . 4 0
-
4 b D A Y S 360 D A Y S 0. I0 P O R E D I A M E T E R . 1Fig. 2.14
-
Cumulative pore-size distributions of0.6 w/c cement pastes hydrated at 6OC and at 40°C (38)
2.4 PORE-SIZE DISTRIBUTION BY NITROGEN ADSORPTION AND CAPILLARY CONDENSATION METHODS AND COMPARISON WITH MERCURY POROSIMETRY
Studies have been made (39-41) of pore structure as determined by water vapour adsorption. It has been shown in the previous sections that porosity determined by water is quite different from that determined by other fluids, largely because of the interaction of water molecules.with the solid and their penetration into partially collapsed interlayer spaces. Several authors (42,43) have now confirmed, however, "that the high degree of specificity of water adsorption does not allow water vapour to be used as an alternative to nitrogen for determination of surface area and pore size distribution." It should, therefore, be exploited only to "provide information concerning the chemistry of the solid surface rather than its surface area and texture." This section will thus deal primarily with nitrogen adsorption.
The common method in use is that of "capillary condensation." The pore-sfze distribution data is obtained by applying the Kelvin or similar equation to either the adsorption or desorption isotherm. A number of different assumptions as to pore shape and thickness of the adsorbed film at each stage have been used (44-50), leading to some variation in calculation methods. However, in contrast to the wide range of sizes that can be determined by mercury porosimetry, capillary condensation methods are limited essentially to pores of diameters between a few tens to several hundreds of 8ngstrGms. The lower limit associated with capillary condensation methods depends on the particular isotherms, but it is generally accepted that the Kelvin equation tends to break down for micropores. Kadlec and Dubinin
(51) presented data suggesting that the Kelvin equation does not apply for pore diameters as small
as 35 to 40 8, (3.5 to 4 nm). They concluded that
this equation is inapplicable at relative vapour pressures slightly higher than those at which the adsorption-desorption hysteresis loop closes, and appears to be a characteristic of the adsorbate. The limiting diameters range from 20 to 35 8, (2 to 3.5 nm) for various adsorbates.
Recently Winslow (52) reported results that showed satisfactory agreement between mercury porosimetry and nitrogen adsorption for porous alumina in the pore range 500 to 40
A
(50 to 4 nm).In a comprehensive study of a variety of pastes of portland cement and C3S, Bodor et a1 (53) found a maximum for the pore-size distribution atoaround 12
8.
(1.2 nm) hydraulic radius, i.e., 48 A (4.8 n.n) diameter with the assumption of cylindrical pores. In a review, Diamond (54) observes that most plots in the literature display strong maxima between 30and 50
8,
(3 and 5 nm). Bodor states that no micro-pores are measured in hydrated portland cement by this technique nor by the "t-method." However, Diamond (54) observed that the cumulative volume determined by mercury intrusion was not too different from that by capillary condensation for pores 100 to 400 8, (10 to 40 nm) in diameter; below 100 8, (10 nm) this is not the case. The capillary condensation data by some workers show steep slopes and consider- able pore volume below 100 8, (10 nm) and particularly
below 50
8
(5 nm). This fact led Diamond (54) tosuggest that large amounts of the C-S-H were
encapsulated by calcium hydroxide and unintrudable by at least mercury, but the work of Auskern and
Horn (34) and the helium pycnometric work dispels this idea and, in any event, the pore-size distribu- tion by mercury intrusion should still be reasonably representative of the whole of the distribution. Diamond (54) usediradius ?f gyration results obtained by Winslow (52) in his low-angle X-ray scattering work, and calculated mean diameters, assuming various models. He obtained a mean diameter of approximately 300 8, (30nm) assuming a cylinder of equal length and
diameter. Mikhail, Turk and Brunauer (55) later
refuted this work on the basis that the calculated ,
surface area was too low. They used both radius of gyration and hydraulic radius to calculate the dimensions of an average cylindrical pore and
obtainei a diameter of 47.2
1
(4.72 nm) and a lengthof 466 A (46.6 nm). These authors, however, had
obtained their hydraulic radius by water adsorption which, as stated previously, is not valid.
Most recent work by Daimon et a1 (29) presented results on leached and unleached C3S. Accordingly, the pore volume of an unextracted Ca(OH)2 sample should be multiplied by 1.43 to compare it with the extracted paste. In fact, it was found that the pore volume determined by nitrogen adsorption was 1.39 times the values of the unextracted pastes, suggest- ing that Ca(OH)2 does not engulf any appreciable volume of C-S-H. Work by Feldman and Ramachandran
(56) with the helium flow technique lead to the same conclusion.
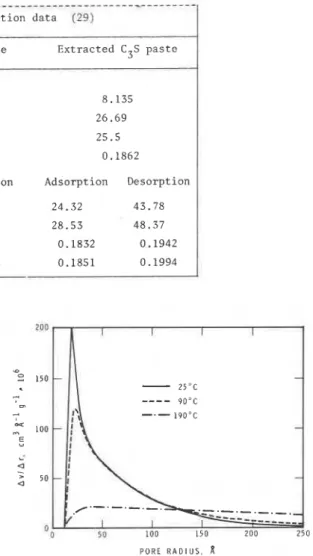
The pore-size distributions obtained by Daimon et a1 (29) are presented in Fig. 2.15 and Table"2.V. In this table, columns are given for the calculation of pore distribution using both the adsorption and desorption isotherm, and for parallel plate
(Sppl Vpp) or cylindrical pores (Scp, Vc ) . Best fit IS .given by the adsorption curve, an$ both models give a reasonable fit although the cylindrical model is better for the extracted paste. This is deter- mined by comparing calculated values with SBET and
Vp in the upper part of Table 2.V (29). The
hydraulic radius gives the pore diameter down to about 60 8, (6 nm), assuming a cylindrical model. Results by Collepardi (57) are shown in Fig. 2.16. Pore-size distribution by nitrogen capillary condensation shows that room temperature curedC3S
a U N E X T R A C T E D C 3 S P A S T E
1
E X T R A C T E D C j S P A S T E 0-
"
20-
--
-
m d 0 N I T R O G E N c a "-, E . " ,,.oP ; 10-
--
P
l o -a-
> a I 0 20 40 60 80 1 0 0 0 20 4d 60 80 1011 H Y D R A U L I C R A D I U S . fiFig. 2.15 - Pore-size distribution derived from adsorption isotherms (adsorption branches of N isotherms were used for calculation)
- - - + - - -
TABLE 2.V
-
N2 adsorption data ( 2 9 )Parameter Unextracted C3S paste Extracted C3S paste
vm
(cm3/g) 4.177 8.1352
sBET
(m /g) 18.17 26.69st (m2/g) 17.5 25.5
Vp (ml/g) 0.1342 0.1862
Adsorption Desorption Adsorption Desorption
spp
(m2/g) 18.09 33.43 24.32 43.78Svp (m2/g) 21.09 42.00 28.53 48.37
Vpp (ml/g) 0.1340 0.1412 0.1832 0.1942
Vep (ml/g) 0.1358 0.1453 0.1851 0.1994
paste has a maximum at about 20 1 (2 nm) pore radius,
although the average value appears to be much higher. It is also shown that by hydrating at different temperatures the reduction in pore volume is due almost exclusively to the decrease in volume of the
smaller pores down to about 60
1
(6 nm) radius.These results show general agreement with mercury intrusion, although nitrogen capillary condensation techniques indicate, in some cases, greater volumes in small pores. This difference may be explained, however, by the fact that "t"-curves are important in the calculation of the small pore distribution and measuring the appropriate "t"-curve is difficult for hydrated portland cement. In addition, the validity of their application for small pores is debatable.
REFERENCES (SECTION 2)
1.- R. Sh. MIKHAIL, L.E. COPELAND and S. BRUNAUER (1964), "Pore structure and surface areas of hardened portland cement pastes by nitrogen
adsorption," Can. J. Chem. 42, 426-438.
2.- R.F. FELDMAN (1972), "Density and porosity studies of hydrated portland cement," Cem.
Technol. 3, 5-14.
3.- G.G. LITVAN (1976), "Variability of the nitrogen
surface area of hydrated cement paste," Cem. Concr. Res. 6, 139-144.
4.- R.F. FELDMAN and V.S. RAMACHANDRAN (1974), "A study of the state of water and stoichiometry of bottle-hydrated CagSi05,tt Cem. Concr. Res. 4, 155-166.
P O R E R A D I U S , 1
Fig. 2.16 - Pore-size distribution in 3CaO.Si02 hydrated for 1 day at different temperatures (57)
5.- R.F. FELDMAN and J.J. BEAUDOIN (1976), "Structure and.properties of porous cement systems and their
modifications by impregnants ," Proc. Conf.
Hydraulic Cement Pastes: Their Structure and Properties, held at Univ. Sheffield, Cem. Concr. Assoc., pp. 150-165.
6.- R.F. FELDMAN (1973), "Changes to structure of hydrated portland cement on drying and rewetting observed by helium flow techniques," Cem. Concr. Res. 4, 1-11.
7.- R.F. FELDMAN (1975), "Mechanism of creep of hydrated portland cement paste," Cem. Concr. Res. 5, 577-586.
8.- B. HOPE and N. BROWN (1975), "A model for the creep of concrete," Cem. Concr. Res. 5, 577-586.
9. - N. BROWN and B. HOPE (1976), "The creep of
-
hydrated cement paste," Cem. Concr. Res. 6, 475-486.10.- A. BENTUR, N.B. MILESTONE, J.F. YOUNG and S. MINDESS (1979). "Creep and drying shrinkage of calcium silicate pastes. IV. Effects of accelerated aging," Cem. Concr. Res. 9 , 161-170. 11.- R.F. FELDMAN (1973), "Helium flow characteris-
tics of re-wetted specimeis of dried portland
, cement paste," Cem. Concr. Res. 3, 777-790.
12.- D.1I.C. HARRIS, C.G. WINDSOR and C.D. LAWRENCE (1974). "Free and bound water in cement pastes," Mag. Concr. Res. 26, (87), 65-72.
13.- R.F. FELDMAN (1973), "Volume change, porosity and helium flow studies of hydrated portland cement," Proc. RILEM/IUPAC Int. Symp. Pore Structure and Properties of Materials-, Prague, Vol. I, pp. C101-116.
14. - P. SELIGMAN (1968), "&clear magnetic resonance studies of the water in hardened cement paste," J. PCA Res. Develop. Lab. 10, 52-65.
15,- H. OCHIAI, H. YAMAMURA, K. IIUKENAGA. I. MAKI and K. WATANABE (1965), "A nuclear magnetic study of the water in calcium silicate pastes,".Bull. Amer. Soc. Japan, 38, 945-948.
16.- C.G. WINDSOR and B.T.W. WILLIS (Editor) (1973), "Chemical applications of thermal neutron scattering," London, Oxford Univ. Press, p.130. 17.-.S. OLEJNIK, C.G. STIRLING and W. WHITE (1970),
"Neutron scattering studies of hydrated layer silicates," Faraday Society special discussion on thin liquid films and boundary layers, London, Academic Press, pp. 194-201. 18.- R.A. HELMUTH and D.H. TURK (1966), "Elastic
moduli of hardened cement and tricalcium silicate pastes: effect of porosity," Symp. Structure of Portland Cement Paste and Concrete, Washington, D.C., Highw. Res. Bd. Spec. Rep. 90, pp. 135-144.
19.- G.J. VERBECK and R.A. HELMUTH (1968),
"Structures and physical properties of cement pastes," Proc. Fifth Int. Congr. Chemistry of Cement, Tokyo, Vol. 111, pp. 1-32.
20.- J.J. BEAUDOIN and R.F. FELDMAN (1978), "The significance of helium diffusion measurements in studying the removal of structural water in inorganic hydrated systems," Cem. Concr. Res. 8, 223-232.
21. - R. F. FELDMAN (1968), "Sorption and length-change. scanning isotherms of methanol and water on hydrated portland cement." Proc. Fifth Int. Congr. Chemistry of Cement. Tokyo. Vol. 111, pp. 36-44.
22.- R.F. F E L D W (1972), "Helium flow and density measurement of the hydrated tri-calcium silicate-water system," Cem. Concr. Res. 2. 123-136.
I
23.- R.F. FELDMAN (1971). "The flow of helium into the
'
terlayer spaces of hydrated portland ceme,. qaste," Cem. Concr. Res. 1. 285. 24.- D.N. WINSLOW and S. DIAMOND (1974). "Specificsurface of hardened portland cement paste as determined by small-ingle X-ray scattering." J. Am. Ceram. Soc. 57, 193-197.
25.- R.F. FELDMAN (1971), "Assessment of
experimental evidence for models of hydrated portland cenent." Highw. Res. Bd. Rec. 370, pp. 8-24.
26.- S. BRUNAUER, I. ODLER and M. YUDENFREUND (1970). "The new model of hardened portland cement paste," Highw. Res. Bd. Rec. 328, pp. 89-107. 27.- R.'SH.MIKHAIL and S.A. ABO-EL-ENEIN (1972),
"Studies of water and nitrogen adsorption on hardened cement pastes. I. Development of surface in low porosity pastes," Cem. Concr. Res. 2, 401-414.
28.- R.F. FELDMAN and J.J. BEAUDOIN (19761, "Microstructure and strength of hydrated cement," Cem. Concr. Res. 6, 389-400.
29.- M. DAIMON, S. ABO-EL-ENEIN, G. HOSAKA, S. GOT0 and R. KONDO (1977), "Pore structure of calcium silicate in hydrated tricalcium silicate," J. Am. Ceram. Soc., 60, 110-114.
30.- C. ORR (1970), "Application of mercury penetration to materials analysis," J. Powder Technol. 3, 117-123.
31.- A.A. LIABASTRE and C. ORR (1978). "An evaluation of pore structure by mercury penetration," J. Colloid and Interface Sci. 64, 1-18. 32.- D.N. WINSLOW and S. DIAMOND (1970), "A mercury
porosimetry study of the evolution of porosity in portland cement." ASTM J. Mater. 5, 564-585. 33.- S. DIAMOND and W. DOLCH (1972), "General
log-normal distribution of pore sizes in
hydrated cement paste," J. Colloid and Interface Sci. 38. 234-244.
34.- A. AUSKERN and W. HORN (1973), "Capillary porosity in hardened cement paste." ASTM J. Test. Eval. 1, 74-79.
35.- J.J. BEAUDOIN (1979). "Porosity measurements of some hydrated cementitious systems by high pressure mercury-intrusion
-
microstructural limitations." Cem. Concr. Res. 9 , 771-781. 36.- C.H. AMBERG and R. McINTOSH (1952). "A study ofhysteresis by means of length changes of a rod of porous glass," Can. J. Chem. 30, 1012. 37.- J.F. YOUNG (1974), "Capillary porosity in
hydrated tricalcium silicate pastes," J. Powder Technol. 9. 173-179.
38.- S. DIAMOND (1973). "Pore structure of hardened cement paste as influenced by hydration
temperature," Proc. RILEM/IUPAC Int. Symp. Pore Structure and Properties of Materials. Prague, Vol. I, pp. 873-88.
39.- R. Sh. MIKHAIL, S. BRUNAUER and E.E. BODOR (1968), "Investigations of a complete pore structure analysis. I. Analysis of
micropores," J. Colloid and Interface Sci. 26, 45.
40.- J. HAGYMASSY and S. BRUNAUER (1970), "Pore structure analysis by water vapor adsorption. 11. Analysis of five silica gels," J. Colloid and Interface Sci. 33, 317.
41.- J. HAGYMASSY, I. ODLER, M. YUDENFREUND, J. SKALNY and S. BRUNAUER (1972), "Pore structure analysis by water vapour adsorption. 111. Analysis of hydration calcium silicates and portland cements," J. Colloid and Interface Sci. 38, 20-34.
42.- R. Sh. MIKHAIL, S. NASHED and K.W. SING (1973), "The adsorption of water by porous hydroxylated silicas," Proc. RILEM/IUPAC Int. Symp. Pore Structure and Properties of Materials, Prague, Vol. IV, pp. C157-164.
43.- K.S.W. SING (1973), "A discussion of the paper 'Complete pore structure analysis' by
S. Brunauer, J. Skalny and I. Odler," Proc. RILEM/IUPAC Int. Symp. Pore Structure and Properties of Materials, Prague, Vol. 4, pp. C209-210.
44.- E.P. BARRETT. L.G. JOYNER and P.P. HALENDA (1951), "The determination of pore volume and area distribution in porous substances. I. Computations from nitrogen isotherms," J. Am. Chem. Soc. 73, 373-380.
45.- C. PIERCE (1953), "Computations of pore sizes from physical adsorption data," J. Phys. Chem. 57, 149-152.
46.- W.P. INNES (1957), "Use of a parallel plate model in calculation of pore size distribution," Anal. Chem. 29, 1069-1072.
47.- R.W. CRANSTON and F.A. JNKLEY (1957), "The determination of pore structures from nitrogen adsorption isotherms," Adv. Catal. 9, 143-154.
48.- D. DOLLIMORE and G.R. HEAL (1964), "An improved method for the calculation of pore size
distribution from adsorption data," J. Appl. Chem. 14, 109-114.
49.- B.F. ROBERTS (1967), "A procedure for
estimating pore volume and area distributions from sorption isotherms," J. Colloid and Interface Sci. 23, 266-273.
50.- S. BRUNAUER, R. Sh. MIKHAIL and E.E. BODER (1967), "Pore structure analysis without a pore shape model," J. Colloid and Interface Sci. 24, 451-463.
51.- 0. KADLEC and M.M. DUBININ (1969), "Comments on the limits of applicability of the mechanism of capillary condensation," J. Colloid and
Interface Sci. 31, 479-489.
52.- D. WINSLOW (1978), "The validity of high pressure mercury intrusion porosimetry," J. Colloid and Interface Sci. 67, 42-47. 53.- E.E. BODOR, J. SKALNY, S. BRUNAUER, J. HAGYMASSY
and M. YUDENFREUND (1970), "Pore structures of hydrated calcium silicates and portland cements by nitrogen adsorption," J. Colloid and
Interface Sci. 34, 560-570.
54.- S. DIAMOND (1971), "A critical comparison of mercury porosimetry and capillary condensation pore size distributions of portland cement pastes," Cem. Concr. Res., 1, 531-545.
55.- R. Sh. MIKHAIL, D. TURK and S. BRUNAUER (1975), "Dimensions of the average pore, the number of pores and the surface area of hardened portland cement paste," Cem. Concr. Res. 5, 433-442. 56.- R.F. FELDMAN and V.S. RAMACHANDRAN, unpublished
data.
57.- M. COLLEPARDI (1973), "Pore structure of hydrated tri-calcium silicate," Proc. RILEM/IUPAC Int. Symp. Pore Structure and Properties of Materials, Prague, Vol. 1, pp. 825-49.
This publication i s being distributed by the Division of Building R e s e a r c h of the National R e s e a r c h Council of Canada. I t should not be reproduced in whole o r in p a r t
without p e r m i s s i o n of the original publisher.
The
Di-vision would b e glad to be of a s s i s t a n c e in obtaining
such p e r m i s s i o n .
Publications of the Division m a y b e obtained by m a i l - ing the a p p r o p r i a t e r e m i t t a n c e (a Bank, E x p r e s s , o r P o s t Office Money O r d e r , o r a cheque, m a d e payable to the R e c e i v e r General of Canada, c r e d i t NRC) t o the
National R e s e a r c h Council of Canada, Ottawa. K1A OR 6 .
Stamps a r e not acceptable.
A l i s t of allpublications of the Division i s available and m a y b e obtained f r o m the Publications Section, Division of Building R e s e a r c h , National R e s e a r c h Council of