Publisher’s version / Version de l'éditeur:
Vous avez des questions? Nous pouvons vous aider. Pour communiquer directement avec un auteur, consultez la première page de la revue dans laquelle son article a été publié afin de trouver ses coordonnées. Si vous n’arrivez pas à les repérer, communiquez avec nous à PublicationsArchive-ArchivesPublications@nrc-cnrc.gc.ca.
Questions? Contact the NRC Publications Archive team at
PublicationsArchive-ArchivesPublications@nrc-cnrc.gc.ca. If you wish to email the authors directly, please see the first page of the publication for their contact information.
https://publications-cnrc.canada.ca/fra/droits
L’accès à ce site Web et l’utilisation de son contenu sont assujettis aux conditions présentées dans le site
LISEZ CES CONDITIONS ATTENTIVEMENT AVANT D’UTILISER CE SITE WEB.
Canadian Journal of Civil Engineering, 22, 4, pp. 770-784, 1995-08-01
READ THESE TERMS AND CONDITIONS CAREFULLY BEFORE USING THIS WEBSITE. https://nrc-publications.canada.ca/eng/copyright
NRC Publications Archive Record / Notice des Archives des publications du CNRC :
https://nrc-publications.canada.ca/eng/view/object/?id=1513b076-e602-4715-9a25-0603485ab463 https://publications-cnrc.canada.ca/fra/voir/objet/?id=1513b076-e602-4715-9a25-0603485ab463
Archives des publications du CNRC
This publication could be one of several versions: author’s original, accepted manuscript or the publisher’s version. / La version de cette publication peut être l’une des suivantes : la version prépublication de l’auteur, la version acceptée du manuscrit ou la version de l’éditeur.
Access and use of this website and the material on it are subject to the Terms and Conditions set forth at
Effects of roof size, heat transfer, and climate on snow loads: studies
for the 1995 NBC
http://www.nrc-cnrc.gc.ca/irc
Effe c t s of roof size , he a t t ra nsfe r, a nd c lim a t e on snow loa ds :
st udie s for t he 1 9 9 5 N BC
N R C C - 3 7 8 5 0
I r w i n , P . A . ; G a m b l e , S . L . ; T a y l o r , D . A .
A u g u s t 1 9 9 5
A version of this document is published in / Une version de ce document se trouve dans:
Canadian Journal of Civil Engineering, 22, (4), pp. 770-784, August 01, 1995
The material in this document is covered by the provisions of the Copyright Act, by Canadian laws, policies, regulations and international agreements. Such provisions serve to identify the information source and, in specific instances, to prohibit reproduction of materials without written permission. For more information visit http://laws.justice.gc.ca/en/showtdm/cs/C-42
Les renseignements dans ce document sont protégés par la Loi sur le droit d'auteur, par les lois, les politiques et les règlements du Canada et des accords internationaux. Ces dispositions permettent d'identifier la source de l'information et, dans certains cas, d'interdire la copie de documents sans permission écrite. Pour obtenir de plus amples renseignements : http://lois.justice.gc.ca/fr/showtdm/cs/C-42
NKCC·-378
770Effects of roof size, heat transfer, and
climate on snow loads: studies for the
1995 NBC
P.A. Irwin, S.L. Gamble, and D.A. Taylor
Abstract: As roof sizes increase, the ability of the wind to reduce the uniform snow loads is diminished, thus resulting in higher uniform loads. Results of recent research iilto this size effect and the influence of heat lossthroughfoofs infOUf Canadian cities (St. John's, Montreal, Saskatoon. and
Edmonton) using the finite area element method are described and snow load formulae for uniform
loads on large roofs are proposed. Also, the drift loading on lower roofs adjacent to large area u?per
roofs has been studied using similar techniques, and revised formulae for the peak loadingゥョセ the drift at
the step are put forward taking into account the size of the upper roof and the presence of parapets. The snow load provisions developed in this paper have been proposed for the 1995 edition of the National
Building Code.
Key words: snow loads, drift loads, uniform loads, large flat roofs, size effect, heat loss, finite area element method, computational fluid dynamics.
Resume; Compte tenu que la dimension des toitures augmente, Ia reduction des surcharges de neige uniformes par I'action du vent diminue, ce qui entraine des surcharges uniformes plus elevees. Les resuItats d'une recherche recente sur cet effet du dimensionnement ainsi que sur les :deperditions de chaleur de toitures d'habitations situees dans quatre viIles canadiennes (Saint-Jean, Montreal, Saskatoon et Edmonton)
a
I'aide de Ia methode des elements de surface finis sont decrits ete des formules de surcharges de neige uniformes pour toits de grandes dimensions sont proposees. De plus, les surcharges de neige balayee par Ie vent sur les toits en contrebas de toitures de grandes dimensions ant ete etudiees it I'aide de techniques sembiables et des formules revisees de surcharges de pointe sont proposees en tenant compte de Ia dimension des toits superieurs et de Ia presence de murs en surelevation. Ces dispositions relatives aux surcharges de neige ont ete proposees pour I'edition 1995 du Code national du batiment.Mots eMs; surcharges de neige, surcharges de neige balayee par Ie vent; surcharges uniformes, toits
plats de grandes dimensions, effet du dimenskmnement, deperdition de chaleur, methode des elements de surface finis, dynamique des fluides de calcul.
[Traduit par la redaction]
1. Introduction
Snow loads on roofs are influenced by many factors, making development of building code provisions difficult. One of these factors is wind, which can drift large quantities of snow from one part of a roof to another, resulting in significant
increases of the load in certain areas, or reductions in others
as snow is blown away or off the roof. Snow drift formations are highly dependent on the detailed wind velocity patterns
Received March 28, 1994.
Revised manuscript accepted November28, 1994.
P.A. Irwin and S.L. Gamble. Rowan Williams Davies and
Irwin Inc., 650 Woodlawn Road West, Guelph, ON NIK IB8,
Canada.
D.A. Taylor. Institute for Research in Construction, National
Research Council Canada, Ottawa, ON KIA OR6, Canada.
Written discussion of this paper is welCOmed and will be
received by the Editor until December 31, 1995 (address
inside front cover).
over the roof which are in turn a function of wind direction and duration, roof geometry, and the local surroundings near the building. In areas where the wind is accelerating, there will be removal of snow, since more is drifting out of the area than into it. In areas of decelerating wind the snow will accumulate, since more drifts in than out. Thus slow velocity areas in front of and behind obstacles on roofs or steps in roof elevation tend to be areas of accumulation, because they are areas of sudden deceleration.
Scale model tests in water flumes and wind tunnels have often been used (Irwin and Williams 1983; Kind 1986; Isyumov 1971) to help designers define in a qualitative way where snow will accumulate on and around a structure. They have been used primarily to simulate a "single event" where the wind blows from a particular direction for a period of time. Carrying them further than the single event to include the cumulative effects of changing wind directions, wind speeds, successive snowfalls, melting, rain, roof heat trans-fer, etc. is much more complex and has rarely been attempted. However, there has long been a need for a method of includ-Can. J. Civ. Eng. 22: 770-784 (1995). Printed in Canada / Imprime au Canada
lng all these cumulative effects to greatly enhance the useful-ness of such studies, taking them from being merely qualita-tive to being more precise and quantitaqualita-tive.
It was with this need in mind that in 1986, at the time the Toronto SkyDome was being designed, the finite Area ele-ment (FAE) method was developed by Rowan Williams Davies and Irwin Inc. The FAE method, the basic principles of which are outlined in Sect. 2, was originally intended for use on big one-of-a-kind structures such as the SkyDome where accurate knowledge of the snow loading is critical to striking the right balance between safety and cost. However, it is a useful tool in other circumstances including generic studies of typical roof snow loading problems addressed by building codes. The primary purpose of this paper is to describe recent findings of studies to improve the 1995 National Building Code (NBC).
One of the advantages of the FAE method is that it allows general trends, such as the dependence of roof snow loads on factors such as roof size, ground snow load, roof insulation, and windiness of the site, to be more readily identified than through examination of available field measurements, which tend to be few and far between because of the duration of sur-veys and their costs (Taylor 1980, 1992).
Two cases are discussed in this paper: (i)snow loads on flat roofs and their dependence on roof size and (ii) snow loads in the drifts that form on low roofs adjacent to high ones and their dependence on the size of the upper level roofs and other factors. Before proceeding to these, however, a brief description of the FAE method is given, since it is the main tool used to reach the conclusions given in this paper.
2. The finite area element method
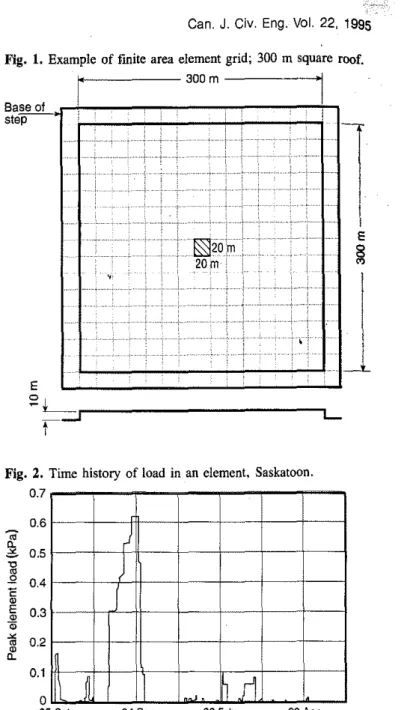
The heart of the FAE method is a computer simulation pro-gram, which uses long-term hourly and daily meteorological records, and which superimposes a grid system on the roof thus dividing it into a large number of small but finite area elements; hence the name of the method. Figure I illustrates the grid used for the 300 m x 300 m flat roof studied. Values for the wind velocities at a small reference height, usually I m, above the roof surface at the four corners of each elemental area are used by the computer program to compute the snowdrift fluxes through the sides of the element. Empir-ical relationships based on field data are used to relate drift rate to wind velocity. To obtain the required wind velocities at each grid node, wind tunnel tests are usually undertaken in which the local velocities are measured as a fraction of some selected reference value, high above the building. When the results of the wind tunnel tests are combined with the hourly meteorological wind records, a set of velocities over the roof corresponding to any particular date and time can be established. Alternatively, for simple shapes such as flat roofs the velocities can be estimated, without wind tunnel tests, directly from the meteorological records and general knowledge of wind flow over buildings.
In the FAE method the computations are completed for every area element and, by evaluating the snow fluxes into and out of each area, the change in snow mass contained within each element during a selected time interval, usually I h, is determined. This procedure is repeated for a whole series of time steps, covering first one winter, and then a
whole series of winters. Ifthe meteorological records show that, in addition to drifting, snow was falling during a partic-ular time interval, then the change in snow mass in each ele-ment due to this is incorporated. Likewise, if the heat balance within the snowpack permits melting, then the mass of snow turning to the liquid state is computed. Ifthe snow is satu-rated, then the liquid water is allowedtodrain out, otherwise it is held within the snowpack. Rain falling onto the snow is treated as additional liquid water in this calculation. Refreez-ing when the temperature drops is also computed. There is also an on - off switch that monitors whether the snow has been rained upon or has melted, in which case drifting is turned off. Ifnew snow subsequently arrives, then drifting is turned back on, at least until all the new snow has drifted away and the old layer of snow below is reached again.
The end result of an FAE simulation is a complete time history of the average snow load in each area element on the roof for every hour for about 30 winters typically. Then the output is analyzed statistically to determine extreme snow loads or extreme values of other meteorological quantities. This allows computation of quantities such as 30-year return uniform and drift loads.
This description is intended only to illustrate the overall approach of the FAE method. More details are provided in Appendix A and in Irwin and Gamble (1989) and Gamble et al. (1992).
3. The effect of roof size on uniform loads
3.1. Background
The National Building Code of Canada (NBC 1990) provi-sions for the snow load, S, are in the form
[I] S= S,(CbCwC,C,)
+
S,where S, is the 30-year return ground snow load; Cb is the basic snow load factor of 0.8; Cw is the wind exposure fac-tor (= 1.0,0.75, or 0.5); C, is the slope factor (= 1.0 for flat roofs); C, is the accumulation factor; and S, is the rain load corresponding to S,. For sites that are not exposed, the
snow load on a flat roof, excluding the rain component, is
0.8S" regardless of roof size, the 0.8 factor (Cb) being a basic allowance for snow removal by light winds and by heat transfer through the roof.
Although none of the factors Cb, Cw' C" and C, are func-tions of roof size in the 1990 NBC, there are good reasons,
however, for expecting an increase in the uniform snow load
as roofs become very large. For successively larger roofs to the extreme of an infinite size, there appears to be little rea-son, apart from the secondary influence of heat transfer through the roof, why the roof load would be different from the ground load. The main reasons current codes do not account for roof size are probably lack of data on large roofs and the fact that for the majority of roofs the size effect is not discernible. However, in recent years the large size of some manufacturing and warehouse facilities has increased the need to evaluate this further (Taylor 1992).
3.2. Square roofs
3.2.1. Scope of studies
772 Can. J.Civ. Eng. Vol. 22, 1995
/
)
I
fl
Inn
0.6 E;:!L....
-t...
' - - - , L
ing over the edge of the roof could be used for assessing snow loads on lower level roofs near roof steps. Loads on lower level roofs are discussed later in Sect. 4.
The orientation of the roofs was set so that the edges were aligned parallel to the north - south and east - west direc-tions. While it is recognized that roof orientation is a factor that could affect the snow loads, the effects would be rela-tively minor for square roofs.
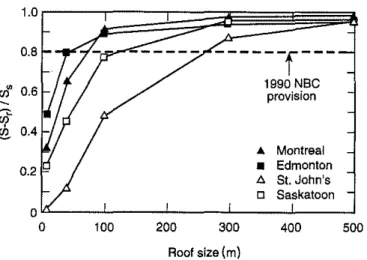
Figure 2 shows a typical time history of snow load in one of the FAE elements during one winter, the load shown being the average over the area of the element. For a given roof case (a case being specified by roof size, city, and site exposure), similar time histories were generated for all area elements for 33 winters. The highest (average) element load for each winter was then identified, regardless of which ele-ment it was in. Due to the uniformity of the wind velocity field, the distribution of the loads on the large flat roofs examined in this study was also relatively uniform for the majority of the central portion of the roof. This means that
Nセセ
_ 0.5セ
0.4 E セ.§
0.3 セ セ 0.2 0.1o
25 Oct. 24 Dec. 22 Feb. 23 Apr.
24 Nov. 23 Jan. 24 Mar. 23 May
Fig. 2. Time history of load in an element, Saskatoon. 0.7
Fig. 1. Example of finite area element grid; 300 rn square roof.
I'
300m'I
Baseof step Table 1. Average winter temperatures, precipitation, and wind
speeds.
Average Average Average Average
annual winter winter winter
snowfall rainfall temperature wind speed
City (rnmH2O) (mmH2O) CC) (km/h) Saskatoon 109 3 -14.2 16.9 Edmonton 136 5 -10.0 13.2 Montreal 235 108 -7.1 17.7 51. lohn's 359 311 -3.1 27.2 3.2.2. Procedures
Figure I shows an example of a FAE grid system for a 300 m x 300 m square roof. A 20 m grid was used for the square roofs of 40, 100, 300, and 500 m side length. To allow the effect of grid size to be assessed, results were also obtained using a 10 m grid for the 40 and 100 m roofs. For the 10 m square roof, results were obtained using both 5 and 2.5 m grids. The grid system was continued for one element beyond the edge of the roof so that the quantity of snow pass-roofs of various sizes. Initial results were reported by Irwin et al. (1992) and the final results are described here. Squiue plan form buildings 10 m high with horizontal dimensions ranging from 10 to 500 m were studied for four Canadian cities: Edmonton, Alberta; Saskatoon, Saskatchewan; Montreal, Quebec; and St. John's, Newfoundland. The cities were chosen to cover a range of climatic conditions. Table I
gives their average annual snowfalls, winter rainfalls, winter temperatures, and winter wind speeds.
The winter months were taken to be December through March inclusive. Saskatoon experiences very cold winters with less snow than the other cities and almost no rain. Edmonton is not quite as cold but has more snow and still very little rain. Montreal is warmer than Edmonton and has
more snow and much more rain. St. Jaho' s is the warmest
of the four cities and has the most snow, the most rain, and the most wind. The FAE simulations were run for 33 winters for each city using l-h time steps. Results were obtained for two different wind exposures, a typical suburban site (cor-responding to a location that the NBC would call sheltered) and a typical open country site (that the NBC would classify as exposed).
The wind velocity field at a level of I m above the roof was taken to be the same at all points, Le., uniform, and equal to that at roof height in the undisturbed approaching flow. It is recognized that local nonuniformities in the veloc-ity field are present near the upwind edges of flat roofs, par-ticularly near the corners. The local drifts or scour regions caused by such nonuniformities, however, tend not to be sensitive to roof size (being near the upwind edge) and, for the normal roof sizes addressed by the current code, are effectively already covered by the coefficients Cb and C,.
The emphasis in the present studies was on the trends due to
roof size, heat loss, and climate. Local nonuniformities in
wind velocity and drifting also occur near obstructions such as mechanical equipment, penthouses, and skylights. Drifts due to such obstacles were not addressed in the present studies.
Fig. 3. Extreme value plot of load in 20 m square element,
100m square roof, Montreal.
Table 2. Fresh snow、・ョセゥエゥ・ウ and liquid water
retention as used·by the analytical model.
the highest element load was representative of the loading on much of the roof. Edge regions showed some reductions through snow being drifted off of the roof. Using the 33 extreme loads thus obtained, an extreme value analysis was then undertaken using standard methods. Figure 3 illustrates this type of analysis, showing a typical fit of a Fisher-Tippet type I probability distribution to the annual extreme element loads generated by the FAE simulation. In this plot, P is the probability that a given load will not be exceeded in anyone winter. The Fisher - Tippet type II and lognormal
distribu-tions were also examined as alternative assumpdistribu-tions for the
probability distribution of the extremes. As will be described later, the end results of the FAE studies, where the roof snow loads were expressed as a fraction or multiple of ground load, were not very sensitive to the precise form of prob-ability distribution assumed when curve-fitting the annual extremes, provided the same form of probability distribution was used for ground and roof loads.
In addition to the 3D-year load in a single area element, that averaged over the whole roof was also determined. It was typically 65% and 80%, respectively, of the 3D-year single element load for the open and suburban exposures. Attention will be focused in this paper on the loads on the
individual area elements, since the element sizes are typical
of structural bay sizes.
As an overall check on the portions of the simulation not involving wind and as a means of calibrating these portions, the 3D-year return period ground load for each city was first computed and compared with the corresponding values in the NBC. The ground load was computed by running the simula-tion for a hypothetical area element totally sheltered from the wind so that no snow drifted in or out. The exact values obtained depended to some extent on the type of probability distribution assumed from the extremes, Le., Fisher-Tippet type I, Fisher - Tippet type II, or lognormal. However, regardless of the distribution assumed, exact agreement with the NBC 3D-year return period ground loads could be forced by making minor adjustments to the assumed density of fresh snow and to the assumed maximum liquid water retention capacity of the snow (see Appendix A.5). Since there is some uncertainty and significant variability in these parameters, particularly the latter, and since the NBC ground snow loads
0 Annual maxima
/ '
- - Regressionop7
•
30-year predictionf
L
0m¢
0 ['7
""
1.2 1.0 '((j 0.8 0.. 6 0.6iil
.3
0.4 0.2a
-2 -1a
-In(-ln(P)) 2 3 4Fresh snow Liquid water density capacity City (kg/m3 ) (% by weight) Saskatoon 115 60 Edmonton 95 58 Montreal 120 58 St. John's 120 21
are based on field measurements and form the starting point for all code snow .load calculations, the approach was adopted of forcing agreement with the NBC ground loads using adjustments ofthe fresh snow density and liquid water retention capacity (Table 2) to achieve this. The liquid water retention capacity in Table 2 is the liquid waterエィ。セ can be retained in the snowpack expressed as the percentage of the weight of snow in the pack. The 3D-year return period ground load was predicted by fitting a Fisher - Tippet type I distribution to the annual FAE extreme ground snow loads.
3.2.3. Results with no roof heat transfer
Initially, FAE simulations were run assuming, conserva-tively, a perfectly insulated roof, Le., no heat transfer through the roof. Figures 4 and 5 show the results expressed in the form of the peak snow load (in an element), evaluated as described in Sect. 3.2.2, as a function of roof size for the open and suburban (Le., sheltered) exposures. To make the results comparable with the NBC format for the snow load, the vertical scale shows the quantity (S - S,)/S, which, from [I] with C, = J. 0, is equivalent to CbCwC,. The effects ofrain soaking into snow were automatically included in the FAE simulation, but S, was not specifically evaluated as a separate quantity. To ease comparison with the code, the NBC value of S, (Climate Supplement 1990) was subtracted from the total load, S, in forming the ratio (S - S,)/S,
shown in Figs. 4 and 5. These S, values were 0.1, 0.1, 0.4, and 0.6 kPa for Saskatoon, Edmonton, Montreal, and St. John's, respectively.
These two figures show that there is a very distinct trend towards higher loads as the roof size increases. For an open exposure (Fig. 4), the product CbCwC, is 0.6 according to the 1990 NBC. The 0.6 value is not exceeded for the smaller roofs, but it is for Edmonton and Montreal when the roof lengths are between 100. and 200 m. For Saskatoon and St. John's, where the wind climate and snow conditions are more conducive to snow being swept off the roof, the value ofCbCwC, remains below 0.6 even for roofs of length con-siderably greater than 200 m.
The 1990 NBC value of CbCwC, for a suburban (shel-tered) exposure is 0.8. In Fig. 5, the results indicate that for this type of exposure the value 0.8 can be exceeded, in Montreal and Edmonton, for roof lengths greater than about 50-75 m. Again, in St. John's and Saskatoon, the simula-tion results indicate significantly less snow load when expressed as a fraction of ground load, due to the climate being more conducive to blowing snow off the roof. How-ever, given enough roof length, the 0.8 factor is eventually exceeded.Itshould be remembered that the results in Figs. 4
774 Can. J, Civ, Eng.VoL 22, 1995
0.8
cnrtJ
0.6
セ
_ 0.4tions for the RSI '0.88 case for the other roof sizes and exposures all fen into a fairly narrow range of between about 10% and 15%. For the RSI = 2.64 case, the percentage reductions were naturally less, being 6 % in the extreme case of the 300 m roof in suburban exposure. In Edmonton the percentage reduction was found to be smaller, about 5 % for the RSI 0.88 case and 2% for the RSI 2.64 case.
In view of the modest effect of beat transfer determined by these simulations, it was thought reasonable not to pro-pose a change in the present approach used in the code of effectively containing the heat transfer effect within the exist-ing factors CbC,Cw' without introducing a special heat transfer factor. Note that the American ASCE 7-93 Standard (ASCE 1993) does provide for a change in snow load due to heat transfer, specifying a thermal factor that ranges from 1.0, for a normal heated structure, up to 1.2 for an unheated structure (similar to our present case of zero heat transfer). Thus, the ASCE 7-93 Standard effectively implies that there is a maximum percentage reduction of 100(l - 1/1.2)
=
16.6% for heat transfer. This is similar in magnitude to the present results, which are for flat roofs. For sloped roofs, the reduction may be larger due to heat transfer through the roof promoting earlier sliding and better drainage.3.3. Rectangular roofs
Although the square roof is the basic case, it was important to evaluate the effect of the roof having one side longerthan the other. Considering the extreme case of one side very short and one very long, itdoes not take much deviation of wind direction from parallel to the long axis for snow to be blown over the longer edges. Therefore for this case the snow loads would be significantly less than for a square roof of side length equal to the length of the long axis of the rec-tangular roof, but more than for a square roof with side length equal to the shorter axis. As the sides of the rectangu-lar roof become closer in length then the loads should tend to revert back to those for the square roof.
To investigate this further, FAE simulations were run for rectangular roofs with two different length-to-width (aspect) ratios using the Montreal climatie data. The roofs selected had side lengths of 40 m X 300 m and 100m X 300 m (aspect ratios of 7.5: 1 and 3: 1). These two, together with the square roof of 300 m X 300 m (aspect ratio 1: 1) already studied, allowed the effect of aspect ratio on the snow loads to be assessed. With the objective of the present studies being to develop simple load provisions suitable for the NBC, a simple way of incorporating the effect of aspect ratio, without introducing roof alignment, was required. Therefore only the worst case alignment was considered, I.e., with the long axis parallel to the dominant wind direction for blowing snow - north-northeast for Montreal.
Figure 6 shows the results of the FAE simulations expressed as a function of the shorter dimension, W, of the roof. Results are shown for both the- rectangular roofs described above and square roofs with side equal to W for both open and suburban exposures. Itcan be seen that results for the rectangular roofs tend to lie above those for the square roofs for values of W below 300 m, as might be expected in view of the fact that the long dimension of the rectangular roofs was maintained constant at 300 m. Figure 7 shows the results of replotting the results against a charac-teristie length, /*, defined as
..
Montreal 0.2•
Edmonton A 51. John's 0 Saskatoon 0 0 100 200 300 400 500 0.8---f---",0 0.6 1990 NBC
-
provision""
セ
0.4..
Montreal 0.2•
Edmonton A 51. John's 0 Saskatoon 0 0 100 200 300 400 500 Roof size (m)and 5 are for zero heat transfer through the roof and there-fore tend to overestimate the loads.
Roof size (m)
-Fig. S. Effect of square roof size on 30·year return period snow
loads, sheltered terrain.
QNPイMMMMM[セセセセセセセ
Fig. 4. Effect of square roof size on 30·year return period snow loads, open terrain.
1.0r - - - r - - - , . . - - - , . . - - - , . . - - - ,
3.2.4. Effect of heat transfer through the roof
Heat transfer \hrough the roof from below will tend to pro-mote earlier melting of the snow and thus reduce snow loads. This effect was investigated by simulating two different roof thermal resistances, RSI 0.88 (R5) and RSI 2.64 (RI5), in addition to the case with infinite thermal resistance discussed in the previous section. It was also necessary to assume a representative internal temperature, which was taken to be 20°C, and to make an assumption concerning the internal convection resistance, which was taken to be zero. Results were computed for square roofs with 40, 100, and 300 m side dimensions for Montreal, and for a square roof with 300 m side dimensions in Edmonton. Both open and suburban exposures were simulated.
For Montreal the reductions in snow load caused by heat transfer were found to be modest. The roof most affected was the largest and most sheltered, i.e., the 300 m roof in suburban surroundings, for which the reduction in 30-year load was 14 % for RSI 0.88 (R5) thermal resistance as com-pared with infinite thermal resistance. The percentage
reduc-Fig. 6. Effect of roof length-to-width ratio, 1= 300m. IVvariable. 0 ' - - - 1 - - - ' - - - - ' - - - - ' - - - '
o
100 200 300 400 500 ., Width,w(m) 500 100 200 300 400Characteristic length,
-to.
(m)/
...
----...
•
"
-
.
0•
•
Equation 3 o セ---
Equation 4 0 0 FAE - Exposed•
•
FAE - Shelteredo
o
Fig. 8. Proposed codification of uniformly distributed snow loads on flat roofs.
1.0 • suburban, rectangle D suburban, square A open, rectangle 6. open, square / I I I I I I I I AI I I I / A 0.8 1.0
i--:::i==::::'::;:;:C;==;::;;:;i--'-i
セMMM I I I I ct 0.2en
0.6Fig. 7. Effect of plotting against characteristic length, 1*
w(2 - wll). 1.0ゥBGMMZtBM]Zjセ[j[Z[ZZZ]]]iBMLMNNLMMイャ セM 0.8 I I I I I I ct I I
•
0.6 I '!! I'"
I if) /0
0.4 /•
suburban, rectangle I 0 suburban, square 0.2 I..
open, rectangle A A open, square 0 0 100 200 300 400 500.e'
(m) [2]1*=+-7)
where 1is the length of the longer side of the rectangular roof. It can be seen that this form of plot causes the results for the rectangular roofs to collapse onto the same curves as for the square roofs. Thus the use of the characteristic length,
1*,provides a simple means of combining the load provisions for rectangular rQofs with those for square roofs. A flat rec-tangular roof with characteristic length /* experiences the same snow loads as a square roof of side length equal to /*. 3.4. Codification of size effects for flat roofs
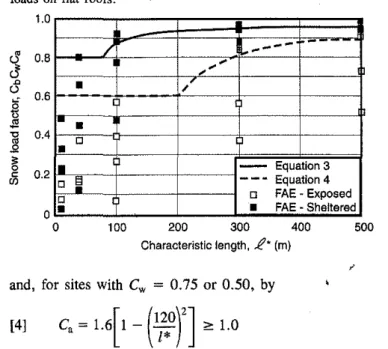
Figure 8 shows a composite plot of all the FAE simulations on flat square roofs without heat transfer in both open and suburban exposures. Because a rectangular roof of charac-teristic length
1*
is like a square roof with side1*,
the abscissa in Fig. 8 is/*. Also shown are suggested curves for codification based on Cb = 0.8 and on the followingexpres-sions for the accumulation factor C,.
For sheltered sites, i.e., those with Cw = 1.0, the value
of C, is given by
and, for sites with Cw = 0.75 or 0.50, by
[4] C,
=
1.6[1 -(1/:0)']
<: 1.0where /* is the effective length in metres of the roof defined by [2].
The curves in Fig. 8 illustrate the behaviour of the com-bined factor C,CbCw , with C, calculated according to [3]
and [4], for the two wind exposures Cw = 1.0 and
Cw
=0.75 and with Cb= 0.8. It can be seen that in the sheltered exposure, the snow load, excluding rain, remains at the existing 0.8S, value for /* up to 75 m, but increases to values closer to the ground load, S" for larger 1*. For exposed sites, the existing value of0.6S, is maintained until
1*
=
200 m, after which it increases towards the ground load. In selecting the empirical expressions in [3] and [4] the effects of heat transfer were borne in mind. As discussed in Sect. 3.2.4, heat transfer reduces snow loading typically by between 5%and 15%. Since the data points in Fig. 8 do not account for this reduction, the empirical curves have been drawn slightly below an envelope of the points as an approxi-mate allowance for heat transfer.It is worth noting that a rectangular roof has to be large in both dimensions wand 1for the value of/* to be large; when / ll> w, the value of /* - 2w. This is a reflection of
the fact that for a roof very long in one direction but narrow in the other, it does not take much deviation of the wind direction from the long axis for snow to blow off the roof. Therefore the effectiveャセョァエィ becomes more closely related to the shorter dimension in this case than the long dimension.
4. Snow drifts on lower roofs
4.1. Simple theoretical considerations
The snow loads that form at a step change in roof elevation (Fig. 9) are illustrated schematically in Fig. 10. The extra load on the lower level roof is due to(i)snow drifting off the upper level roof into the sheltered zone caused by the step; and(ii) snow drifting along the lower roof until it is stopped near the step. In the case where the upper level roof is larger in area than the lower roof, the highest loads may be expected to be due to(i)rather than(ii). The volume, V,,,p, of snow in the drift under peak loading conditions can
776
Fig. 9. Photo of triangular snow drift on a (small) two-level flat roof.
Can. J. Civ. Eng.Vol. 22. 1995
Fig. 10. Triangular snow load on a lower roof at a roof step.
UpperRoof Parapet
(Dimensionswx I)
h
Lower Roof
The shape of the surcharge drift in the step is usually triangu-lar as depicted in Fig. 10. If the step is eventually filled to
capacity, it is known from model tests and field observation that the height-to-length ratio, hd:ld, becomes about 1:6. For intermediate stages of the drift growth, the length ld is usually shorter than 6hdowing to reversed wind flows in the separated zone behind the step and to intermittent scouring away of the tail of the drift as the wind direction varies. Typi-cally, a drift builds up near the step first and then grows in the downwind direction. Full-scale observations show a range of values for Id •A fairly typical value is4hd , but this may not be fully representative of actual design conditions because of the lintited number of observations and the rela-tively few number of years over which they have been taken. Because of the way drifts grow. these factors would tend to bias the observations towards smaller values of Id than the full design value. An intermediate value of 5hd was
assumed. From geometric」ッョウゥ、・イ。エゥッョウセ
fore be reasonably related to the volume of snow on the upper level roof. which in turn is assumed proportional to the design ground snow load. S" suitably converted to a depth by dividing by the specific weight, oy, and to the upper roof's characteristic length, 1*. Thus the volume of snow per unit length of the step is expressed by
[5] u;'::'Ystep - c -S,I*
oy
where cis an efficiency factor which takes into account Ca) that not all the snow is necessarily blown off the upper roof and(b)that part of the snow that is blown off ends its trajec-tory elsewhere than in the step in question.
The presence of parapets around the upper roof can cause snow to be trapped on the upper roof and thus reduce the volume available to be collected in the step. For long upper roofs this effect is negligible, but as the roof length decreases, parapets can significantly reduce the step loading. Equation [5] is thus modified on the basis that both the upwind and downwind parapets store triangular drifts, with peak depth equal to the parapet height, hp, and with a
height-to-length ratio of I :6, this being the typical shape defined by the region of an aerodynamic shade caused by an obstruction.
[6]
[7]
u _ (S,I* _ 6h2)
Irwin et al.
combining [6] and [7], it is deduced that the peak depth of the drift surcharge, hd , is
[8J
h
d=3.-(S,I
* -
6h')
2.5 "( p
777
Fig. 11. FAEresults for peak drift load compared with simple theory, open exposure.
10 イMMMMMMMMMMMMNNNNNNLセNNNL
•
eq.[1OJ-...
II
[ i;,
whereh is the height of the step.
that the load distribution in the step followed the same 1:5 tri-angular form as described in Sect. 4.1.
ED Edmonton • Saskatoon t. Montreal 1:I St.John's
•
•
2 3 1L.-_"'---'-.J....l....u...l.J.l._--l._...--l-U-I.-lJ 10 100 11300£*y /
Ss 5 4 [\I]4.2.3, Comparison with 1990 NBC Commentary
The 1990 Commentary limits
S",,'k/S,
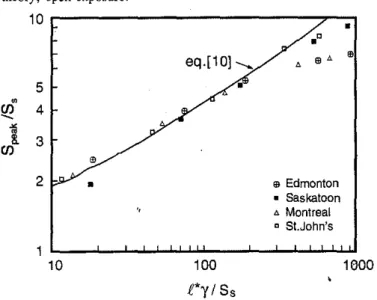
to not more than 3.0 based on field observations organized and collated by Taylor (1992) for about 50 cases.Itcan be seen in Fig. \I that for"(I*/S, greater than about 40, the FAE results exceed 3.0
which, at first, appears to disagree with Taylor's findings.
rt!"
t
(f)
4.2.2. Exposed roofs
Figure II shows a plot of the results of the FAE method for buildings in exposed locations in terms of the nondimen-sional rooflength parameter"(I*/S, discussed previously and
it can be seen that there is a good collapse of the data when plotted in this way. The FAE simulations were run for specific values of 1*. To convert these values to values of
"(I*/S" the 30-year remm ground snow load for the
applica-ble city was used in combination with the assumption that "( = 3 kN/m'. The parapet height was zero in the FAE studies. Also shown in Fig. \I is [10] with the parapet height, hp, equal to zero and the factor Yel2.5 set at 0.35, corresponding to an efficiency factor, c, of 0.31. It can be seen that the FAE results are in quite good agreement. There is some tendency for them to fall below that given by [10] for very high values of"(I*/S" more so at the less windy
locations.
Equation [10] may therefore be regarded as giving a reasonable estimate of the maximum step load for windy exposed sites, but may overestimate step loads at the edge of very large upper roofs at less windy sites. It shouldbe noted that in practice the full step load given by [10] and by the FAE simulations may not be reached owing to the drift reach-ing the top of the step, at which point the depth of snow at the step cannot increase further. The peak load is limited by
SpOOk
<
h'YS, S, 4,2, FAE studies of lower level roofs
4.2.1. Description of studies
As part of the same studies described in Sect. 3, the snow loads on lower roofs at the edge of upper roofs of various
sizes in the same four cities, Edmonton, Saskatoon,
Mon-treal, and St. John's, were examined. The results provided information on the mass of snow accumulating in the step at the junction of the lower and upper roofs. The process whereby snow blown off the upper level roof collects in the roof step is complex. Not all the snow is captured in the step and the fraction of snow mass that is capmred, the capmre efficiency, is a function of wind direction, wind speed and duration, step height, lateral extent of the step, and turbu-lence level in the wind. Detailed smdies using computational fluid dynamics techniques were undertaken to develop a computer model of the step capmre efficiency in terms of these various parameters (AppendixA.6). The steps consid-ered are those usually generating the highest loads, i.e., those in the range of heights up to about 10 m. While the simulation of the step did include modelling of the initial cap-ture efficiency of the step, it did not allow for snow subse-quently drifting out of the step or for the effect of heat transfer through the lower roof. Therefore there was a degree of conservatism in the raw FAE results. To correct for this a global 0.8 factor was applied to the predicted peak drift loads, analogous to the basic Cb = 0.8 factor used for roofs in the NBC to correct for these effects.Itwas also assumed, in determining the peak load in the step from the FAE loads, To this must be added the snow load that was already on the lower roof, which is taken tobe the normal roof load for an unexposed roof, i.e., 0.8S,. The rain load, S" will be added later. Then dividing by S, we find the expression for the peak load at the step, as a multiple of the ground load, is
[IOJ
Spook
=
3.-["(1* -6(:6)']
+
0.8=
C C C C5s 2.5 Ss 55 b w s a
Although the analysis is clearly a simplification of the com-plex snow drifting process that leads to the triangular drifts in roof steps, [10] does show the nondimensional parameter rl*/S, to be important in defining the peak step load. Fur-thermore, for large upper roofs, where the parapet term is negligible, and the 0.8 term is a small additional contribu-tion, it shows that the peak load in the step varies approxi-mately as 'hl*/S,. As will be seen in the next section, the
form of [IOJ agrees well with FAE simulation results and provides the basis for a simple formula suitable for use in
code provisions.
which may be converted to a drift surcharge load, Sd' by multiplying by the specific weight.
[91
778 Can. J. Civ. Eng. Voi. 22, 1995
Fig. 12. FAE results for peak drift load compared with simple
theory, sheltered exposure.
10
r---....,...--.
4.3. Codification of step loads on lower level roofs Equation [10], withc = 0.31, appears to provide a reason-able desc!lptlOn of the peak load in roof steps as a function of nondlmenslOnal roof size, 'YI*IS" particularly for exposed sItes.
Accorditlgly, for Code purposes, it is suggested that the peak load In the step be given by
However, the median value of1* for the roofs involved in Taylor's studies was only 26 m, corresponding to 'YI*IS,
of about 40 for a typical 2.0 kPa ground load and "I =
3 kN/m3 •Over 80% of the roofs had1*less than 38 m and
except for one with 1*
=
120, they all had 1* lessエィ。セ
76 m. Also, the number of years of observation which varied from case to case, was less than theSPMケ・。セ
returnー・ョセ、 used by. the Code - typically 11-15 years. A further conSideratIOn IS that the 3.0 limit was based on the actual observations, rather than extrapolated 30-year return period values. In a few cases the load did in fact exceed the 3.0 limit by significant amounts. In some cases the drifts reached the full height of the step. When these factors are considered, the FAE results are quite consistent with Taylor's data at lower values of'YI*IS,. "11
* _
VHセIR
+
0.8 S, S, Lower Limit S",'k= 0.35S,
An analytical approach to determining snow loads on one-[13] セ⦅ィGy
S, S,
whichever is lower, with the latter being for the case where the maximum drift depth is limited by the height of the roof step.
Two additional limits are also suggested. For sheltered roofs,itdoes appear from Fig. 12 that the full step load given by [12] will probably not be attained for larger roofs. There-fore,. an セーー・イ limit for S",'k/S, of 5.0 is suggested for buildIngs In sheltered locations.
The second limit suggested is a lower limit ofS",'k/S,of 2.0 for all roofs provided that the step is large enough to allow for such a drift. This is applied so as to guard against a drift formed by snow blowing along the lower level roof itself, which has not been accounted for in the current studies. The value of 2.0 is consistent with the 1990 NBC Commentary as applied to obstructions such as penthouses on roofs. However, it should be borne in mind that for large area lower roofs, which have not been studied here, drifting over the lower roof could conceivably result in values in excess of 2.0. Further study of large area lower roofs, and of the related problem of large area roofs with obstacles, is neededto gain a better understanding of this.
Figure 13 shows these proposals in graphical form. For
カセイケ ャセイァ・ 。イ・セ イセッヲウ in exposed locations, the proposed revi-sIOns Imply slgmficantly higher loading in roof steps than those in the 1990 NBC Commentary on Snow Loads. How-ever, for short roofs with sizable parapets, the peak loads tend to be less than those in the Commentary. Table 3 gives examples for several different roofs, comparing the present proposal for the peak loading in a step with that in the 1990 NBC Commentary.
Fig. 13. Proposed peak load (exclusive of rain load) in a roof ste .
10 P 9 B 7 5. Conclusions or Cf)' _ 6
Js
4 3RQMMM]セセTャNᆬ
o
2 1 3+Yh p/S, 1,L.::'0-....J._.L-.J...J...J...LJ.J 1""00:":"..:..J_.L.LLL.L.LLJ1000 ry/S, [12] 1000 Ell Edmonton • Saskatoon t. Montreal " Q St.John's 100£*y
ISs eq.[10] ---.. 0 0•
•
•
•
•
•
•
•
•
•
•
•
5 4 1 10•
セ 3t
en
24.2A. Sheltered roofs
Figure 12 shows FAE simulation results for buildings in more sheltered surroundings, again with zero parapet height. The FAE results for this situation are not as definitive, since only Saskatoon was run with a full simulation of the step capture efficiency, the remaining locations being adjusted afterwardsGZャセゥョァ estimated global capture efficiencies. None-theless, the trends are clear. For low values of 'YI*IS"
eq. [10] WIth vel2.5 = 0.35 again agrees with the FAE results, but for very large roofs, Le., for high values of
'YI*IS" the FAE results tend to fall below that given by [10], much more so than for the exposed sites (Fig. II).This may be Interpreted as due to the wind not having the strength and
、オイ。セッョ to move the full amount of snow off the upper roof and Into the step at the more sheltered sites.
,win et al.
fable 3. Examples of present peak loads in roof steps cL111lpared with 1990 NBC Commentary.
-Roofdimensions Peak step load (kPa)
Width w Length 1 I' Present 1990 NBC
1m) (m) (m) method Commentary 15 20 18.8 5.1 6.4 30 30 30 6.2 6.4 30 100 51 7.8 6.4 100 100 100 10.3 6.4 200 500 320 15.4' 6.4
Notes:Step height, h := 5 m; parapet height, h p:= 1 m;
5 := 2.0 kPa; Sr:= 0.4 kPa; andl'
=
3.0 kN/m3•, "'Limited by a capacity of 5 m step height.
and two-level flat roofs using the finite area element method and computational fluid dynamics has led to the following:
I. A characteristic length to describe different sizes of rectangular upper roofs with a single parameter has been identified.
2. There is a trend to increasing uniform snow loads on flat roofs as their sizes increase. These loads may exceed those recommended in the 1990 NBC by significant margins. 3. There is a trend to increasing drift loads on two-level flat roofs as the sizes of the upper roofs increase. These drifts also exceed those recommended in the 1990 NBC, except for short upper roofs whose characteristic lengths are less than about40S,I-y.
4. The influence of heat loss in reducing uniform loads was less than about 15% in the cases studied. It was consid-ered reasonable, therefore, not to propose an additional heat transfer factor, but instead to suggest that heat transfer be dealt with, as it is now (in the 1990 NBC), in the Cb factor. 5. Analytical studies to establish trends in drift size around obstructions on large upper and lower roofs should
be carried out.
Acknowledgements
The authors would like to acknowledge the financial assis-tance received from the Institute for Research in Construc-tioo, National Research Council Canada for research supporting development of the National Building Code of
Canada. '
References
Anderson, RS., and Haff, P.K. 1988. Simulation of eolian
salta-tion, Science, 241: 820-823.
ASCE. 1993. Minimum design loads for buildings and other struc-tures. American Society of Civil Engineers, 345 East 47th
Street, New York. Standard ASCE 7-93.
ASHRAE. 1985. Fenestration. In Handbook of fundamentals.
American Society of Heating, Refrigerating, and Air-conditionM
ing Engineers, Atlanta, Ga. Chap. 27.
Bagnold, R.A. 1941. The physics of blown sand and desert dunes.
Methuen, London, United Kingdom.
Climatic Supplement. 1990. Climatic information for building design in Canada.InSupplement to the National Building Code. Associate Committee on the National Building Code, National
779
Research Council Canada, Ottawa, Ont., NRCC 30629, Chap. 1, pp. 3-30.
Dyunin, A.K. 1963 .. Solid flux of snowMbearing air flow, National Research Council Canada, Ottawa, Ont., Technical Translation
TT-1102 (from Russian).
Gamble, S.L., Kochanski, W.K., and Irwin,p.A. 1992. Finite area
element snow loading prediction - applications and advance-ments. Journal of Wind Engineering and Industrial
Aero-dynamics, 4a: 1537 -1548.
Irwin, P.A., and Gamble, S.L.1989. Prediction of snow loading on the Toronto SkyDome. Proceedings of the First International Conference on Snow Engineering, Santa Barbara, Calif., July,
1988. U.S. Army Cold Regions Research and Engineering Laboratory, Hanover, N.H., pp. 118-127.
Irwin,P.A., and Williams, C.J. 1983. Application of snow simulaM tion model tests to planning and design. _Proceedings of the Eastern Snow Conference, 40th Annual Meeting, Vol. 48,
pp. 118-130.
Irwin, P.A., Gamble, S.L., Retzlaff, R.N., and Taylor, D.A. 1992.
Effects of roof size and heat transfer on snow loads on flat roofs. Proceedings of the Second International Conference on Snow
Engineering, Santa Barbara, Calif., July. U.S. Anny Cold
Regions Research and Engineering Laboratory, Hanover,N.H.,
pp. 59-68.
Irwin, P.A., Gamble, S.L., Hunter, M.A., and Kochanski, W.K. 1993. Parametric studies of snow loads on large roofs. Rowan Williams Davies and Irwin Inc., Guelph, Ont, , Report
92-118T-15.
Isyumov, N. 1971. An approach to the prediction of snow loads. Ph.D. thesis, Faculty of Graduate Studies, University of Western Ontario, London, Ont.
Kind, R.I. 1981. Snow drifting. In Handbook of snow -
princi-ples, processes, management and use.Editedbyn.M. Gray and
D.H. Male. Pergamon Press, Elmsford, N.Y. Chap. 8.
Kind, RJ, 1986. Snowdrifting: a review of modelling methods.
Cold Regions Science and Technology, 12: 217-228.
Kobayashi, D. 1973. Studies of snow transport in low level drifting snow. Institute of Low Temperature Science, Sapporo, Japan,
Series A, pp. 1-58.
Langham, EJ. 1981. Physics and properties of snowcover. In
Handbook of snow - principles, processes, management and use. EditedbyD.M. Gray and D.H. Male. Pergamon Press,
Elmsford, N. Y. Chap. 7.
Male, D.H., and Gray, n.M. 1981. Snowcover ablation and runoff.In Handbook of snow - principles, processes, manageM ment and use. Edited by D.M. Gray and D.H. Male. Pergamon
Press, Elmsford, N.Y. Chap. 9.
Mellor, M. 1965. Blowing snow. In Cold regions science and engineering. Part III, Section A3C. U.S. Army Cold Regions Research and Engineering Laboratory, Hanover, N. H. NBC. 1990. National building code of Canada 1990. Associate
Committee on the National Building Code, National Research
Council Canada, Ottawa, Ont., NRCC 30619.
NBC Commentary. 1990. Snow loads. Supplementtothe National
Building Code of Canada 1990. Associate Committee on the National Building Code, National Research Council Canada,
Ottawa, Ont., NRCC 30629, pp. 187-199.
O'Neill, A.D.J., and Gray, D.M. 1972. Spatial and temporal
varia-tions of the albedo of Prairie snowpack. The Role of Snow and Ice in Hydrology: Proceedings Banff Symposium,
Unesco-WMO-IAHS, Geneva-Budapest-Paris, Vol. 1, pp. 176-186.
Taylor, D.A. 1980. Roof snow loads in Canada. Canadian Journal of Civil Engineering, 7: 1-18.
Taylor, D.A. 1992. Snow on two-level flat roofs - measured vs. 1990 NBC loads. Canadian Journal of Civil Engineering, 19:
59-67 .
I
I
,
!
780
Appendix A. Background and details of finite area element method
A.I. Drifting over a flat surface
To explain the finite area element method for prediction of snow loads it is helpful to first describe the basic process of snow drifting. The initial arrival of snow on a roof is the result of snow that falls during snowstorms. During or after a snowfall wind can pick up the snow particles again and drift them to other locations. The drifting process of snow or sand. which has many similarities. has been studied by a number of authors (e. g.. Bagnold 1941 ; Mellor 1965; Dyunin 1963; Kobayashi 1973). For fresh snow to start drift-ing, the wind speed, as measured atI m above the snow sur-face, needs to be in excess of about 4 m/s. Once this speed
is exceeded, the flux rate of snow over the surface increases
rapidly with wind speed. Old snow, however, tends to form a surface crust and requires a higher wind speed to trigger snow drifting. Also, if the surface of the snow has been rained on or been subject to freezing rain, this will greatly inhibit drifting.
The bulk of the drifting takes place close to the snow sur-face by a process called saltation, in which the snow particles bounce along the surface in short hops in the range of 5-50 cm long and a few centimetres high. This thin layer of particles in motion close to the surface is called the saltation layer. As each particle lands it throws up other particles which are accelerated by the wind before they land again and throw up yet more particles. This process セッオャ、 eventually result, by a population explosion of saitatlllg partICles, III
almost the entire available snowpack being set in motion, but the process is limited by the drag of the particles on the air flow in the saltation layer. The air flow slows down, and as the drag increases (when more particles become airborne), the wind is less able to lift particles off the surface or acceler-ate them horizontally. As a result, for given snow conditions and a fixed reference speed at the I m reference height, a limiting flux rate is soon reached. The wind speed in the sal-tating layer itself is always slowed down by the particle drag to about the threshold velocity (i.e., 4mlsin fresh snow con-ditions) but as the reference speed increases, both the veloc-ity gradient near the surface and the number of particles in the air increase. The functional relationship between flux rate and wind speed can be written as
[AI] q ..}(U, U'h)
where q is the mass flux of snow in kg/(s' m) per unit lane width' U is the mean wind velocity at the I m height; and
U'h i; the threshold value of U for the onset of drifting. Kobayashi (1973) reviewed a number of forms of this rela-tionship proposed by various authors. One which is fai:ly representative for fresh snow is that of Dyunin (1963), which is
[A2] q = CU2(U - U'h)
where the wind speeds are in metres per second, U'his taken as 4mls and the constant c was determined by Dyunin to be 3.34 X iO-5kg/(s2. m4 ). Kobayashi proposed the following somewhat simpler relationship:
[A3] q = cU'
Can. J. Civ. Eng. Vol. 22, where the constant c was specified to be 3 X 10⁻⁵kg!
(S2.m4 ). ,'-;'.
Kind (1981) described the distribution of horizontal mass flux of snow with height. When the wind speed I m above the snow surface is 10 mis, about 90% of the snow fllll( occurs within 3 cm of the surface and only about 2 % occurs above 10 cm. As the wind speed increases, the smaller snow particles (Le., those with small mass) are lifted higher and higher owing to the turbulence in the wind, a process called turbulent diffusion. When the vertical velocities of the air in the turbulent eddies approach those of the terminal velocity of fall of the snow particles, turbulent diffusion starts to become a significant component of the mass flux. However, for this to oCCllr the wind speeds at the I m height mustbe
about 15mlsor higher. Since wind speeds of this magnitude are relatively rare, the great bulk of snow mass transfer over flat surfaces occurs by saltation and not diffusion,
Flux relationships such as [A2] and [A3] afe equilibrium relationships, Le., they apply after the drifting process has had time to put into motion the full number of particles that the air flow can carry. At the upwind edge of a bed of snow particles, for example, there are no landing snow particles (in the absence of snowfall) to throw up a fresh supply of snow particles from the bed into the airstream. Therefore ini-tially the only particles in the airstream are a few that happen to be lifted up by aerodynamic forces. These then throw up more particles when they land, which ill turn cause more to be ejected as they land, and so on untd the number of alr-borne particles reaches the equilibrium condition. Bagnold (1941) found in wind tunnel tests with sand that about 5m
of sand bed was needed to establish equilibrium. Kind (1981) also found that with silica sand a similar distance was suffi-cient. Anderson and Haff (1988) undertook numerical simu-lations of the saltation process and found that aboutI s was required to establish equilibrium, which may be converted to a distance of approximately 4 m uSlllg the representatlv.e mean wind velocity in the saltation layer of 4 m/s. Intut-tively, one would expect the equilibrium distance to be ab.out an order of magnitude, i.e., 10 times, greater than the typtcal saltation path length. The saltation paths being in the range of 5 - 50 cm, this puts the equilibrium distance in the range of 0.5-5 m. Kobayashi (1973) undertook field measure-ments to try to establish the equilibrium distance and con-cluded that it was of the order of30-60 m, Le., much longer than the ranges just discussed. However, his measurements were made downwind of trenches cut in the snowpack at right angles to the wind flow, the purpose of the trenches being to cut off the initial supply of saltating particles so that the buildup of particle flux from zero could be observed. The aerodynamic drag of these trenches would have caused a retardation of the wind flow downwind of the trench. What was observed was therefore a result not only of saltation reestablishing itself after the interruption of the trench, but also of the boundary layer flow near the surface readjusting after the sudden drag of the trench, and this makes the interpretation of the results difficult. Therefore, on balance of the available evidence, it appears most probable that the equilibrium distance is of the order of 5 m.
A.2. Drifting on roofs . . The fact that saltation is the dominant process of dnftmg has
Since the rate of buildup of snow mass, M, in the control volume is simply the difference between what is entering at Station I and what is leaving at Station 2, then
dm= _1'dU
dt dx [A9]
Therefore [A6] may be o,yritten as
A.3. Simulation of drifting in the FAE method
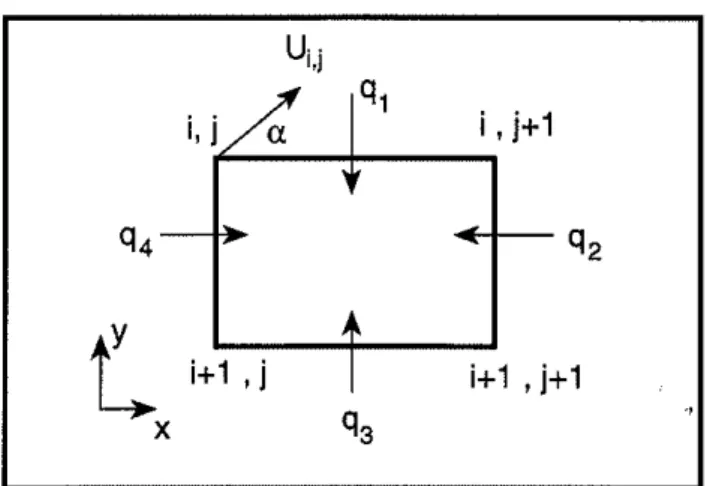
The basic assumptions of the FAE method follow from the discussion of snow drifting in Sects. A.I and A.2. The fact that the particle path lengths are small compared with the building dimensions and that the snow drifting can be envisaged as a thin carpet of particles moving over the sur-face with a mass flux rate dictated by the local mean wind velocity at a reference height of I m above the surface makes it feasible to compute the snow drifting process based on a knowledge of the mean wind velocity field at this reference height. This is the starting point for the FAE method. The roof is divided into a large number of control volumes of "finite areas" by a grid system and it is assumed that, for a given approaching wind direction and speed, the mean wind velocity field can be determined at each grid node. Then [A2] or [A3] can be used to compute the mass fluxes over the boundaries of each finite area element and thence to compute the change in snow mass in the element over a given time interval. Figure Al illustrates a typical finite area ele-ment. The mass flux of snow that would exist provided the snow were in a driftable state and that there was an adequate supply of snow in upwind elements is called the potential mass flux and at the grid point(i,j) is denoted byqiJ' Using [A2] the potential mass flux at the grid point(i,j) is
[AlO] qiJ= cuiセHuゥj - Uth )
These components of mass flux at grid point (i, j) are
q .
=
q. .cos01·'[All] x" 'J 'J
qYiJ
=
qjJsinCXjJwherealJis the angle of the local velocity vector to the grid at node (i,j); see Fig. AI.
Normally, wind tunnel tests are needed to determine the values ofUi .and OIIJ' but for generic studies of snow load
trends on sir'iJple geometries it is possible to use calculated values. Itis recognized that the formation of drifts can alter From this expression, with the knowledge that
f'
is always positive at wind speeds above the threshold for drifting, it is clear that if the wind is accelerating between stations I and 2, i.e., dUldxis positive, there will be a decrease in mass of snow lying on the surface between stations I and 2 becausedm/dtwill then be negative. Similarly, if the flow is deceler-ating, i.e.,dUldxis negative, there will be a buildup of snow mass in the control volume because dm/dt is then positive. Equation [A9] indicates that the gradient in wind velocity on the roof, rather than tile wind velocity itself, is important in
creating snow accumulations or in causing scouring.
In reality the wind flow is not two-dimensional, bot the rule still holds that snow tends to accumulate in zones of decelerating wind and to be scoured in zones of accelerating wind. The finite area element method uses a similar control volume approach to that described here to compute the snow mass transfer and deposition on roofs, but extended to three dimensions as described below.
df(U, Uth ) = 1'dU dx dx
l'
= df(U, Uth ) dU where dM=
ql _ q2=
fW" Uth ) - f(U2 , Urn) dt ,which may in turn be written as [AS]
[A6] dM = _ df(U, Urn)ax
dt dx
wherex is the coordinate parallel to the wind. Equation [A6] may be expressed in terms of snow mass, m, per unit surface area by noting that m= Mlax. Also, the derivativeoffmay
be written as
[A8] [A?] [M]
,ome important consequences. The first is that snow does not
:ngeneral drift from the ground up onlo a roof of a building
セ・」。オウ・
the particles in the saltation layer on the ground do lOt travel high enough to land on the roof. As described, the :vpical height reached by theセ。ャエ。エゥョセ
ー。イエセ」ャ・ウ
isセョャケ
a fe,:" ,:entimetres, whereas the typICal bmldmg s roof IS a mml-mum of several metres. The only ways therefore for snow to drift up onto a roof from the ground are by diffusion, whichisa very rare circumstance requiring extremely strong winds
(and even then only a fraction of the particles travel high enough to reach the root), or by traveling up a ramp. In very strong winds a berm on the upwind side of the building can act as a ramp and redirect the wind flow and snow particles up onto the roof, but this is rare (Taylor 1992).
Thus for the great majority of cases the only snow that lands on a roof comes either from direct snowfall or from being blown off a higher level roof. On the other hand, snow is readily blown off the roof's edges. There is a tendency, therefore, for a roof to experience less overall snow load than would be found on the equivalent area of ground. For this reason, building codes specify the snow load for a flat roof as being the ground load multiplied by an exposure fac-tor, Cw , in the range 0.5-1.0, depending on the roof's
exposure to wind.
The wind velocity patterns on a roof depend on the roof geometry and, for roofs that are not flat, can be very com-plex. Some understanding of why snow will accumulate in some areas and be scoured from others can be obtained by considering a simple case of two-dimensional flow. Examine the rate of change of snow mass,M,on the roof in a I m wide lane between an initial Station I and a second one, Station 2, c.x m downwind. The value of c.x is assumed to be larger than the distance required for the equilibrium snow flux to become established. From Sect. A.I, the snow flux rates at stations I and 2 may be expressed as
q, = f(U" Uth )
[AI5] 782
Fig. At. Finite area element.
u·
I,ji ' i A
q1
i ,j+1
セq4
q2
t
i+1 , i
..
I
i+1 ,i+1
q3
.,X
the values ofU;Jand"';J' since the local wind velocities are influenced by roof shape which is effectively changed by the growth of drifts. However, for large roofs the drift depths are typically relatively small compared with the roof dimen-sions so that the changes in the shape presented to the wind will not be sufficient to appreciably alter the wind velocity field. Therefore on large roofs, except near local surface obstacles such as penthouses or step changes in elevation, there is some justification for assuming that the patterns of
U;Jand "';J measured on. a model of the 「。イセ roof will still provide a reasonable baSIS for computmg dnft patterns. At features such as a step change in roof elevation, the roof step can eventually fill in with snow to the point where no more snow can be held. Effectively, the wind velocity at the snow surface in this instance changes from being virtually zero prior to the step filling in to being very similar to the velocity at the top of the step once the step is filled in. Itis feasible in this instance to incorporate a "switch" in the computa-tional procedure to change the relevant velocity on the lower level roof near the step to that at the top of the step once suf-ficient mass has accumulated to cause the step to be filled to capacity. A similar approximate approach, i.e., giving an area element a maximum storage capacity, can be taken with other types of discontinuities in roof geometry where local drifts can form. All that is required is some knowledge of the maximum volume of snow that can be held in the sheltered region near 'the discontinuity, and good guidance on this can often be obtained from scale model tests with particles.
The average fluxes q" q2, q3, and q, normal to the four element boundaries can be computed as the average of the fluxes at the two ends of each boundary. Thus
1
ql =
2:(
-qY'J - qY'J")[AI2]
1
q, = 2:(qx'J
+
qx,.,)where the convention is used that fluxes into the area element are positive and fluxes outwards are negative.
Can. J. Clv. Eng. Vol. 22, 1995
The change in ;"ass,dm, in the element after a time intet_ val, dt, may now be computed.
[AI3] dm= (qlll
+
q212+
q,l,+
q,I,) dt+
M fal1+
MnUn- MUle1t where II through I, are the lengths of the four sides of the area element. In this expression the three other sources of mass change are introduced. These are the added mass, M fallo due to snowfall landing in the area elemenl during !he time interval; the added mass, Mm'n, due to ramfall whIch
soaked into the snowpack; and the loss of mass, Mm•1" due
to snow meltipg and liquid water running out of the snowpack.
A.4. Some limits on drifting
Not all snow is driftable. As it ages there is a tendency for the threshold velocity for the onset of driftirlg to increase until only very strong winds can cause drifting (see Kind (1981), for example). If snow has オョ、・イァッセ・ significant melting, then it will tend to become fixed WIthout further drifting, even if the temperature subsequently drops and refreezing takes place. If the snow has been ramed ッセ セイ experienced freezing rain, these events also tend to fix Itm place. This is modeled in the FAE simulations by incorporat-ing a switch that turns driftincorporat-ing off if any of these events take place. Only new snow landing on top of the fixed snow IS SUbsequently allowed to drift.
A.S.Melting and retention of liquid waterinthe snowpack The process of melting is complex. It is one of the more difficult parts of the FAE simulation technique and an area subject to some uncertainty. For this reason it has been felt important to calibrate the FAE method against the ground snow loads given in the Climatic Supplement to the Nallona! Building Code (1990).
Methods of modelling melting have been discussed by Male and Gray (1981) in relation to ground melting. Very similar considerations apply to the melting of snow on roofs. The initial approach used to calculate the melting rate in the early development of the FAE method was very simple and used an empirical expression of the form
[AI4] Mm•lt= CmT
whereMm•ltis the mass of snow and ice melted per unit area
in unit time, Tis the air temperature in °C, and
em
is anempirical constant. This form of expression appears to have been originally used in some "operational models" of the melting rate of snowpacks for estimating spring runoff (Male and Gray 1981).
A more detailed approach used in recent FAE studies, including the present, is to undertake a heat balance calcula-tion, taking into account the various sources of heat input and heat loss that affect the snowpack. In the situation where there is no solar radiation, and assuming equilibrium condi-tions (further discussion to follow), the heat flux, Q, from
the inside of the building to the outside may be expressedin
terms of the difference in temperature between the inside and the outside air.
Q= T,-To