HAL Id: hal-02348507
https://hal.archives-ouvertes.fr/hal-02348507
Submitted on 19 Nov 2019
HAL is a multi-disciplinary open access
archive for the deposit and dissemination of
sci-entific research documents, whether they are
pub-lished or not. The documents may come from
teaching and research institutions in France or
abroad, or from public or private research centers.
L’archive ouverte pluridisciplinaire HAL, est
destinée au dépôt et à la diffusion de documents
scientifiques de niveau recherche, publiés ou non,
émanant des établissements d’enseignement et de
recherche français ou étrangers, des laboratoires
publics ou privés.
Distributed under a Creative Commons Attribution - NonCommercial - NoDerivatives| 4.0
C-type lectin receptor DCIR modulates immunity to
tuberculosis by sustaining type I interferon signaling in
dendritic cells
Anthony Troegeler, Ingrid Mercier, Céline Cougoule, Danilo Pietretti, André
Colom, Carine Duval, Thien-Phong Vu Manh, Florence Capilla, Renaud
Poincloux, Karine Pingris, et al.
To cite this version:
Anthony Troegeler, Ingrid Mercier, Céline Cougoule, Danilo Pietretti, André Colom, et al.. C-type
lectin receptor DCIR modulates immunity to tuberculosis by sustaining type I interferon signaling
in dendritic cells. Proceedings of the National Academy of Sciences of the United States of America
, National Academy of Sciences, 2017, 114 (4), pp.E540-E549. �10.1073/pnas.1613254114�.
�hal-02348507�
C-type lectin receptor DCIR modulates immunity to
tuberculosis by sustaining type I interferon
signaling in dendritic cells
Anthony Troegeler
a,b, Ingrid Mercier
a,b, Céline Cougoule
a,b, Danilo Pietretti
a,b, André Colom
a,b, Carine Duval
a,b,
Thien-Phong Vu Manh
c, Florence Capilla
d, Renaud Poincloux
a,b, Karine Pingris
a,b, Jérôme Nigou
a,b, Jörg Rademann
e,
Marc Dalod
c, Frank A. W. Verreck
f, Talal Al Saati
d, Geanncarlo Lugo-Villarino
a,b, Bernd Lepenies
g,h, Denis Hudrisier
a,b,1,
and Olivier Neyrolles
a,b,1,2aInstitut de Pharmacologie et de Biologie Structurale (IPBS), CNRS, 31000 Toulouse, France;bIPBS, Université de Toulouse, Université Paul Sabatier (UPS),
31000 Toulouse, France;cCentre d’Immunologie de Marseille–Luminy, INSERM U1104, CNRS UMR7280, Aix Marseille Université, F-13288 Marseille Cedex 09,
France;dService d’Histopathologie, INSERM/UPS-Unité de service 006/Centre Régional d’Exploration fonctionnelle et Ressources Expérimentales, Centre
Hospitalier Universitaire Purpan, 31300 Toulouse, France;ePharmaceutical and Medicinal Chemistry, Freie Universität Berlin, 14195 Berlin, Germany; fDepartment of Parasitology, Biomedical Primate Research Centre, 2288 GJ, Rijswijk, The Netherlands;gImmunology Unit, University of Veterinary Medicine
Hannover, 30559 Hannover, Germany; andhCenter for Emerging Infections and Zoonoses, University of Veterinary Medicine Hannover, 30559 Hannover,
Germany
Edited by William R. Jacobs Jr., Howard Hughes Medical Institute, Albert Einstein College of Medicine, Bronx, NY, and approved December 16, 2016 (received for review August 10, 2016)
Immune response against pathogens is a tightly regulated process that must ensure microbial control while preserving integrity of the infected organs. Tuberculosis (TB) is a paramount example of a chronic infection in which antimicrobial immunity is protective in the vast majority of infected individuals but can become de-trimental if not finely tuned. Here, we report that C-type lectin dendritic cell (DC) immunoreceptor (DCIR), a key component in DC homeostasis, is required to modulate lung inflammation and bacterial burden in TB. DCIR is abundantly expressed in pulmonary lesions in Mycobacterium tuberculosis-infected nonhuman pri-mates during both latent and active disease. In mice, we found that DCIR deficiency impairs STAT1-mediated type I IFN signaling in DCs, leading to increased production of IL-12 and increased differentiation of T lymphocytes toward Th1 during infection. As a consequence, DCIR-deficient mice controlM. tuberculosis better than WT animals but also develop more inflammation character-ized by an increased production of TNF and inducible NOS (iNOS) in the lungs. Altogether, our results reveal a pathway by which a C-type lectin modulates the equilibrium between infection-driven inflammation and pathogen’s control through sustaining type I IFN signaling in DCs.
tuberculosis
|
inflammation|
C-type lectinI
L-12, IFNγ-producing CD4
+Th1 cells, and TNF are
well-recognized key players in immunity against Mycobacterium
tu-berculosis, and yet their uncontrolled production can result in
progressive lung tissue destruction and tuberculosis (TB) disease
(1, 2). Several host factors, including IL-10 and Treg cells, have
been implicated in immune modulation in TB (2). Nevertheless,
the balance between pro- and antiinflammatory reactions that
dictates the magnitude of TB disease, from early bacterial
clearance or latent infection to severe lung injury, remains
in-completely understood (3).
In addition to T cells, dendritic cells (DCs) play a key part in
antimycobacterial immunity, mostly through antigen processing
and presentation, which together with the production of IL-12,
drive the expansion of M. tuberculosis-specific Th1 cells (2). DCs
express a wide range of so-called pattern-recognition receptors,
including Toll-like receptors (TLRs), NOD-like receptors, and
C-type lectin receptors (CLRs) (4), which are involved in
rec-ognition of exogenous or endogenous ligands, in antigen
pre-sentation and T-cell stimulation, as well as in gene expression
rewiring and production of inflammatory mediators, such as
cy-tokines and chemokines.
Among these CLRs, DC immunoreceptor (DCIR) (5) belongs
to the Dectin 2 family (6). This lectin is mainly expressed by DCs
and has a broad specificity for sugars, including mannose and
fucose (7), of endogenous and exogenous origins (8, 9). DCIR
is a rare case of a CLR that contains an immunoreceptor
ty-rosine-based inhibitory motif (ITIM) in its cytoplasmic tail and,
as such, is generally believed to mediate inhibitory signals in
DCs. In line with this concept, antibody-mediated DCIR
trig-gering in human DCs inhibits TLR-mediated production of
IL-1β, IL-6, TNF, IL-12, and IFNα (10–12), and mice deficient in
the DCIR homolog Dcir1 (also known as Clec4a2) show an
overexuberant expansion of DCs and develop more
aging-associated or experimentally induced antibody- and T
cell-mediated autoimmune disorders than their WT counterpart
(13–15). Intriguingly, the mechanisms responsible for these
phe-notypes still remain poorly understood.
Significance
Tuberculosis (TB) is an immunopathology, mostly of the lung, due to an overexuberant immune response to the bacterial pathogenMycobacterium tuberculosis. Here, we demonstrate in vitro and in vivo that dendritic cell (DC) immunoreceptor (DCIR), a C-type lectin receptor expressed by DCs, modulates immunity to TB by sustaining type I IFN signaling in DCs. These findings were generalized beyond TB, in a model of in vivo antigen-presentation assay unrelated toM. tuberculosis, suggesting that they may extend to other pathologies, such as viral infections or autoimmune disorders. Thus, modulating DCIR activity may help to develop type I IFN-targeting therapies for a large repertoire of inflammatory disorders, including TB.
Author contributions: A.T., D.H., and O.N. designed research; A.T., I.M., C.C., D.P., A.C., C.D., F.C., K.P., J.N., T.A.S., and D.H. performed research; J.R., F.A.W.V., and B.L. contrib-uted new reagents/analytic tools; A.T., I.M., C.C., T.-P.V.M., R.P., M.D., G.L.-V., D.H., and O.N. analyzed data; and A.T., G.L.-V., D.H., and O.N. wrote the paper.
The authors declare no conflict of interest. This article is a PNAS Direct Submission.
Freely available online through the PNAS open access option.
Data deposition: The microarray analysis data reported in this paper have been deposited
in the Gene Expression Omnibus (GEO) database,www.ncbi.nlm.nih.gov/geo(accession
no.GSE83271).
1D.H. and O.N. contributed equally to this work.
2To whom correspondence should be addressed. Email: [email protected].
This article contains supporting information online atwww.pnas.org/lookup/suppl/doi:10.
1073/pnas.1613254114/-/DCSupplemental.
Here, using a combination of transcriptomic analysis and
bio-chemical assays, we found that DCIR sustains type I IFN signaling
by ensuring proper STAT1 phosphorylation in DCs. Infection of
DCIR-KO mice along with in vitro assays revealed that DCIR
impairs antimycobacterial Th1 response through type I
IFN-mediated down-modulation of IL-12. These findings were validated
beyond TB, using an in vivo antigen-presentation assay based on
the adoptive transfer of peptide-loaded DCs from WT and KO
mice. In the case of TB, increased IL-12 production in
DCIR-KO animals translates into reduced bacterial burden in the lungs
of infected animals along with immunopathology. Considering
that type I IFNs are generally believed to play a detrimental role
during TB (16), our findings are in agreement that these
cyto-kines lead toward susceptibility to M. tuberculosis infection, as
evidenced by the lung bacterial burden in DCIR-KO animals.
Nonetheless, we also show that DCIR, through supporting type I
IFN signaling, may play a key role in the protection of host tissue
integrity during a pertinent inflammatory infectious context.
Results
DCIR Expression Enables Sustained Type I IFN Signaling in DCs.
Be-cause DCIR polymorphisms were associated with several
non-infectious inflammatory disorders in humans (17–19), we asked
whether DCIR could play a part in modulating immunity in the
context of a chronic inflammation of infectious nature, namely
TB. We first found that DCIR is expressed at the periphery of
lung granulomas in M. tuberculosis-infected nonhuman
pri-mates (NHPs), a model that closely mimics TB in humans,
during both asymptomatic infection and active TB disease (
SI
Appendix, Fig. S1
). To functionally explore the role of DCIR in
antimycobacterial immunity, we sought to exploit a previously
reported mouse model of DCIR (Dcir1/Clec4a2) deficiency
(13, 20). Because DCIR is primarily expressed in DCs (5), in
particular those from lungs and in bone marrow-derived DCs
(
SI Appendix, Fig. S2 A and B
), we first evaluated the impact of
this CLR in a global and unbiased manner through
genome-wide transcriptome analysis of bone marrow-derived DCs from
WT and DCIR-KO animals before and during M. tuberculosis
infection. Functional gene set enrichment analysis (GSEA)
and interrogation of the Interferome database (21) revealed
that a significant fraction of genes, which were down-regulated
in DCIR-KO DCs compared with WT cells, was dependent on
type I IFN and/or included genes involved in defense to viruses
(
SI Appendix, Fig. S3
and Fig. 1 A and B). Surprisingly,
IFN-stimulated genes (ISGs) modulated in KO DCs were already
detected before infection [i.e., in resting cells (Fig. 1 C and
D)]. This finding strongly suggested that DCIR recognizes host
endogenous ligand(s), which was already proposed in other
contexts (20). In line with this possibility, we did not find
ev-idence of any binding of DCIR to either whole mycobacterial
cells (
SI Appendix, Fig. S4A
) or purified mycobacterial surface
glycosylated components (
SI Appendix, Fig. S4B
), inferring
that DCIR-mediated signaling likely relies on recognition of
one or more, yet to be identified, endogenous ligand(s).
Sustained STAT1 Phosphorylation Requires DCIR Expression in DCs.
We next explored if DCIR deficiency resulted in the impairment
of production and/or of signaling of type I IFN. First, blocking
ligand recognition by the type I IFN receptor subunit IFNα/β
receptor 1 (IFNAR1) using the monoclonal antibody
MAR1-5A3 resulted in a complete shutdown of ISG expression (Fig.
2A), confirming that induction of these genes in infected DCs
was solely due to type I IFN signaling. Second, the expression of
mycobacterial receptors, type I IFN production or IFNAR
ex-pression in M. tuberculosis-infected DCs was unaltered in
DCIR-deficient DC (Fig. 2 B–D and
SI Appendix, Fig. S5
). Third, further
analysis of components of the JAK–STAT pathway, which
me-diates type I IFN signaling, revealed that JAK1 phosphorylation
was unaffected in DCIR-deficient DCs, compared with in WT
cells (Fig. 2E). By contrast, even though there was no difference
in protein levels, we found that STAT1 phosphorylation at Ser727
was diminished in KO DCs (Fig. 2F), implying a role for DCIR in
regulating the activity of this transcription factor. For this reason,
we analyzed the phosphorylation status of Src homology 2
do-main tyrosine phosphatase 1 (SHP1) and 2 (SHP2), known to be
involved in dephosphorylation of STATs (22, 23). We found that
SHP2 phosphorylation was increased in DCIR-deficient cells by
Western blotting (Fig. 2G) and by ELISA (Fig. 2H). This result
suggested that the increase in the phosphorylated, active form
of SHP2 might be responsible for STAT1 dephosphorylation.
Noteworthy is that M. tuberculosis is known to stimulate TLR2,
and our results could be recapitulated in DCs costimulated with a
TLR2 agonist and IFNβ (Fig. 2 E, F, and H). In this condition, we
found that neither STAT1 phosphorylation at Tyr701 (
SI
Ap-pendix, Fig. S6A
) nor SHP1 phosphorylation (
SI Appendix, Fig.
S6B
) was modified in DCIR-KO cells compared with WT cells.
Lastly, treatment of the cells with the recently reported highly
specific SHP2 inhibitor GS-493 (24) resulted in restored STAT1
phosphorylation in DCIR-KO cells (Fig. 2I), thus demonstrating
that impaired STAT1 phosphorylation in DCIR-KO DCs was due
to SHP2. Altogether, these findings are consistent with a scenario
whereby DCIR deficiency leads to an increased phosphorylation
of SHP2, which in turn decreases STAT1 phosphorylation and
consequently type I IFN signaling. Not unexpectedly, because
STAT1 and SHP2 are also involved in type II IFNγ signaling, we
found that the overall response of DCIR-KO DCs to IFNγ was
also altered, compared with their WT counterparts (
SI Appendix,
Fig. S6C
).
DCIR Deficiency Results in Enhanced Antimycobacterial Th1 Immunity.
To explore the role of DCIR in immunity to M. tuberculosis in
vivo, we infected DCIR-KO mice and found that they harbored
significantly less bacteria in their lungs and spleen than WT
animals (Fig. 3A). Indeed, this finding was associated with an
increased cell infiltration in the lungs of KO mice (Fig. 3B), in
particular with an increased influx of CD4
+and CD8
+T cells, B
cells, macrophages, and DCs (Fig. 3 B and C and
SI Appendix,
Fig. S7
). Th1 cells are critical in immunity to TB (2). Analysis of
lung T cells from M. tuberculosis-infected animals revealed an
increased proportion of IFNγ-producing Th1 cells in the lungs of
DCIR-KO mice, compared with WT animals (Fig. 4 A and B).
Moreover, the overall production of IFNγ was increased in the
lungs of KO mice (Fig. 4C). Ex vivo restimulation of lung cells
with purified protein derivative (PPD), a mixture of
mycobac-terial antigens, indicated that at least a fraction of these Th1 cells
were M. tuberculosis-specific because they overproduced IFNγ
in a PPD-specific manner (Fig. 4D). In line with these results,
given the role of the master regulator T-bet in IFNγ production
and Th1 lineage commitment (25), we confirmed an increase in
CD3
+T-bet
+Th1 cells in pulmonary cell infiltrates of infected
DCIR-KO mice (Fig. 4E). Importantly, we found that T cells
from WT or KO mice can be equally activated by polyclonal
stimuli (
SI Appendix, Fig. S8
), which support the notion that the
observed phenotype relies on differential T stimulation by WT
vs. DCIR-KO DCs. One of the functions of Th1 lymphocytes is
to drive macrophage polarization toward a proinflammatory,
antimicrobial M1-like profile (26). Gene expression analysis in
the lungs of infected KO mice revealed a decreased expression
of the M2 markers Arg1, Ym1, and Mrc1 and an increased
ex-pression of the M1 markers Nos2 and Tnf, compared with WT
mice (Fig. 4F). Finally, IL-12–p70, which drives Th1
differen-tiation, was also produced more abundantly in the lungs of
infected KO mice (Fig. 4G). Collectively, these findings
in-dicated that inflammation and antimycobacterial Th1 response
are augmented in DCIR-deficient animal.
IMMUNOLO
GY
AND
INFLAMMATION
In the TB context, Th1 priming occurs in the lung-draining,
mediastinal lymph nodes (LNs). Similar to the lungs, an increase
in Th1 cells, IFNγ, and IL-12 profiles was observed in the
me-diastinal LNs from KO mice compared with those from WT mice
(
SI Appendix, Fig. S9 A–D
). Of note, IL-12–p70 overproduction
in DCIR-deficient DCs was recapitulated in DCs stimulated with
a TLR2 agonist (
SI Appendix, Fig. S9E
). Type I IFNs are known
to inhibit IL-12–p70 in myeloid cells, including DCs (27), and in
particular in M. tuberculosis-infected monocytes and
macro-phages (28, 29). Accordingly, stimulation by IFNβ resulted in a
strong suppression of IL-12–p70 production by TLR2-activated
DCs (
SI Appendix, Fig. S9F
). Unlike that recently reported in
M. tuberculosis-infected macrophages (29), IL-10 was not
in-volved in IFNβ/DCIR-mediated IL-12 suppression because the
expression of this cytokine was not modulated in DCIR-deficient
DCs compared with WT cells (
SI Appendix, Fig. S9G
). Strikingly,
treatment of TLR2-stimulated DCs with the SHP2 inhibitor
GS-493 reduced IL-12–p70 production by DCIR-KO cells to WT
levels (
SI Appendix, Fig. S9H
). All things considered, these
findings indicated that overproduction of IL-12–p70, and
con-sequently increased Th1 priming, by DCIR-KO DCs during
M. tuberculosis infection in vivo is likely due to an impairment of
A
B
C
D
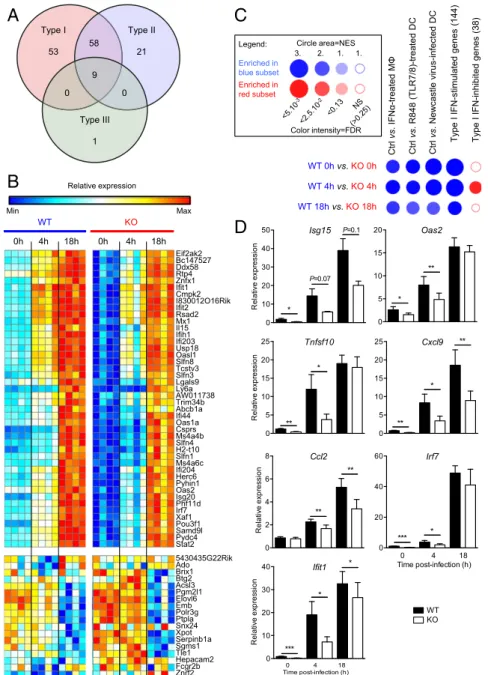
Fig. 1. DCIR expression results in sustained expression of ISGs in murine DCs. (A) Venn diagram of ISGs down-modulated in DCIR-deficient DCs, compared with in WT cells, at 0 or 4 h after M. tuberculosis infection. Data were generated using the Interferome online interface (21). (B) BubbleMap analysis, a high-throughput extension of GSEA, on the pairwise comparisons of DCs from WT vs. DCIR-deficient mice at different time points after M. tuberculosis infection. The gene sets shown, coming from independent experiments, include direct ISGs either up- or down-regulated in conventional DC subsets and genes reg-ulated by type I IFN, by a TLR7/8 ligand known to induce type I IFN, or by a viral infection in macrophages or DCs. (C) Heat map of the genes belonging to the ISG gene set and found down-regulated in DCs from DCIR-KO compared with WT mice (Top) or belonging to the IFN-inhibited genes gene set and found up-regulated in DCs from DCIR-deficient compared with WT mice (Bottom) upon M. tuberculosis infection. For each gene, relative gene expression values across DCs from WT and DCIR-KO mice infected with M. tuberculosis at 0, 4, and 18 h is shown and varies from low (blue) to high (red). (D) Expression profiles of selected genes from the gene set of down-modulated genes in DCIR-deficient DCs and other ISGs. Data are presented as means± SEM of four biological replicates. Statistical analysis was performed using Student’s t test. *P < 0.05; **P < 0.01.
A
B
C
D
E
F
G
H
I
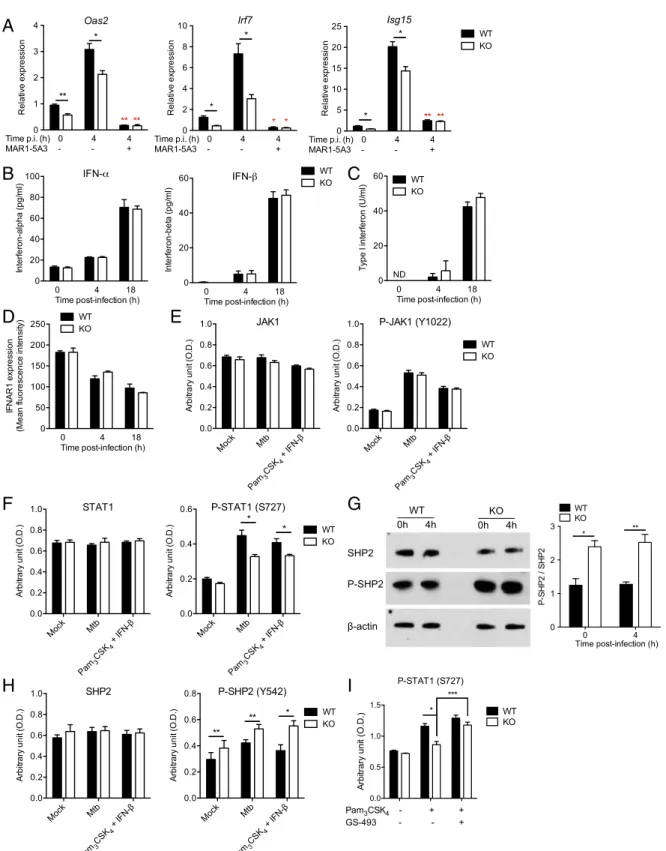
Fig. 2. DCIR expression leads to sustained type I IFN signaling in DCs. (A) Bone marrow-derived DCs from WT or KO mice were either left uninfected or infected (4 h) with M. tuberculosis H37Rv in the presence or absence of the IFNAR1-blocking monoclonal antibody MAR1-5A3, as indicated. Relative ex-pression of the ISGs Oas2, Irf7, and Isg15 was quantified by RT-qPCR. Red asterisks correspond to comparison analysis between MAR1-5A3–treated and –untreated cells. (B–D) WT or KO DCs were either left uninfected (0 h) or infected for 4 or 18 h with M. tuberculosis. IFNα and IFNβ (B) were quantified in the cell supernatants by ELISA or using the type I IFN-activity reporter cell line B16 Blue IFNα/β (C). The expression of IFNAR1 was quantified by FACS (D). (E–I) WT or KO DCs were left unstimulated (Mock), were infected with M. tuberculosis for 4 h, or were costimulated with the TLR2 agonist lipopeptide Pam3CSK4and IFNβ
for 4 h, as indicated. In I, cells were left untreated or were treated with the SHP2 inhibitor GS-493 (24). JAK1 (E), STAT1 (F and I), SHP-2 (G and H), and their phosphorylated forms were quantified in cell lysates by Western blot (WB) (G) or ELISA (E, F, H, and I). G, Right presents quantification of three independent WB analyses (G, Left) by densitometry. In A–I, data are presented as means ± SEM of at least three biological replicates and are representative of at least two independent experiments. Statistical analysis was performed using Student’s t test. *P < 0.05, **P < 0.01.
IMMUNOLO
GY
AND
INFLAMMATION
type I IFN signaling, which was also observed in the LNs of
in-fected animals (
SI Appendix, Fig. S9I
).
DCIR Expression Results in Impaired Th1 Priming by DCs.
To
gener-alize our findings beyond TB, we performed an in vivo antigen
presentation assay based on adoptive transfer, as described
pre-viously (30). Briefly, OT-II antigen receptor transgenic T cells were
purified and injected i.v. into C57BL/6J recipients. Two days later,
mice were challenged in the hind footpads with ovalbumin (OVA)
peptide-pulsed (or unpulsed) WT or DCIR-KO DCs. After 5 d of
priming, popliteal LN cells were harvested from recipients, and
cytokine secretion was assessed. In line with our findings in M.
tu-berculosis-infected mice, the OVA-specific Th1 response tended to
increase in the recipients animals challenged with DCIR-KO DCs
(Fig. 5A). More markedly, the production of IFNγ and IL-12–
p70 was strongly increased in animals challenged with DCIR-KO
DCs, compared with WT DCs (Fig. 5 B and C), which correlated
with a decreased expression of several ISGs (Fig. 5D).
Discussion
In this study, we show that DCIR modulates immunity to
M. tuberculosis through sustaining type I IFN signaling in DCs,
which reduces IL-12–p70 production and Th1 expansion. As a
consequence, DCIR-deficient mice control M. tuberculosis
in-fection better than their WT counterparts but also develop more
immunopathology in the lungs. These findings have several
consequences for our understanding of DCIR signaling in
im-munity and of that of type I IFN in TB.
Because DCIR contains an ITIM in its cytoplasmic tail, it is
thought to act as a negative regulator of immune cell signaling
A
B
C
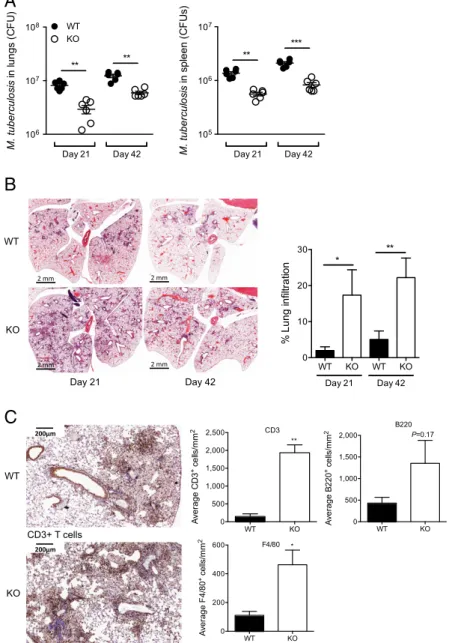
Fig. 3. DCIR expression results in impaired bacterial clearance and controls pathology in M. tuberculosis-infected mice. (A–C) WT or KO mice were infected intranasally with∼1,000 cfu of M. tuberculosis H37Rv. Lungs and spleen were collected after 21 or 42 d of infection and analyzed for colony-forming unit (CFU) content (A), cell infiltration (B), and immune cell subsets at 42 d (C). In A, each symbol represents colony-forming units from one animal. Data are representative of three independent experiments. In B and C, data are presented as means± SEM of at least 25 fields chosen from at least 3 independent tissue slices and are representative of 2 independent experiments. Statistical analysis was performed using Student’s t test. *P < 0.05, **P < 0.01. (C, Top Left, Bottom Left, and Top Center) CD3+T cells. (C, Bottom Center and Right) Quantification of other cell types (F4/80-expressing macrophages and B220-expressing B lymphocytes). Pictures are displayed inSI Appendix, Fig. S7A.
A
B
C
E
G
D
F
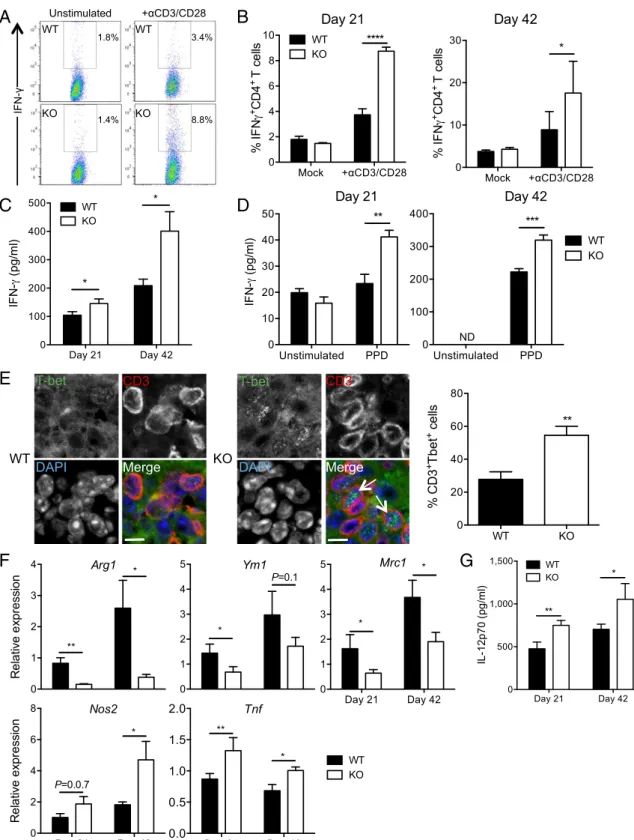
Fig. 4. DCIR expression leads to impaired Th1 immunity and M1-like macrophage polarization in M. tuberculosis-infected mice. Mice were infected as in Fig. 3. (A and B) IFNγ-producing CD4+Th1 cells were quantified by intracellular cytokine FACS staining after either stimulation with a mixture of anti-CD3 and
-CD28 antibodies or in the absence of stimulation (Mock), as indicated. A representative experiment among three at day 21 is depicted in A. B represents means± SEM of six biological replicates. (C and D) ELISA quantification of total IFNγ in lung lysates of infected mice (C) or after ex vivo restimulation of total lung cells with PPD (D). ND, not detected. (E) Immunohistological analysis of expression of CD3 and the Th1-driving transcription factor T-bet in lungs of infected WT or KO mice. E, Right presents quantification of 404 and 313 WT or KO CD3+cells, respectively, and data are representative of n= 2 mice. Arrows show the presence of T-bet in the cell nuclei. (Scale bars: 10μm.) (F) RT-qPCR quantification of expression of macrophage M2 (Arg1, Ym1, and Mrc1) and M1 (Nos2 and Tnf) polarization gene markers in the lungs of infected mice. (G) ELISA quantification of IL-12–p70 in lung lysates of infected mice. In B–D, F, and G, data are presented as means± SEM of at least three replicates and are representative of at least two independent experiments. Statistical analysis was performed using Student’s t test. *P < 0.05; **P < 0.01; ***P < 0.001; ****P < 0.0001.
IMMUNOLO
GY
AND
INFLAMMATION
(4). However, our data clearly show that DCIR deficiency results
in impaired type I IFN signaling in DCs, suggesting that this
receptor activates, rather than inhibits, the IFNAR-associated
JAK–STAT pathway. Based on these findings, we propose that
one physiological role of DCIR is to sustain type I IFN signaling
in DCs through interactions with self-glycosylated ligands that
remain yet to be identified. The DCIR ITIM was shown to bind
to unphosphorylated, but not phosphorylated, SHP2 (31). DCIR
may therefore function as a molecular sink for
unphosphory-lated, inactive SHP2, thus limiting SHP2’s capacity to deactivate
STAT1. Our findings are reminiscent of several membrane
re-ceptors in which the ITIM activates, rather than inhibits, various
signaling pathways (32). How ITIM-containing DCIR delivers an
activating, rather than inhibitory, signal will need to be further
dissected on the molecular level. In particular, whether DCIR
delivers a signal on its own through its ITIM motif or requires a
coreceptor will need to be addressed.
Another critical aspect worth highlighting is the notion that the
levels of type I IFN produced during M. tuberculosis infection have
important consequences for the host. Our results support the notion
that type I IFNs are detrimental in TB (2) if one considers the lung
bacterial burden as the main sign of TB disease. Nevertheless, we
also show that DCIR, through sustaining type I IFN signaling,
modulates lung immunopathology, which is a hallmark of TB in
human, and therefore also contributes to protection. Further work
is needed to understand the many roles of type I IFNs in TB, as
suggested by a recent study showing that these cytokines can be
protective or detrimental depending on the stage of M. tuberculosis
infection (33) and on the M. tuberculosis strain (34). Interestingly,
previous studies reported that DCIR-KO animals tend to develop
more autoimmune CD4
+T cell-associated (Th1- or
Th17-associ-ated) pathologies (14, 15). Based on our findings, it is likely that
these phenotypes rely on an increased IL-12 production through
impaired type I IFN signaling, which was not investigated in
these cases.
In conclusion, our study identifies DCIR as a key molecular
player not only in immunity to TB but more generally in tuning the
balance between type I and type II IFN responses, which might be
relevant in the context of a number of inflammatory diseases of
noninfectious (e.g., autoimmune) or infectious (e.g., viral) nature.
Identifying DCIR ligands with various pharmacological properties
(agonist or antagonist) might help in developing type I
IFN-tar-geting therapies for a range of inflammatory disorders, beyond TB.
Materials and Methods
Ethics Statements for NHP Samples. The NHP study protocol was in compliance with the European Commission (EC) Directive 86/609/EEC, approved by the Biomedical Primate Research Centre ethical committee before the start of the study, and executed under Dutch law regulating animal experiments (Agreement DEC 579). For any particular animal, the endpoint was defined either by signs of severe disease (humane endpoint criteria, referring to animal condition by adverse body weight development, respiratory capacity, and animal behavior) or by protocol, which limited the follow-up time to 1 y postinfection.
NHP Handling and Vaccination. NHP materials were derived from animals that were used for vaccine research and development purposes. Specifically, healthy young adult female rhesus macaques (Macaca mulatta), all captive-bred for research purposes and of homogeneous breeding background, were vaccinated (or not) with a standard human dose of M. bovis Bacille Calmette et Guérin (bacillus Calmette–Guérin) Danish 1331 (Statens Serum
A
B
C
D
Fig. 5. In vivo function of DCIR in Th1 immunity. OT-II T-cell receptor transgenic T cells were purified and injected into C57BL/6J recipients. Two days later, mice were challenged in the footpads with OVA peptide-pulsed or unpulsed WT or DCIR-deficient DCs. After 5 d of priming, popliteal LN cells were harvested from recipients. (A) Percentage of IFNγ-producing CD4+OVA-specific (OT-II) Th1 cells adoptively transferred into C57BL/6J recipients and primed in vivo with
peptide-pulsed or unpulsed DCs. (B and C) ELISA quantification of IFNγ (B) and IL-12–p70 (C) in LN lysates from recipient mice. (D) RT-qPCR quantification of gene expression of the ISGs Isg15, Irf7, and Oas2 in LN lysates from recipient mice. Data are presented as means± SEM of five biological replicates. Statistical analysis was performed using Student’s t test. *P < 0.05; **P < 0.01.
Institut) by intradermal injection. Nine months later, the animals were challenged with 500 cfu of M. tuberculosis strain Erdman K01 (prepared and provided under an agreement between the World Health Organization and Food and Drug Administration Center for Biologics Evaluation and Research with the assistance of Aeras), which was administered by intrabronchial in-stillation under sedation. At the endpoint, animals were sedated, eutha-nized, and submitted to macroscopic lung pathology scoring as described previously (35). Gross pathological findings were assessed and described by an experienced veterinary pathologist while blinded for treatment. Repre-sentative lung samples were collected and fixed in 10% neutral buffered formalin and embedded in paraffin for long-term storage. A blind analysis was performed to quantify immunohistochemical stainings of fixed samples. Mice, Cells, and Bacteria. Dcir1(Clec4a2)−/−mice (20) were provided by the NIH-sponsored Mutant Mouse Regional Resource Center (MMRRC). The KO mouse strain was originally generated by the Consortium for Functional Glycomics (CFG) (http://www.functionalglycomics.org/static/consortium/resources/ DataCoreFdcir.shtml). The strain was then further backcrossed for more than 10 generations on a C57BL/6 background. Animals used in this study con-sisted in Dcir1(Clec4a2)+/+ and Dcir1(Clec4a2)−/− mice originating from common Dcir1(Clec4a2)−/+breeding pairs. Details for genotyping are avail-able on the CFG website. All mouse experiments were performed in animal facilities that met all legal requirements in France and by qualified personnel in such a way to minimize discomfort for the animals. All procedures, in-cluding mouse studies, were conducted in strict accordance with French laws and regulations, in compliance with the EC Directive 68/609/EEC guidelines and its implementation in France. All protocols were reviewed and approved by the Regional Ethical Committee (reference MP/ 04/26/07/03). All efforts were made to minimize suffering. The study did not involve humane end-points. KO and WT (C57BL/6J) mice were housed and bred in a specific pathogen-free environment at the animal facility of the Transgenèse et archivage d’animaux modèle facility, Orléans, France. Animal care and ex-perimentation were consistent with the French guidelines and were ap-proved by the Ministry of Higher Education and Research (Agreement APAFIS 1269). In particular, all efforts were made to minimize animals dis-comfort and suffering.
Bone marrow-derived DCs were prepared from murine hind legs by flushing the uncovered and opened femurs and tibiae with Dulbecco’s PBS (DPBS) (Gibco). Red blood cells were lysed by addition of red blood cell lysis buffer (Sigma) for 2 min. Subsequently, cells were separated with a cell strainer and cultivated in 6- or 24-well plates (Thermo Scientific) at 2× 10⁶or 5× 10⁵cells
per well, respectively, in complete Roswell Park Memorial Institute (RPMI) 1640 medium (Gibco) supplemented with 10% (vol/vol) FCS (PAN-Biotech), 1% sodium pyruvate (Gibco), 0.1%β-mercaptoethanol (Gibco), and 20 ng/mL recombinant murine GM-CSF (Peprotech). Cells were allowed to differentiate for 5–7 d. The culture medium was replaced every 2–3 d, and the cells were used for stimulation studies between day 7 and day 9 after the start of dif-ferentiation. The complete DC culture medium was checked for LPS con-tamination using the HEK-Blue TLR4 reporter cell line (Invivogen) according to manufacturer’s instructions, and was found free of LPS (SI Appendix, Fig. S10).
M. tuberculosis (H37Rv strain) was grown in Middlebrook 7H9 culture medium (Difco) supplemented with 10% albumin–dextrose–catalase (ADC) (Difco), 0.05% Tween-80 (Sigma), or on Middlebrook 7H11 agar medium (Difco) supplemented with 10% oleic acid–ADC (Difco).
Mouse Infection and Cell Stimulation. Six- to 10-wk-old female C57BL/6J or Dcir1−/−mice were anesthetized in gas chambers containing isoflurane. Mice were infected intranasally with 1,000–1,500 cfu of M. tuberculosis in 25 μL of DPBS (Gibco). Mice were killed by cervical dislocation after 21 or 42 d. Lungs and spleens were harvested, homogenized, and plated onto 7H11 agar for colony counts. Bone marrow-derived DCs were stimulated at 37 °C for var-ious periods of time with M. tuberculosis at a multiplicity of infection of three bacteria per cell or 1 μg/mL PAM3CSK4 (Invivogen), 1,000 U/mL
recombinant murine IFNβ (Biolegend), with or without prior incubation with 1μg/mL of an IFNAR1 blocking antibody (clone MAR1-5A3; Biolegend) for 2 h at 37 °C or with the SHP2 inhibitor GS-493 (24) at 25μM for 20 h at 37 °C. Microarray Analysis. RNA from lungs, mediastinal, or popliteal LNs or from mouse bone marrow-derived DCs were extracted using the RNeasy mini kit (Qiagen). The amount and purity of RNA were quantified using a NanoDrop ND-1000 apparatus (Thermo Scientific) by measuring absorbance at 260/280 nm. Double-stranded cDNA was reverse-transcribed using the M-MLV Reverse Trancriptase kit (Invitrogen), according to the manufacturer’s protocol. For microarray analysis, cDNA was labeled with Cy3–dCTP using the One-Color
DNA labeling kit (Roche NimbleGen). Gene expression was analyzed using SurePrint G3 Mouse gene expression 8*60K microarray kit (Agilent). Hy-bridization was performed using 2μg Cy3–cDNA and the hybridization kit (Roche NimbleGen). Samples were incubated for 5 min at 65 °C and 5 min at 42 °C before loading for 17 h at 42 °C according to the manufacturer’s protocol. Microarrays were washed and scanned using an MS200 microarray scanner (Roche NimbleGen). Microarrays were washed and scanned using an MS200 microarray scanner (Roche NimbleGen).
Agilent raw files extracted by using Feature Extraction software were processed through Bioconductor (version 3.1) in the R statistical environment (version 3.2.0) via the limma package (36). Raw expression values were background corrected in a“normexp” fashion and then quantile normalized (37). Quality of the hybridizations and evaluation of the sampling method were assessed by density plots, boxplots, principal component analyses, and hierarchical clusterings using the ade4 and cluster packages (38). Normalized expression values were then corrected for batch effects due to the cell sorts at different days, using the ComBat algorithm (39) through the sva package (40) and declaring two batches (two sorting days) and the genotype and postinfection time as covariates.
The ComBat-corrected expression values were then used to extract, via the limma package, the genes differentially expressed (false discovery rate, <0.05) between DCs from WT and Dcir1−/−mice at each time point after
M. tuberculosis infection. The JVenn plugin (41) was used to draw Venn diagrams showing the overlaps between lists of up- or down-regulated genes in the DCs from Dcir1−/−compared with WT mice.
To assess the statistical enrichment of gene sets of interest in the pairwise comparisons between DCs from WT and Dcir1−/−mice at each time point after M. tuberculosis infection, we used BubbleMap (42), a high-throughput extension of GSEA methodology (43). BubbleMap analysis was performed with 1,000 gene set-based permutations, and with“difference of classes” as a metric for ranking the genes because the data were expressed in log2 scale. The results are displayed as a BubbleMap, where each bubble is a GSEA result and summarizes the information from the corresponding en-richment plot. The color of the Bubble corresponds to the condition from the pairwise comparison in which the gene set is enriched. The bubble area is proportional to the GSEA normalized enrichment score. The intensity of the color corresponds to the statistical significance of the enrichment, de-rived by computing the multiple testing-adjusted permutation-based P value using the Benjamini–Yekutieli correction. Enrichments with a statistical sig-nificance above 0.05 are represented by empty circles.
Generation of the Type I ISG and IFN-Inhibited Gene Sets. To generate a list of genes directly activated or inhibited by type I IFN, we used data of one of our previous studies (44) where we compared the transcriptomic profiles of WT vs. Ifnar1−/−DC subsets coming from mixed bone marrow chimera mice, lethally irradiated and reconstituted with a mixture of CD45.1 WT and CD45.2 IFNAR−/−bone marrow, infected with murine cytomegalovirus. More specifically, we extracted, using the GeneSign module of the BubbleGUM software (42), the genes that were up- or down- regulated at least twofold in Ifnar1−/−compared with WT CD8α+or CD11b+conventional DCs (cDCs)
from infected mice. We then selected the genes commonly found up- or down-regulated in both cDC subsets to generate the type I IFN inhibited or stimulated genes, respectively (SI Appendix, Table S1). We then added hundreds of public gene sets downloaded from MSigDB (45) to assess sta-tistical enrichments of our gene sets of interest through BubbleMap (42).
The heat map was performed with Gene-E (https://www.broadinstitute. org/cancer/software/GENE-E), using the ComBat-corrected expression values of the genes belonging to the ISG or IFN-inhibited gene (IIG) gene sets that were found regulated in DCs from DCIR-KO mice upon M. tuberculosis in-fection. Specifically, using GSEA, we extracted the leading edges of the ISG gene set enriched in WT DCs at the three time points, selected the genes found in the overlap of the three leading edges to display their expression profiles in the heat map. For the IIGs, we focused on the leading edge of the IIG gene set enriched in DCIR-KO DCs at 4 h after M. tuberculosis infection. Real-Time qPCR. For real-time qPCR (RT-qPCR), specific PCR primers (SI Ap-pendix, Table S2) were designed using QuantPrime. Real-time qPCR was performed with gene targeted primers using qPCR Mastermix plus SYBR Green (Eurogenetec), according to the manufacturer’s protocol. All real-time qPCR reactions were carried out using a 7500 Real-Time PCR System and data were analyzed using the 7500 Software version 2.0.6 (Applied Biosystems). PCR array data were calculated by the comparative cycle threshold method, normalized with hypoxanthine–guanine phosphoribosyltransferase house-keeping gene, and expressed as mean fold change in experimental samples relative to control samples.
IMMUNOLO
GY
AND
INFLAMMATION
ELISA and ISG Reporter Cell Line. After stimulation, supernatants from lungs, from mediastinal or popliteal LNs, or from bone marrow-derived DCs were harvested, and IFNα and IFNβ (VeriKine ELISA kit), IL-12–p70, IFNγ, and IL-10 (OptEIA kit; BD Biosciences) were detected by ELISA according to the manufacturer’s instructions.
For IFN activity measurement, supernatants from DCs were added in six-well plates containing the B16 Blue IFNα/b reporter cell line (Invivogen) for 24 h at 37 °C. This reporter cell line expresses the SEAP reporter gene under the control of the IFNα/β-inducible ISG54 promoter enhanced by a multimeric ISRE. Levels of SEAP were monitored using the detection medium QUANTI-Blue (Invivogen) according to the manufacturer’s instructions. For phos-phorylation detection, DCs were lysed after stimulation in buffer containing phosphatase and protease inhibitors (Thermo Fisher). JAK1, phospho-JAK1, STAT1, phospho-STAT1 (Ser727), and phospho-STAT1 (Tyr701) were detected by ELISA (Raybiotech) according to the manufacturer’s instructions. Colori-metric cell-based assays were performed for detection of SHP1, phospho-SHP1 (Tyr536), SHP2, and phospho-SHP2 (Tyr542) (AssaybioTech) according to the manufacturer’s instructions.
Western Blotting. Cells in six-well plates were detached with trypsin-EDTA (Invitrogen), centrifuged and then lysed by adding 100μL of boiling 2× Laemmli buffer containing phosphatase inhibitors (2 mM orthovanadate, 5 mM NaF) onto cell pellets for 5 min; 20μg of protein was subjected to electrophoresis in 10% SDS/PAGE gels and transferred onto a nitrocellu-lose membrane. Membranes were saturated with 3% BSA in TBS-T [50 mM Tris (pH 7.2), 150 mM NaCl, and 0.1% Tween 20) for 30 min and incubated with primary antibodies overnight at 4 °C. Antibodies used were: anti-SHP2 (clone M163; Abcam), anti-PY542-SHP2 [clone EP508(2)Y; Abcam], and
anti-β actin (clone 20-33; Sigma-Aldrich). Then, primary antibodies were revealed using a HRP-coupled secondary anti-mouse (Sigma) or anti-rabbit (Cell Signaling Technology) antibody for 1 h. Finally, HRP activity was revealed using an electrochemiluminescence kit (GE Healthcare Life Sciences) according to the manufacturer’s instructions. All blots were normalized against actin expression and protein quantity was set to one in the control for quantification.
Binding Experiments. All binding experiments were performed in lectin buffer (50 mM Hepes, 5 mM MgCl2, 5 mM CaCl2) containing 0.5 mg/mL BSA (Sigma).
Nonspecific binding to M. tuberculosis was prevented by incubating the bac-teria for 30 min at room temperature in lectin buffer containing 2 mg/mL BSA. Bacteria were then incubated with 10μg/mL chimeric Dcir1–human (h)IgG1 fragment crystallizable (Fc) (20) at 37 °C for 1 h in the presence or absence of 20 mM EDTA (Euromedex). After washing in lectin buffer, bacteria were in-cubated with a PE-coupled polyclonal anti-hIgG (Fcγ-specific; eBiosciences) at 5μg/mL for 1 h at room temperature. Bacteria were then washed and fixed for 2 h at room temperature in PBS containing 4% paraformaldehyde (Polyscience) and analyzed by flow cytometry. For ligand binding experiments, different constituent of the mycomembrane, namely phosphatidylinositol dimanno-sides, arabinosylated lipoarabinomannan, mannosylated lipoarabinomannan, lipomannan, arabinogalactan, and trehalose dimycolate were coated onto 96-well plates (Nunc Immuno Plates Maxisorp; Sigma) in water:ethanol (1:1, vol/vol) at different concentrations. The plates were dried and incubated with lectin buffer containing 2 mg/mL BSA at room temperature for 2 h (saturation step). The plates were then incubated with 10μg/mL of chimeric DCIR–hFc at room temperature during 2 h. After washing, binding was detected using a biotinylated polyclonal anti-human IgG (Fcγ-specific; eBioscience) at 5 μg/mL for 1 h at room temperature, and streptavidin-HRP at 100 ng/mL for 30 min at room temperature. After washing, substrate solution (TMB substrate re-agent set; BD Biosciences) was added for 30 min at room temperature and the reaction was stopped with H2SO4. Colorimetric analysis was performed
at 450–570 nm using a spectrophotometer.
FACS Analysis. Mouse DCs or primary cells obtained from homogenized lungs or mediastinal or popliteal LNs were stained with fluorescein-conjugated monoclonal antibodies (1:100) directed against mouse Clec4a2 (320507; LS-Bio), CD11b (M1/70; eBiosciences), CD11c (N418; Biolegend), TLR-2 (6C2; eBiosciences), SIGNR1 (22D1; eBiosciences), Dectin 1 (bg1fpj; eBiosciences) CD86 (GL1; eBiosciences), I-A/I-E (M5/114.15.2; Biolegend), PD-L1 (10F.9G2; Biolegend), IFNAR1 (MAR1-5A3; eBiosciences), CD3 (17A2; Biolegend), CD4 (RM4-5; BD Biosciences), or F4/80 (BM8; Biolegend). For intracellular cell staining, cells from homogenized lung or mediastinal LN were stimulated during 4 h at 37 °C with a mix of purified anti-mouse CD3 (17A2; Biolegend) and CD28 (37.51; Biolegend) at 5μg/mL or with PPD at 10 μg/mL. Cells were incubated in GolgiPlug (BD Biosciences) overnight. Subsequently, cells were resuspended in Fixation-Permeabilization solution (BD Cytofix/Cytoperm kit;
BD Biosciences) and intracellular cytokine staining was carried out according to the manufacturer’s protocol. Cells were stained with fluorescein-conju-gated monoclonal antibodies (1:100) directed against mouse CD4 (RM4-5; BD Biosciences) and IFNγ (XMG1.2; BD Biosciences). For mortality assessment, cells were stained with Annexin V (BD Biosciences) according to the manufacturer’s instruction.
Histological Analysis. Paraffin-embedded tissue samples were sectioned and stained with hematoxylin and eosin for histomorphological analysis. Histo-pathological scoring of TB lesions in NHPs (SI Appendix, Table S3) was de-termined using a worksheet in which TB disease from lung biopsies was described (35). Histopathological scoring of TB lesions in WT and DCIR-KO mice was determined by measuring area of infiltrated lung tissue using the Panoramic viewer software (3DHISTECH). Immunohistochemical staining was performed on paraffin-embedded tissue sections, using polyclonal and monoclonal primary antibodies summarized inSI Appendix, Table S4. Immu-nostaining of paraffin sections was preceded by different antigen unmasking methods. After incubation with primary antibodies, sections were incubated with biotin-conjugated polyclonal mouse, rat or rabbit Ig anti-bodies followed by the streptavidin–biotin–peroxidase complex (ABC) method (Vector Laboratories) and then were counter stained with hematoxylin. Slides were scanned with the Panoramic 250 Flash II (3DHISTECH). Virtual slides were automatically quantified for B and T lymphocytes, and macrophages distri-butions as described previously (46). For confocal microscopy, samples were stained with primary antibodies as described above and followed by anti-mouse IgG isotype-specific, anti-rat or anti-rabbit IgG antibodies labeled with Alexa 488 and Alexa555 (Molecular Probes). Samples were mounted with Prolong Antifade reagent (Molecular Probes) and examined using a 60×/1.4 NA objective of an Olympus FV1000 confocal microscope.
In Vivo Antigen-Presentation Assays. The assay was based on adoptive transfer, as described previously (30). OT-II T cells were purified from the spleen of C57BL/6J OT-II mice [a kind gift from S. Guerder, Center for Physiopathology of Toulouse–Purpan (CPTP), Toulouse, France] using mouse anti-CD4 microbeads (L3T4) positive selection and MACS separation columns (Miltenyi Biotec), according to the manufacturer’s instructions. Purified T cells were injected i.v. into C57BL/6J mouse recipients. Two days later, OVA peptide (ISQAHAAHAEINEAGR)-pulsed-bone marrow DCs from C57BL/6J or Dcir1−/−mice were washed at least three times in RPMI 1640 and adminis-tered in DPBS at a dose of 3.105cells in a volume of 25–40 μL into the fore or
hind footpads. The antigen-pulsed DCs were administered on one side, and the contralateral footpad served as the control. The control footpads were injected with DCs that had not been antigen-pulsed. At day 5, the draining popliteal LNs were removed and teased into a cell suspension. RNA was extracted to performed RT-qPCR as described in the experimental proce-dures of the manuscript. In parallel, cells were cultured and stimulated with antigens for 4 h in prewarmed RPMI-1640 supplemented with 10% FCS, 1% sodium pyruvate and 0.1%β-mercaptoethanol. Supernatants were collected to perform ELISA analysis and intracellular cell staining was performed. Statistics. Statistical analyses were performed using GraphPad Prism (GraphPad Software). Data are presented as means± SEM of at least three independent experiments; P values (paired or unpaired Student’s t test) are relative to the indicated control. Statistical significance was assumed when P< 0.05. ACKNOWLEDGMENTS. We thank Camille Robert (IPBS) for technical assis-tance and Sylvie Guerder (CPTP) for providing reagents. We thank A. Bénard for conceptual advice and Maha Maglinao, Julia Hütter, and Susanne Eisenschmidt for help in the production of DCIR–Fc and breeding and back-crossing of the DCIR-KO mice. We thank Eric Nawrotzky for the synthesis of inhibitor GS-493. We acknowledge the NIH-sponsored MMRRC National Sys-tem for supplying the Dcir1−/−mice. These mice were produced and depos-ited in the MMRRC by the CFG. This work was supported by CNRS, University of Toulouse, Agence Nationale de la Recherche (ANR)/Programme d ’Inves-tissements d’Avenir Grants ANR-11-EQUIPEX-0003 and ANR-12-BSV3-0002 B-TB; a French Ministry of Higher Education and Research Fellowship (to A.T.); Fondation pour la Recherche Médicale Fellowships (to C.D. and O.N.); Euro-pean Union TBVAC2020 Project 643381; the Bettencourt-Schueller Foun-dation; and a European Respiratory Society Fellowship (to D.P.). B.L. acknowledges funding from the European Union’s Horizon 2020 Research and Innovation Programme under Marie Sklodowska-Curie Grant 642870 (European Training Network–Immunoshape). T.-P.V.M. was funded by the European Research Council under the EC’s Seventh Framework Programme 2007–2013 Grant 281225 (to M.D.) for the SystemsDendritic Project. The funders had no role in study design, data collection and analysis, decision to publish, or manuscript preparation.
1. Cooper AM (2009) Cell-mediated immune responses in tuberculosis. Annu Rev Immunol 27:393–422.
2. O’Garra A, et al. (2013) The immune response in tuberculosis. Annu Rev Immunol 31: 475–527.
3. Ernst JD (2012) The immunological life cycle of tuberculosis. Nat Rev Immunol 12(8): 581–591.
4. Sancho D, Reis e Sousa C (2012) Signaling by myeloid C-type lectin receptors in im-munity and homeostasis. Annu Rev Immunol 30:491–529.
5. Bates EE, et al. (1999) APCs express DCIR, a novel C-type lectin surface receptor con-taining an immunoreceptor tyrosine-based inhibitory motif. J Immunol 163(4): 1973–1983.
6. Kerscher B, Willment JA, Brown GD (2013) The Dectin-2 family of C-type lectin-like receptors: an update. Int Immunol 25(5):271–277.
7. Nagae M, et al. (2016) Crystal structure of human dendritic cell inhibitory receptor (DCIR) C-type lectin domain reveals the binding mode with N-glycan. FEBS Lett 590(8): 1280–1288.
8. Bloem K, et al. (2014) DCIR interacts with ligands from both endogenous and path-ogenic origin. Immunol Lett 158(1-2):33–41.
9. Lambert AA, Gilbert C, Richard M, Beaulieu AD, Tremblay MJ (2008) The C-type lectin surface receptor DCIR acts as a new attachment factor for HIV-1 in dendritic cells and contributes to trans- and cis-infection pathways. Blood 112(4):1299–1307. 10. Meyer-Wentrup F, et al. (2008) Targeting DCIR on human plasmacytoid dendritic cells
results in antigen presentation and inhibits IFN-alpha production. Blood 111(8):
4245–4253.
11. Meyer-Wentrup F, et al. (2009) DCIR is endocytosed into human dendritic cells and inhibits TLR8-mediated cytokine production. J Leukoc Biol 85(3):518–525. 12. Zhao X, et al. (2015) DCIR negatively regulates CpG-ODN-induced IL-1β and IL-6
production. Mol Immunol 68(2 Pt C):641–647.
13. Fujikado N, et al. (2008) Dcir deficiency causes development of autoimmune diseases in mice due to excess expansion of dendritic cells. Nat Med 14(2):176–180. 14. Maruhashi T, et al. (2015) DCIR maintains bone homeostasis by regulating IFN-γ
production in T cells. J Immunol 194(12):5681–5691.
15. Seno A, et al. (2015) Exacerbation of experimental autoimmune encephalomyelitis in mice deficient for DCIR, an inhibitory C-type lectin receptor. Exp Anim 64(2):109–119. 16. McNab F, Mayer-Barber K, Sher A, Wack A, O’Garra A (2015) Type I interferons in
infectious disease. Nat Rev Immunol 15(2):87–103.
17. Guo J, et al. (2012) A replication study confirms the association of dendritic cell im-munoreceptor (DCIR) polymorphisms with ACPA - negative RA in a large Asian cohort. PLoS One 7(7):e41228.
18. Liu M, et al. (2015) Contribution of dendritic cell immunoreceptor (DCIR) polymor-phisms in susceptibility of systemic lupus erythematosus and primary Sjogren’s syn-drome. Hum Immunol 76(11):808–811.
19. Lorentzen JC, et al. (2007) Association of arthritis with a gene complex encoding C-type lectin-like receptors. Arthritis Rheum 56(8):2620–2632.
20. Maglinao M, Klopfleisch R, Seeberger PH, Lepenies B (2013) The C-type lectin receptor DCIR is crucial for the development of experimental cerebral malaria. J Immunol 191(5):2551–2559.
21. Rusinova I, et al. (2013) Interferome v2.0: an updated database of annotated in-terferon-regulated genes. Nucleic Acids Res 41(Database issue):D1040–D1046. 22. Wu TR, et al. (2002) SHP-2 is a dual-specificity phosphatase involved in Stat1
de-phosphorylation at both tyrosine and serine residues in nuclei. J Biol Chem 277(49): 47572–47580.
23. You M, Yu DH, Feng GS (1999) Shp-2 tyrosine phosphatase functions as a negative regulator of the interferon-stimulated Jak/STAT pathway. Mol Cell Biol 19(3):
2416–2424.
24. Grosskopf S, et al. (2015) Selective inhibitors of the protein tyrosine phosphatase SHP2 block cellular motility and growth of cancer cells in vitro and in vivo. ChemMedChem
10(5):815–826.
25. Szabo SJ, et al. (2000) A novel transcription factor, T-bet, directs Th1 lineage
com-mitment. Cell 100(6):655–669.
26. Murray PJ, et al. (2014) Macrophage activation and polarization: nomenclature and
experimental guidelines. Immunity 41(1):14–20.
27. McRae BL, Semnani RT, Hayes MP, van Seventer GA (1998) Type I IFNs inhibit human dendritic cell IL-12 production and Th1 cell development. J Immunol 160(9):4298–4304.
28. de Paus RA, et al. (2013) Inhibition of the type I immune responses of human monocytes by IFN-α and IFN-β. Cytokine 61(2):645–655.
29. McNab FW, et al. (2014) Type I IFN induces IL-10 production in an IL-27-independent manner and blocks responsiveness to IFN-γ for production of IL-12 and bacterial killing in Mycobacterium tuberculosis-infected macrophages. J Immunol 193(7): 3600–3612.
30. Lugo-Villarino G, Maldonado-Lopez R, Possemato R, Penaranda C, Glimcher LH (2003) T-bet is required for optimal production of IFN-gamma and antigen-specific T cell activation by dendritic cells. Proc Natl Acad Sci USA 100(13):7749–7754.
31. Richard M, Thibault N, Veilleux P, Gareau-Pagé G, Beaulieu AD (2006) Granulocyte macrophage-colony stimulating factor reduces the affinity of SHP-2 for the ITIM of CLECSF6 in neutrophils: a new mechanism of action for SHP-2. Mol Immunol 43(10): 1716–1721.
32. Barrow AD, Trowsdale J (2006) You say ITAM and I say ITIM, let’s call the whole thing off: the ambiguity of immunoreceptor signalling. Eur J Immunol 36(7):1646–1653. 33. Desvignes L, Wolf AJ, Ernst JD (2012) Dynamic roles of type I and type II IFNs in early
infection with Mycobacterium tuberculosis. J Immunol 188(12):6205–6215. 34. Wiens KE, Ernst JD (2016) The mechanism for type I interferon induction by
Myco-bacterium tuberculosis is bacterial strain-dependent. PLoS Pathog 12(8):e1005809. 35. Lin PL, et al. (2009) Quantitative comparison of active and latent tuberculosis in the
cynomolgus macaque model. Infect Immun 77(10):4631–4642.
36. Ritchie ME, et al. (2015) limma powers differential expression analyses for RNA-se-quencing and microarray studies. Nucleic Acids Res 43(7):e47.
37. Bolstad BM, Irizarry RA, Astrand M, Speed TP (2003) A comparison of normalization methods for high density oligonucleotide array data based on variance and bias. Bioinformatics 19(2):185–193.
38. Suzuki R, Shimodaira H (2006) Pvclust: an R package for assessing the uncertainty in hierarchical clustering. Bioinformatics 22(12):1540–1542.
39. Johnson WE, Li C, Rabinovic A (2007) Adjusting batch effects in microarray expression data using empirical Bayes methods. Biostatistics 8(1):118–127.
40. Leek JT, Johnson WE, Parker HS, Jaffe AE, Storey JD (2012) The sva package for re-moving batch effects and other unwanted variation in high-throughput experiments. Bioinformatics 28(6):882–883.
41. Bardou P, Mariette J, Escudié F, Djemiel C, Klopp C (2014) jvenn: an interactive Venn diagram viewer. BMC Bioinformatics 15:293.
42. Spinelli L, Carpentier S, Montañana Sanchis F, Dalod M, Vu Manh TP (2015) Bubble-GUM: automatic extraction of phenotype molecular signatures and comprehensive visualization of multiple Gene Set Enrichment Analyses. BMC Genomics 16(1):814. 43. Subramanian A, Kuehn H, Gould J, Tamayo P, Mesirov JP (2007) GSEA-P: a desktop
application for gene set enrichment analysis. Bioinformatics 23(23):3251–3253. 44. Baranek T, et al. (2012) Differential responses of immune cells to type I interferon
contribute to host resistance to viral infection. Cell Host Microbe 12(4):571–584. 45. Subramanian A, et al. (2005) Gene set enrichment analysis: a knowledge-based
ap-proach for interpreting genome-wide expression profiles. Proc Natl Acad Sci USA
102(43):15545–15550.
46. Vérollet C, et al. (2015) HIV-1 reprograms the migration of macrophages. Blood
125(10):1611–1622. IMMUNOLO GY AND INFLAMMATION PNAS