HAL Id: hal-00330062
https://hal.archives-ouvertes.fr/hal-00330062
Submitted on 30 Nov 2005
HAL is a multi-disciplinary open access
archive for the deposit and dissemination of
sci-entific research documents, whether they are
pub-lished or not. The documents may come from
teaching and research institutions in France or
abroad, or from public or private research centers.
L’archive ouverte pluridisciplinaire HAL, est
destinée au dépôt et à la diffusion de documents
scientifiques de niveau recherche, publiés ou non,
émanant des établissements d’enseignement et de
recherche français ou étrangers, des laboratoires
publics ou privés.
Distributed under a Creative Commons Attribution - NonCommercial| 4.0 International
License
ELF magnetospheric lines observed by DEMETER
Michel Parrot, F. Nemec, O. Santolik, Jean-Jacques Berthelier
To cite this version:
Michel Parrot, F. Nemec, O. Santolik, Jean-Jacques Berthelier. ELF magnetospheric lines observed
by DEMETER. Annales Geophysicae, European Geosciences Union, 2005, 23 (10), pp.3301-3311.
�10.5194/angeo-23-3301-2005�. �hal-00330062�
ELF magnetospheric lines observed by DEMETER
M. Parrot1, F. N˘emec2, O. Santol´ık2, and J. J. Berthelier3
1LPCE/CNRS, 3A Avenue de la Recherche Scientifique, 45071 Orl´eans cedex 2, France
2Charles University, Faculty of Mathematics and Physics, Prague, Czech Republic
3CETP, Observatoire de Saint Maur, 4 Avenue de Neptune, 94107 Saint Maur des Foss´es cedex, France
Received: 2 June 2005 – Revised: 14 September 2005 – Accepted: 16 September 2005 – Published: 30 November 2005
Abstract. The influence of man-made activity on the
iono-sphere may be very important. The effects induced by the Power Line Harmonic Radiation (PLHR) may change the natural wave activity and/or the ionospheric plasma com-ponents. One goal of the ionospheric satellite DEMETER launched in June 2004 is to study the ionospheric perturba-tions which could be related to this anthropogenic activity. As the first step, the paper presents Tram Lines (TL) which have been observed on board DEMETER with frequency in-tervals close to 50 Hz or 16 Hz 2/3 (the current frequency of the railways). When it is observable the frequency drift of these TL is very slow. It is shown that these events oc-cur during periods of strong or moderate magnetic activity. A wave propagation analysis indicates that the TL observed below the low cutoff frequency of the hiss which is simulta-neously present are coming from a region below the satellite. The conclusion is that these TL observed by DEMETER are produced by PLHR or radiation of railways lines.
Keywords. Ionosphere (Ionospheric disturbances; Wave
propagation; Active experiments)
1 Introduction
The Power Line Harmonic Radiation (PLHR) are the ELF and VLF waves radiated by electric power systems at the harmonic frequencies of 50 or 60 Hz. Evidence of PLHR propagation in the magnetosphere was first observed on the ground (Helliwell et al., 1975; Helliwell, 1979; Park and Helliwell, 1981; Matthews and Yearby, 1981; Yearby et al., 1983). Park (1977) observed ground-based PLHR during a magnetic storm. However, direct observations by satellites are rather rare and shown in few papers (Koons et al., 1978; Bell et al., 1982; Tomizawa and Yoshino, 1985; Parrot, 1994; Rodger et al., 1995). Many observations show that the lines
Correspondence to: M. Parrot
drift in frequencies. One must say that there is a controversy about the origin of these lines which are observed in space or on the ground because many of them are not separated by 50 or 60 Hz. They are called MLR (Magnetospheric Line Ra-diation) or TL, and their generation mechanism is not well determined, although it is most probably due to a nonlinear interaction between electrons and the coherent waves. In their study of ISIS2 data, Rodger et al. (1995) observed MLR and did not find a frequency correlation with 50 or 60 Hz, or multiples. It was the same for observations of MLR at Hal-ley Bay (Rodger et al., 1999, 2000a, 2000b). In a review paper concerning observations of PLHR and MLR emissions by ground-based experiments and satellites, Bullough (1995) discussed about the possibility that MLR are due to PLHR. There are indications that PLHR influences the atmosphere-ionospheremagnetosphere coupling. This problem requires serious attention because the electrical power consumption is always increasing in the world (Parrot and Zaslavski, 1996). Theoretical works have been done to explain these effects. Nonlinear interactions between electrons and PLHR can par-ticipate in the precipitation of electrons from the slot region in the radiation belts (Bullough et al., 1976; Tatnall et al., 1983). Molchanov et al. (1991) have shown that the main part of the PLHR energy dissipates in the lower ionosphere and modifies the ionospheric currents. Simulations have also been performed by Nunn et al. (1999) to explain ground ob-servations of PLHR and associated triggered emissions in Finland. Recently, Ando et al. (2002) analyzed the penetra-tion of PLHR in the presence of an ionosphere with a single ion and underlined the importance of the ion gyrofrequency relative to the wave frequency of this man-made emission.
The aim of this paper is to present events recorded by the ionospheric satellite DEMETER which was launched in June 2004. Section 2 shortly describes the wave experiment on board DEMETER. Four events showing ELF magneto-spheric lines are presented in Sect. 3. Analysis and discus-sions of these events are done in Sect. 4, whereas Sect. 5 presents conclusions.
3302 M. Parrot et al.: ELF magnetospheric lines observed by DEMETER
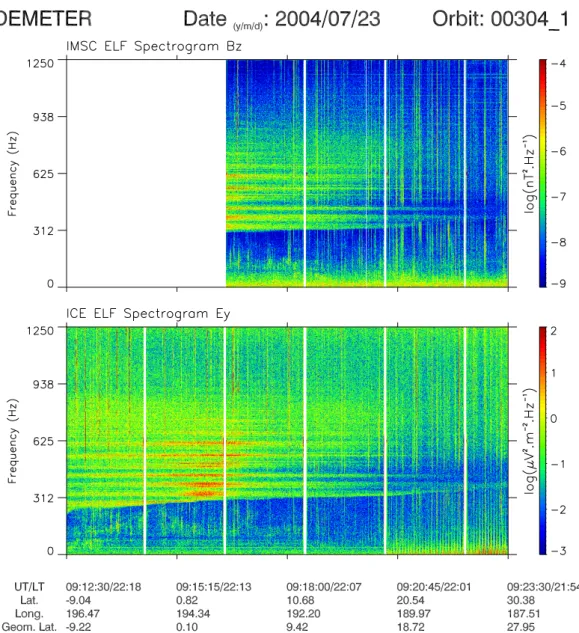
Fig. 1. Spectrograms of the magnetic component Bx(top panel) and Ey(bottom panel) recorded on 23 July 2004 (event 1). The intensity
of the emissions is color-coded according to the color scale on the right. The vertical white lines indicate a change in the mode of the experiment.
2 The experiment
DEMETER is a low-altitude satellite (710 km) with a polar orbit which measures electromagnetic waves all around the Earth, except in the auroral zones. The frequency range for the electric field is from DC up to 3.5 MHz, and for the mag-netic field from a few Hz up to 20 kHz. There are two sci-entific modes: a survey mode, where spectra of one elec-tric and one magnetic component are computed on board up to 20 kHz, and a burst mode, where waveforms of the 6 components of the electromagnetic field are recorded up to 1.25 kHz. The burst mode allows one to perform spectral analysis with a better frequency resolution and to determine propagation characteristic of the waves. There is an onboard calibration at 625 Hz which is activated at each mode change
and after every 4, 8 or 12 mn. Details of the wave experi-ment can be found in Parrot et al. (2005) and Berthelier et al. (2005). Data shown in this paper have been recorded dur-ing burst modes.
3 The data
3.1 Event 1 recorded on 23 July 2004
Figure 1 displays data recorded on 23 July 2004 between 09:12:30 UT and 09:23:34 UT by DEMETER during an equatorial crossing. The two panels represent spectrograms
of the magnetic component Bz(top) and the electric
compo-nent Ez (bottom) from 0 to 1250 Hz. Time and orbital
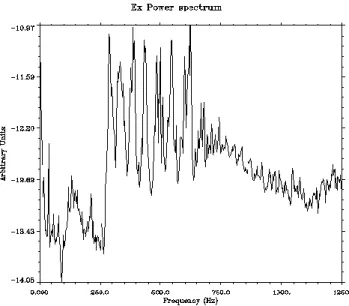
Fig. 2. Spectrum of the electric component Ex. The analysis is performed between 09:14:30 and 09:16:30 UT using a 1024 point-FFT
(1f=2.44 Hz).
3304 M. Parrot et al.: ELF magnetospheric lines observed by DEMETER
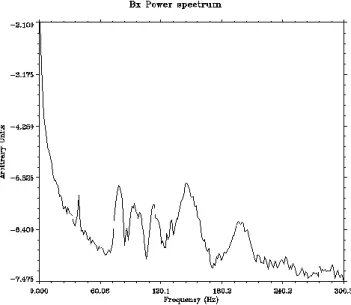
Fig. 4. Spectrum of the magnetic component calculated for the first forty seconds of Fig. 3.
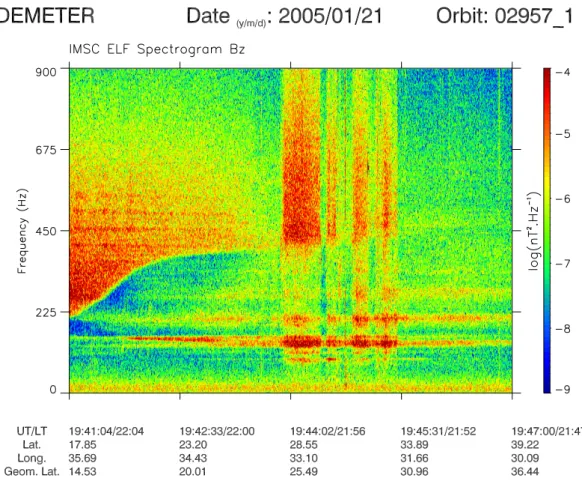
Fig. 5. Same as Fig. 1 but for the event recorded on 21 January 2005 (event 3).
been recorded in the Pacific Ocean close to the Kiribati Is-lands around the magnetic equator during a period of strong
magnetic activity (Kp=6). At this time, the satellite was still
during the commissioning phase and this is why a part of the magnetic data is missing in the top panel. The regular verti-cal white lines indicate changes in configuration for another experiment. Other vertical lines represent spherics. In both panels, a set of horizontal lines appears in a frequency range between 310 and 650 Hz. It is observed that these lines do not shift in frequency and that they have higher intensities when the satellite crosses the magnetic equator. Similar ob-servations are done for the other components of the electro-magnetic field. It appears that the main horizontal lines are in fact composed of many individual lines. All these lines ex-hibit a low cutoff frequency which is below the local proton gyrofrequency (see plots and explanation given in Sect. 4).
As this low cutoff frequency increases, some low frequency horizontal lines disappear with the time. In order to check the frequencies of these lines, an averaged spectrum calcu-lated between 09:14:30 and 09:16:30 UT is represented in Fig. 2. Seven harmonic lines are clearly observed and the first six are separated by 50 Hz, although they are not at ex-act multiples of 50 Hz. The center of the seventh line, which is broader in frequency, is at a little bit more than 50 Hz.
3.2 Event 2 recorded on 8 November 2004
Figure 3 is similar to Fig. 1 and corresponds to data recorded on 8 November 2004 between 07:23:35 and 07:27:00 UT when the satellite was above Iran and Iraq. It was the time of
the largest magnetic storm of the year, with Kp=9. A set of
Fig. 6. Enlarged spectrogram between 0 and 900 Hz related to the event shown in Fig. 5 but with the magnetic component Bz.
of the natural hiss emission. This cutoff frequency, which is below the proton gyrofrequency, decreases with the time. All other magnetic and electric components show the same fea-ture. A careful check of the spectra indicates that in fact there are two sets of lines: a set with thin lines and another with thick lines. The very thin line which is observed at 39 Hz has been identified as interference. The lines are very slightly drifting in frequency (∼1 Hz per 35 s). Figure 4 displays
the magnetic spectrum of the Bx component which was
ob-tained, taking into account the first forty seconds of the con-sidered time interval and a spectral analysis with a frequency resolution of 1.2 Hz. The frequencies of the peaks were eval-uated considering the half width at the half height of each peak. It gives peak frequencies at 78.0, 95.1, 114.3, 147.3, and 198.9 Hz, and, if we consider the first frequency interval as the unit bin, an average frequency interval is ∼17.2 Hz.
3.3 Event 3 recorded on 21 January 2005
Figure 5 is similar to Fig. 1 and corresponds to data recorded on 21 January 2005 between 19:41:04 and 19:48:30 UT. At this time the satellite was flying over Egypt, the Mediter-ranean sea, and Turkey. The magnetic activity was very high
with Kp=8. As in event 2, a set of horizontal lines can be
ob-served below the cutoff frequency. Their intensities increase
between 19:43:15 and 19:45:00 UT when waves ducted by density irregularities are observed.
Another set of lines can be distinguished at the beginning of the plot above the cutoff frequency, as in event 1. Their intensity is weak relatively to the other set. A more detailed spectrogram of these lines is given in Fig. 6 for the magnetic
component Bz. It is shown that the lines are separated by
50 Hz for the two sets of lines. As in event 1, the lines are not at an exact multiple of 50 Hz but slightly above (∼4 Hz). There is a broadening of the lines, which are close to 150 Hz and 200 Hz in the middle of the plot, and sidebands appear mainly at the time of the doctal waves.
3.4 Event 4 recorded on 23 January 2005
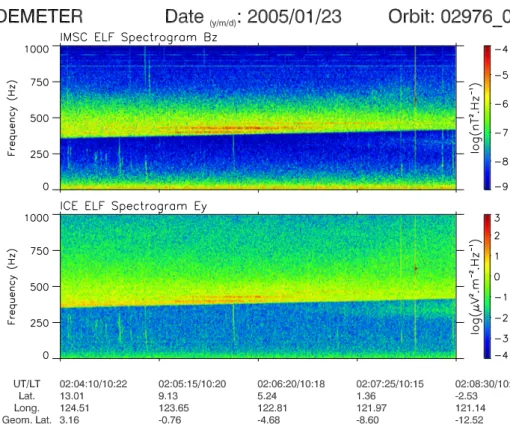
Figure 7 is similar to Fig. 1 and represents data recorded on 23 January 2005 between 02:04:10 and 02:08:30 UT dur-ing an equatorial crossdur-ing above the Indonesian Islands. The
magnetic activity was moderate with Kp=4. TL mixed with
natural hiss noise are detected above the cutoff frequency, as in event 1. Figure 8 displays a frequency zoom of these data
for the magnetic component Bz, and it is observed that the
intensity of the lines increases close to the magnetic equator crossing. As in event 1, the lines are split into several ones. On average, the frequency separation of the three main lines is ∼31.3 Hz.
3306 M. Parrot et al.: ELF magnetospheric lines observed by DEMETER
Fig. 7. Same as Fig. 1 but for the event recorded on 23 January 2005 (event 4).
Fig. 8. Enlarged spectrogram between 0 and 700 Hz related to the data shown in the top panel of Fig. 7.
4 Analysis and discussions
It is possible to determine the propagation characteristics of the observed waves during events 2, 3, and 4, which were recorded during a burst mode. The data need to be translated in a frame of reference linked to the Earth’s
magnetic field B0and for event 1, which has been recorded
during the commissioning phase, the attitude information is missing. The six components of the electromagnetic field are available, and a relevant software named PRASSADCO has been employed (Santol´ık, 2001). A preliminary version
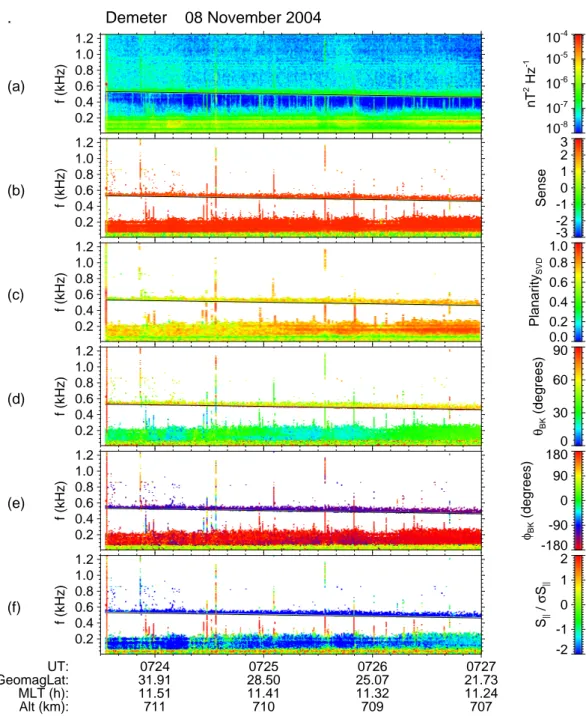
UT: 0724 0725 0726 0727 GeomagLat: 31.91 28.50 25.07 21.73 MLT (h): 11.51 11.41 11.32 11.24 Alt (km): 711 710 709 707 (a) 10-8 10-7 10-6 10-5 10-4 nT 2 Hz -1 0.2 0.4 0.6 0.8 1.0 1.2 f (kHz) (b) -3 -2 -1 0 1 2 3 Sense 0.2 0.4 0.6 0.8 1.0 1.2 f (kHz) (c) 0.0 0.2 0.4 0.6 0.8 1.0 Planarity SVD 0.2 0.4 0.6 0.8 1.0 1.2 f (kHz) (d) 0 30 60 90 θBK (degrees) 0.2 0.4 0.6 0.8 1.0 1.2 f (kHz) (e) -180 -90 0 90 180 φBK (degrees) 0.2 0.4 0.6 0.8 1.0 1.2 f (kHz) (f) -2 -1 0 1 2 S|| / σ S|| 0.2 0.4 0.6 0.8 1.0 1.2 f (kHz)
Fig. 9. Wave analysis of the event 2. (a) spectrogram of one magnetic component, (b) sense of polarization, (c) planarity, (d) and (e) polar and azimuthal angles of the wave vector with the Earth’s magnetic field B0, (f) projection of the Poynting vector onto B0(see text for explanation). The geophysical parameters at the bottom are the Universal Time (UT), the geomagnetic latitude, the Magnetic Local Time (MLT) and the altitude.
of this software has been used to process the data of the FREJA wave experiment (Santol´ık and Parrot, 1999). But it was specially developed for the data analysis of the spectral matrices computed by the STAFF experiment on board CLUSTER (see, for example, Parrot et al., 2003; Santol´ık et al., 2003a), and it has been adapted to process the DEMETER data (Santol´ık et al., 2005).
The TL observations can be divided in two parts, depend-ing on their occurrence below or above the low frequency
cutoff of the hiss, which is simultaneously observed with the TL. The TL of events 1 and 4 are observed above, TL of event 2 are observed below, and for event 3, two TL sets are observed, one is above and the other below.
Figures 9, 10, and 11 are related to the wave propagation analysis of the last 3 events. They all display the same in-formation. The first panel shows the sum of power spectral densities of the three magnetic components. The black line (also shown in the other panels) indicates the local proton gyrofrequency given by a magnetic field model. It can be
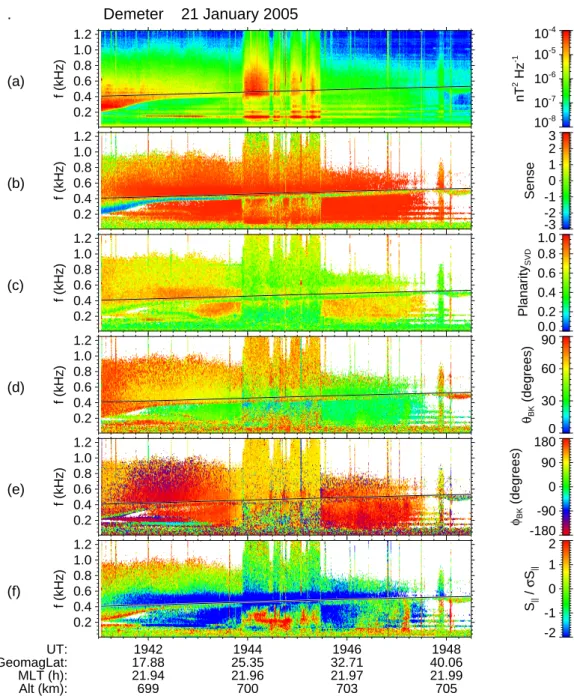
3308 M. Parrot et al.: ELF magnetospheric lines observed by DEMETER . Demeter 21 January 2005 UT: 1942 1944 1946 1948 GeomagLat: 17.88 25.35 32.71 40.06 MLT (h): 21.94 21.96 21.97 21.99 Alt (km): 699 700 703 705 (a) 10-8 10-7 10-6 10-5 10-4 nT 2 Hz -1 0.2 0.4 0.6 0.8 1.0 1.2 f (kHz) (b) -3 -2 -1 0 1 2 3 Sense 0.2 0.4 0.6 0.8 1.0 1.2 f (kHz) (c) 0.0 0.2 0.4 0.6 0.8 1.0 Planarity SVD 0.2 0.4 0.6 0.8 1.0 1.2 f (kHz) (d) 0 30 60 90 θBK (degrees) 0.2 0.4 0.6 0.8 1.0 1.2 f (kHz) (e) -180 -90 0 90 180 φBK (degrees) 0.2 0.4 0.6 0.8 1.0 1.2 f (kHz) (f) -2 -1 0 1 2 S|| / σ S|| 0.2 0.4 0.6 0.8 1.0 1.2 f (kHz)
Fig. 10. Same presentation as in Fig. 9 but for the event 3.
seen (mainly for the events 3 and 4) that the local proton gyrofrequency is not the cutoff frequency of the hiss which is observed simultaneously with the TL. The cutoff is at the multi-ion cutoff frequency (see Santol´ık and Parrot, 1999 and references therein). The second panel displays the sense of polarization in the plane perpendicular to the field line es-timated by the method of Santol´ık et al. (2001). A value larger than +1 (red color) corresponds to a right-hand polar-ization. In this panel and in the following ones, the param-eters are color-coded only if the intensity of the magnetic
field is larger than 10−7nT2/Hz. The third panel is related to
the planarity obtained by the Singular Value Decomposition (SVD) method (Santol´ık et al., 2003b). A value close to 1 corresponds to the presence of a single plane wave. The two
following panels are related to the direction of propagation of the waves. They give the polar and the azimuth angles
between the k vector and the Earth’s magnetic field B0,
re-spectively. Both angles are calculated using the SVD method (Santol´ık et al., 2003b). The last panel is related to the
esti-mation of the component of the Poynting vector Sk, which is
the projection of the Poynting vector onto B0, and σ Skis a
normalisation factor which corresponds to the standard
devi-ation of Skdue to the spectral analysis. A positive value close
to 2 indicates a direction of propagation which is in the di-rection of the magnetic field, whereas a negative value close to –2 indicates a direction which is opposite to the magnetic field. More details about this wave analysis can be found in Santol´ık and Parrot (1999) and references therein.
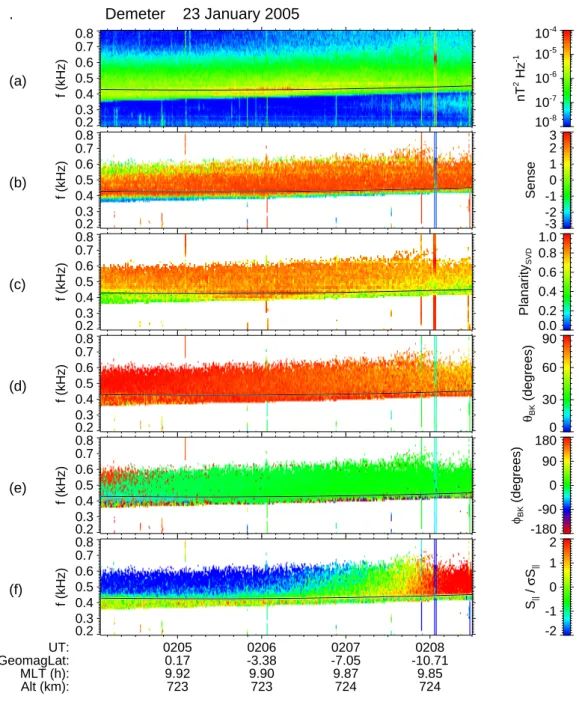
UT: 0205 0206 0207 0208 GeomagLat: 0.17 -3.38 -7.05 -10.71 MLT (h): 9.92 9.90 9.87 9.85 Alt (km): 723 723 724 724 (a) 10-8 10-7 10-6 10-5 10-4 nT 2 Hz -1 0.2 0.3 0.4 0.5 0.6 0.7 0.8 f (kHz) (b) -3 -2 -1 0 1 2 3 Sense 0.2 0.3 0.4 0.5 0.6 0.7 0.8 f (kHz) (c) 0.0 0.2 0.4 0.6 0.8 1.0 Planarity SVD 0.2 0.3 0.4 0.5 0.6 0.7 0.8 f (kHz) (d) 0 30 60 90 θBK (degrees) 0.2 0.3 0.4 0.5 0.6 0.7 0.8 f (kHz) (e) -180 -90 0 90 180 φBK (degrees) 0.2 0.3 0.4 0.5 0.6 0.7 0.8 f (kHz) (f) -2 -1 0 1 2 S|| / σ S|| 0.2 0.3 0.4 0.5 0.6 0.7 0.8 f (kHz)
Fig. 11. Same presentation as in Fig. 9 but for the event 4.
The TL which are observed below the cutoff frequency in events 2 and 3 have similar properties concerning the prop-agation characteristics. The sense of polarization indicates that the waves are right-hand polarized. They propagate up-wards (opposite to the magnetic field in the Northern Hemi-sphere) with an angle relative to the Earth’s magnetic field of
around 30◦.
The TL which are observed above the proton gyrofre-quency at the beginning of event 3 are very similar to those from event 1. The TL intensity is certainly vanishing after an increase around the magnetic equator. At this time, waves which are recorded in the survey mode (not shown) present a large intensity in this frequency range but the frequency resolution is too poor to distinguish TL.
Events 1 and 4 are similar in the sense that they exhibit an important growth close to the magnetic equator which is the favoured zone for wave-particle interactions. This is further evidence that these waves may influence the natural mecha-nisms in the ionosphere and could contribute to the precipita-tion of particles from the radiaprecipita-tion belts. The wave analysis parameters of event 4 are displayed in Fig. 11. The sense of polarization indicates the presence of right-hand polarized waves. These waves propagate nearly perpendicular to B0. During event 4, the color which indicates the direction of the Poynting vector changes when the satellite crosses the mag-netic equator. It signifies that the direction of the hiss and of the TL, which are observed at frequencies above the cut-off frequency, is upgoing.
3310 M. Parrot et al.: ELF magnetospheric lines observed by DEMETER A question is related to the origin of the frequency
inter-vals between the lines which are observed during these four events. The 50-Hz electric current can be found in many parts of the world, including the Pacific Islands. The other frequency interval can be related to the electrified railways. Many countries have standardized on 15 kV 16 2/3Hz (one-third the normal main frequency) system as the standard for low-frequency, high voltage electrification. All harmonics are not often observed depending on the production system which is used (Bullough, 1995). Then in event 4 the lines whose frequency interval practically equals two times the fundamental frequency may be due to the railways, as for event 2.
Why are the TL not observed at exact harmonics of 50 Hz or 16 2/3 Hz, and why are any sidebands observed? The frequency shift can be explained by a whistler mode insta-bility during a gyroresonance interaction between the coher-ent waves and the particles in an inhomogeneous medium. The generation mechanism of sidebands may be due to the scattering from ionospheric irregularities which are enhanced by the magnetic activity. All these processes have been al-ready discussed in the past (see, for example, Brinca (1972); Matthews et al. (1984); Bell (1985); Nunn (1986); Bell and Ngo (1988); Shklyar et al. (1992) and references therein).
Is there a possibility to attribute these ionospheric tram
lines to natural emissions? One hypothesis is related to
waves at harmonics of ion gyrofrequencies (Liu et al., 1994) which could be produced at much higher L values. These waves could propagate since the source region and could be observed at the altitude of the satellite. But in such a case the frequency drifting of the lines would be much more impor-tant than it is observed.
5 Conclusions
DEMETER is a low orbiting satellite devoted to the study of ionospheric perturbations induced by geophysical activi-ties (earthquakes, volcanoes, thunderstorms, etc.) and man-made activities (VLF transmitters, PLHR, etc.). Therefore, it surveys the global Earth electromagnetic environment at ionospheric altitudes. When enough data is registered, geo-graphic maps of wave emissions at various frequencies will be produced, in order to compare with regions of high indus-trial activity and to check if there is some anthropogenic in-fluence in the ionosphere. At this time, this paper is related to four event studies where TL have been observed. The com-mon features of these observations are:
1. The frequency intervals between the TL are close to 50 Hz (the usual electric current system) or to 16 2/3 Hz (the current frequency used for railways).
2. The frequency drift of the TL is very slow.
3. They are observed during periods of moderate or intense magnetic storms. This is similar to observations per-formed by Koons et al. (1978) with the S3-3 satellite or by Park (1977) with a ground-based experiment.
4. The wave propagation analysis indicates that the TL be-low the be-low cutoff frequency of the natural emissions simultaneously observed are coming from a region be-low the satellite.
5. The intensity of the TL above the low cutoff frequency of the natural emissions is enhanced close to the mag-netic equator. This is an indication that they interact with particles.
Therefore, concerning these observations on DEMETER, there is evidence to suggest a link between TL and PLHR or radiation due to railways lines. A systematic search for TL with harmonics at 50 and 60 Hz has been started with an automatic software running on the DEMETER database and results will be presented soon.
Acknowledgements. Topical Editor M. Pinnock thanks two referees for their help in evaluating this paper.
References
Ando, Y., Hayakawa, M., and Molchanov, O. A.: Theoreti-cal analysis on the penetration of power line harmonic ra-diation into the ionosphere, Radio Science, 37(6), 1093, doi:10.1029/2001RS002486, 2002.
Bell, T. F., Luette, J. P., and Inan, U. S.: ISEE 1 observations of VLF line radiation in the Earth’s magnetosphere, J. Geophys. Res., 87, 3530–3536, 1982.
Bell, T. F.: High-amplitude VLF transmitter signals and associated sidebands observed near the magnetic equatorial plane on the ISEE 1 satellite, J. Geophys. Res., 90, 2792–2806, 1985. Bell, T. F. and Ngo, H. D.: Electrostatic waves stimulated by
coher-ent VLF signals propagating in and near the inner radiation belt, J. Geophys. Res., 93, 2599–2618, 1988.
Berthelier, J. J., Godefroy, M., Leblanc, F., Malingre, M., Men-vielle, M., Lagoutte, D., Brochot, J. Y., Colin, F., Elie, F., Legen-dre, C., Zamora, P., Benoist, D., Chapuis, Y., and Artru, J.: ICE, The electric field experiment on DEMETER, Planet. Space Sci., submitted, 2005.
Brinca, A. L.: Whistler side-band growth due to nonlinear wave-particle interaction, J. Geophys. Res., 77, 3508–3523, 1972. Bullough, K., Tatnall, A.R.L., and Denby, M.: Man-made ELF/VLF
emissions and the radiation belts, Nature, 260, 401, 1976. Bullough, K.: Power Line Harmonic Radiation: Sources and
Envi-ronmental Effects in: Handbook of Atmospheric Electrodynam-ics, edited by: Volland, H., vol. 2, CRC Press, Boca Raton, 291– 332,1995.
Helliwell, R. A.: Effects of power line radiation into the magneto-sphere, 27, in: Wave Instabilities in Space Plasmas, edited by: Palmadesso, P. J. and Papadopoulos, K., D. Reidel Publishing Co., 27–36, 1979.
Helliwell, R. A., Katsufrakis, J. P., Bell, T. F., and Raghuram, R.: VLF line radiation in the Earth’s magnetosphere and its associ-ation with power system radiassoci-ation, J. Geophys. Res., 80, 4249– 4258, 1975.
Koons, H. C., Dazey, M. H., and Edgar, B. C.: Satellite observation of discrete VLF line radiation within transmitter-induced ampli-fication bands, J. Geophys. Res., 83, 3887–3889, 1978.
emission with discrete spectra near harmonics of oxygen gyrofre-quency during magnetic storm, Geophys. Res. Lett., 21(3), 225– 228, 1994.
Matthews, J. P. and Yearby, K.: Magnetospheric VLF line radiation observed at Halley, Antartica, Planet. Space Sci., 29, 97–106, 1981.
Matthews, J. P., Omura, Y., and Matsumoto, H.: Some PLHR phe-nomena and their explanation, in: International Wroclaw Sym-posium on Electromagnetic compatibility, Technical University of Wroclaw, Poland, 55–59, 1984.
Molchanov, O. A., Parrot, M., Mogilevsky, M. M., and Lefeuvre, F.: A theory of PLHR emissions to explain the weekly variations of ELF data observed by a low-altitude satellite, Ann. Geophys., 9, 669–680, 1991.
Nunn, D., Manninen, J., Turunen, T., Trakhtengerts, V., and Erokhin, N.: On the nonlinear triggering of VLF emissions by power line harmonic radiation, Ann. Geophys., 17, 79–94, 1999, SRef-ID: 1432-0576/ag/1999-17-79.
Nunn, D.: A nonlinear theory of sideband stability in ducted whistler mode waves, Planet. Space Sci., 34, 429–451, 1986. Park, C. G.: VLF wave activity during a magnetic storm: a case
study of the role of power line radiation, J. Geophys. Res., 82 (22), 3251–3260, 1977.
Park, C. G. and Helliwell, R. A.: Power line radiation in the mag-netosphere, Adv. Space Res., 1, 423–437, 1981.
Parrot, M.: Observations of PLHR by the low-altitude AUREOL-3 satellite, J. Geophys. Res., 99, 3961–3969, 1994.
Parrot, M. and Zaslavski, Y.: Physical mechanisms of man made in-fluences on the magnetosphere, Surveys in Geophysics, 17, 67– 100, 1996.
Parrot, M., Santol´ık, O., Cornilleau-Wehrlin, N., Maksimovic, M., and Harvey, C. C.: Source location of chorus emissions observed by Cluster, Ann. Geophys. 21, 473–480, 2003.
Parrot, M., Benoist, D., Berthelier, J. J., Ble¸cki, J., Chapuis, Y., Colin, F., Elie, F., Fergeau, P., Lagoutte, D., Lefeuvre, F., Legen-dre, C., L´evˆeque, M., Pinc¸on, J. L., Poirier, B., Seran, H. C., and Zamora, P.: The magnetic field experiment IMSC and its data processing on board DEMETER: scientific objectives, descrip-tion and first results, Planet. Space Sci., in press, 2005.
Rodger, C. J., Thomson, N. R., and Dowden, R. L.: VLF line ra-diation observed by satellite, J. Geophys. Res., 100(A4), 5681– 5689, 1995.
Magnetospheric line radiation observations at Halley, Antartica, J. Geophys. Res., 104 (A8), 17 441–17 447, 1999.
Rodger, C. J., Clilverd, M. A., Yearby, K. H., and Smith, A. J.: Temporal properties of magnetospheric line radiation, J. Geo-phys. Res., 105(A1), 329–336, 2000a.
Rodger, C. J., Clilverd, M. A., Yearby, K., and Smith, A. J.: Is magnetospheric line radiation man made?, J. Geophys. Res., 105, 15 981–15 990, 2000b.
Santol´ık, O. and Parrot, M.: Case studies on the wave propagation and polarization of ELF emissions observed by Freja around the local proton gyrofrequency, J. Geophys. Res., 104, 2459–2475, 1999.
Santol´ık, O.: Propagation Analysis of Staff-SA Data with Co-herency Tests, LPCE/NTS/073.C, Lab. Phys. Chimie Envi-ron./CNRS, Orl´eans, France, 2001.
Santol´ık, O., Lefeuvre, F., Parrot, M., and Rauch, J. L.: Complete wave-vector directions of electromagnetic emissions: Applica-tion to INTERBALL-2 measurements in the nightside auroral zone, J. Geophys. Res., 106, 13 191–13 201, 2001.
Santol´ık, O., Gurnett, D. A., Pickett, J. S., Parrot, M., and Cornilleau-Wehrlin, N.: Spatio-temporal structure of storm-time chorus, J. Geophys. Res., 108(A7), 1278, doi:10.1029/2002JA009791, 2003a.
Santol´ık, O., Parrot, M., and Lefeuvre, F.: Singular value decompo-sition methods for wave propagation analysis, Radio. Sci., 38(1), 1010, doi:10.1029/2000RS002523, 2003b.
Santol´ık, O., N˘emec, F., Parrot, M., Lagoutte, D., and Madrias, L.: Analysis methods for multi-component wave measurements on board the DEMETER spacecraft, Planet. Space Sci., in press, 2005.
Shklyar, D. R., Nunn, D., Smith, A. J., and Sazhin, S. S.: An inves-tigation into the nonlinear frequency shift in magnetospherically propagated VLF pulses, J. Geophys. Res., 97(A12), 19 389– 19 402, 1992.
Tatnall, A. R. L., Matthews, J. P., Bullough, K., and Kaiser, T. R.: Power-line harmonic radiation and the electron slot, Space Sci. Rev., 35, 139–173, 1983.
Tomizawa, I. and Yoshino, T.: Power line radiation observed by the satellite OHZORA, J. Geomagn. Geoelectr., 37, 309–327, 1985. Yearby, K. H., Smith, A. J., Kaiser, T. R., and Bullough, K.: Power line harmonic radiation in Newfoundland, J. Atmos. Terr. Phys, 45, 409–419, 1983.