Costs of Multiplicity in Public Health Supply Chains in Burundi
Jeet N. Shah
B.S. in Electrical Engineering Georgia Institute of Technology, 2003
& MASSACHUSETTS INSTfTUTE OF TECHNOLOGY
LIBRARIES
Trevor N. Thomas B.S. Industrial Engineering Morgan State University, 2006Submitted to the Engineering Systems Division in Partial Fulfillment of the Requirements for the Degree of
Master of Engineering in Logistics
at the
Massachusetts Institute of Technology
June 2009 ARCNES
© 2009 Jeet N. Shah & Trevor N. Thomas. All rights reserved.
The authors hereby grant to MIT permission to reproduce and to distribute publicly paper and electronic copies of this document in whole or in part.
Signatures of Authors.... ...
Master of Engineering in Logistics Pr am, Engineering Systems Division
/
/
May 8,2 OCertified by ... ... Dr. Jarrod Goentzel Executive Director, Masters of Engineering in Logistics Program
i ) /7/ Thesis Supervisor
Accepted by... ...
Prof. Yossi Sheffi
V/ Professor, Engineering Systems Division
Professor, Civil and Environmental Engineering Department
Director, Center for Transportation and Logistics Director, Engineering Systems Division
Costs of Multiplicity in Public Health Supply Chains in Burundi
by
Jeet N. Shah and Trevor N. Thomas Submitted to the Engineering Systems Division in partial fulfillment of the requirements for the degree of
Master of Engineering in Logistics
Abstract
As the public health system in Burundi transitions from a mode of emergency humanitarian response to a sustainable operation, there is a significant opportunity to reduce costs by eliminating the duplication of functions served by multiple
parties. Numerous multi-lateral agencies and NGOs play a significant role in the public health supply chain. Additionally, Burundi has several vertical programs focused on specific communicable diseases such as HIV/AIDS, malaria and
tuberculosis, which have parallel distribution systems. This thesis assesses the costs of multiplicity in the public health supply chain in Burundi, focusing on identifying the factors contributing to multiplicity and evaluating their cost impacts. We specifically analyze the transportation and inventory costs under four different distribution scenarios in the context of a proposed health sector structural reform while using the current system as a baseline. The analysis also discusses several other relevant factors that affect the costs of multiplicity. The research suggests that the Ministry of Health in Burundi can reduce costs, and improve availability of drugs by shifting from a pickup mode to a delivery mode of distribution, sharing assets between the central procurement agency and vertical programs, and improving the cash flow in the system.
Thesis Supervisor: Dr. Jarrod Goentzel
Acknowledgement
The authors would like to sincerely thank our advisor, Dr. Jarrod Goentzel, for his invaluable guidance and support throughout this process. Jarrod invested a great deal of time and effort into this thesis and contributed extensively throughout. We would also like to thank Dr. Prashant Yadav for the guidance he has provided.
Emeline Saunier from the United Kingdom Department for International Development (DFID) also played a vital role in our research. Emeline was instrumental in facilitating data collection through surveys and went to great lengths to ensure that our experience in Burundi was as fruitful as possible.
Similarly, the Ministry of Health (MOH) team in Burundi, specifically Armella Mukorako, and World Health Organization (WHO) team, particularly Serge Barbereau and Donatien Bigirimana, made this research possible by hosting us, arranging our aggressive interview schedule, facilitating meetings, and providing us with valuable insights. We are grateful for the support we have received from DFID, Burundi MOH and WHO. Finally, we would like to thank our friend, Alain
Nduwayezu, who provided transportation, and helped to make our visit to Burundi comfortable and enjoyable.
Table of Contents
Abstract... ... 2 Acknowledgement ... 3 List of Figures ... 6 List of Acronyms... ... 8 1 Introduction ... ... 9 1.1 Burundi Overview ... 101.2 Design of the Public Health System in Burundi ... .... 11
1.3 Operation of the Public Health System in Burundi ... 14
1.4 Proposed Health District Reform in Burundi ... .... . 17
1.5 Problem Definition... 18
1.6 Literature Review ... 19
2 M eth o d s ... 2 1 2.1 Current Province-Based System - ... 21
2.1.1. Scenario 1: Pick-up Mode -... ... 22
2.1.2. Scenario 2: Delivery Mode - ... ... 23
2.2 Reformed District-Based System -... ... 23
2.2.1. Scenario 3: Pick-up Mode -... ... 24
2.2.2. Scenario 4: Delivery Mode- ... ... 25
3 A n aly sis ... 2 6 3.1 Cost Model for Pick-up mode -. ... ... 27
3.2 Delivery Cost Model - ... 33
3.3 Analyzing transportation costs for 4 scenarios:... ... 37
3.4 Analysis of Current System -... 37
3.4.1. Scenario 1: Pick-up Mode -... ... 37
3.4.2. Scenario 2: Delivery Mode - ... ... 39
3.5 Analysis of Reformed System -... ... 44
3.5.1. Scenario 3: Pick-up Mode -... ... 45
3.5.2. Scenario 4: Delivery Mode - ... 46
3.6 Transportation Summary: ... ... 49
3.7 Extending the transportation analysis to the Health Centers:... 51 4
3.8 Inventory D iscussion: ... 53
3.8.1. Scenario 1 - Province-Based System in Pick-Up Mode:... 53
3.8.2. Scenario 2 -Province-Based System in Delivery Mode: ... 54
3.8.3. Scenario 3 - District-Based System in Pick-Up Mode: ... 55
3.8.4. Scenario 4 - District-Based System in Delivery Mode: ... 56
3.8.5. Inventory Summary: ... 57
3.9 Other Supply Chain Considerations: ... ... 57
3.9.1. Increasing Replenishment Frequencies: ... . 58
3.9.2. Inventory Risk Pooling: ... 59
3 .9 .3 . C ash flow : ... 6 0 3.9.4. Asset utilization: ... 61
3.9.5. Transport Infrastructure: ... 62
4 Conclusions ... 64
4.1 Recommendations for Burundi ... 64
4.2 Areas for further research ... 68
5 Bibliography / References ... 69 6 A p p en d ices ... 7 1
List of Figures
Figure 1. Location of Burundi ... 10
Figure 2. Structure of the province-based public health system in Burundi... 12
Figure 3. Structure of the province-based public health system in Burundi... 17
Figure 4. Structure of the province-based Primary Distribution Channel of the public health system in B urundi ... 21
Figure 5. Structure of the district-based Primary Distribution Channel of the public health system in Burundi ... 24
Figure 6. Number of trips for picking up drugs from CAMEBU and private pharm acies, by province. ... 28
Figure 7. Trips by province using a hired truck or BPS vehicle... . 29
Figure 8. Costs for hiring a truck ... ... 30
Figure 9. Preliminary regression of vehicle costs as a function of distance ... 31
Figure 10. Revised regression vehicle costs as a function of distance ... 31
Figure 11. Vehicle costs as a function of distance ... ... 32
Figure 12. Correlation between Trip Distance and Duration ... . 34
Figure 13. Components of the delivery cost model ... ... 36
Figure 14. Province Based System with Pick-Up Strategy... 38
Figure 15. Province Based Structure with Delivery Strategy ... 40
Figure 16. Variation of the total annual costs of delivery with a change in transportation rate. ... 43
Figure 17. Variation of total annual costs of delivery with a change in per diem rate. ... ... 44 4 4 Figure 18. District Based System with Pick-Up Strategy... 45
Figure 19. District Based System with Delivery Strategy... ... 47
Figure 20. Comparison of total annual transportation costs for the current and reformed system operating in pick-up and delivery modes... 51
List of Tables
Table 1. Number of trips made by the BPSs to CAMEBU in 2006 and 2007 ... 16
Table 2. Transport costs by mode and province... .... ... 29
Table 3. Transportation costs of UNDP deliveries ... ... 33
Table 4. Range of trip distances and corresponding duration ... 35
Table 5. Total annual costs of pick-up from CAMEBU in the current system... 39
Table 6. Clusters of provinces for delivery to BPS ... ... 41
Table 7. Total annual costs of delivery in the current system using UNDP rates ... 41
Table 8. Total annual costs of delivery in the current system... 42
Table 9. Annual transport costs of pick-up in the reformed system... 46
Table 10. Quarterly vehicle costs for delivery in the reformed district-based system. ... ... 4 8 Table 11. Total annual costs of delivery in the reformed district-based system... 49
Table 12. Total annual transportation costs for the current and reformed system operating in pick-up and delivery modes ... ... 50
List of Acronyms
IACT Artemisinin-based Combination Treatment AIDS Acquired Immune Deficiency Syndrome ARV Anti-retroviral
BDS Bureau District de Sante or District Health Bureau BPS Bureau Provincial de Sante or Provincial Health Bureau CAMEBU Central d'Achat des Midicaments de Burundi
Department of Pharmacies, Medicines and Laboratories or Direction Nationale de la Pharmacie, Mddicaments et Laboratoires
FBU Franc Burundais or Burundian Francs
GAVI Global Alliance for Vaccines and Immunization GDP Gross Domestic Product
HIV Human Immunodeficiency Virus IMR Infant Mortality Rate
MDG Millennium Development Goals MOH Ministry of Health
MSF Mddecins sans Frontieres
NGO Non-Governmental Organization
United Nations Office for the Coordination of Humanitarian OCHA
Affaires
PNLT Programme National de Lutte contre la Lepre et la Tuberculose PSI Population Services International
TB Tuberculosis
UN United Nations
UNDP United Nations Development Program UNICEF United Nations Children's Fund
USAID United States Agency for International Development
WB World Bank
WHO World Health Organization
1 Introduction
Numerous African nations face significant challenges providing healthcare to the public. Increasing levels of the population infected with HIV/AIDS, malaria,
tuberculosis and communicable illnesses, the lack of infrastructure and the high cost of pharmaceuticals are common problems inhibiting sufficient medical supply to patients. Many African Governments have sought external support from multiple non-governmental organizations (NGOs) to supply and distribute medical supplies. Ironically, this dependency on multiple parties to provide certain medical supply functions can inhibit the supply of drugs to patients due to inefficiencies resulting from redundancy. These inefficiencies, or costs of multiplicity, inflate the price of medical supply in Africa.
The Republic of Burundi has supplemented its medical supply function with the resources of multiple NGOs that work together to supply health care to over
8,000,000 citizens. Partnering with the Ministry of Health (MOH) of the Republic of Burundi, the United Kingdom's Department for International Development (DFID), and the World Health Organization (WHO), this study investigates the costs of multiplicity in public health supply chain in the Republic of Burundi. Specifically, this study quantifies the costs of multiplicity in distribution from the central medical store, and proposes recommendations that could decrease supply chain costs in the context of a proposed health sector structural reform.
1.1 Burundi Overview
The Republic of Burundi is a land-locked East African Nation bordered by Rwanda to the North, The Democratic Republic of Congo to the West, and Tanzania to the East and South as displayed in Figure 1 below. Burundi is divided into 17 provinces (see map in Appendix 1) and has a population of approximately 8,000,000 according to 2008 estimates.
Figure 1. Location of Burundi
Politically, Burundi has been characterized by frequent conflicts since 1962; a civil war between two conflicting parties recently subsided with the election of Pierre Nkurunziza. However, the effect of multiple conflicts has left Burundi with a highly impoverished population, and health indicators reveal that average health levels are below Sub-Saharan averages (Word Bank 2001). Due to these issues, multiple NGOS, governments and multilateral agencies have intervened to supply
health services including drug distribution. In 2007, the WHO, in association with the Ministry of Health in Burundi created a mapping of the different stakeholders involved with financing, procurement, and distribution in the public health system in Burundi as illustrated in Appendix 2.
The combined efforts of these multiple organizations have sought to provide drugs mainly for communicable diseases such as Malaria, HIV/AIDS, and
Tuberculosis which are the main causes of mortality in the region (World Bank 2001). Essential drugs are currently supplied through the Public Health system in Burundi.
1.2 Design of the Public Health System in Burundi
The public health system in Burundi is comprised of three levels. At the central level, is the Ministry of Health, which creates strategy, sets policy, and coordinates administration for the public health system. The Central Procurement Agency or Central d'Achat des Midicaments de Burundi (CAMEBU) is located in Bujumbura and is responsible for procuring drugs and supplies for the public sector. The
intermediate level is composed of the Provincial Health Bureaus or Bureau
Provincial de Sant6 (BPSs), who support the public health centers or Centre de Santd (CDSs) in their provinces. The level at which patients are served is made up of
health centers and hospitals that interface with patients. The 3 levels of the public health system including what we define as the Primary Distribution Channel (PDC)
-which is comprised, of CAMEBU at the central level, BPSs at the province level and health centers at the service level - are illustrated in Figure 2 below.
Level 1
(Central)
EA
Level 3Hoptl
D
(Service)
- Ub
I
S -DCS (-p 4-' 3 -o -(U -a'Figure 2. Structure of the province-based public health system in Burundi
Central Procurement Agency (CAMEBU)
CAMEBU procures and maintains a stock of essential medicines and supplies and also serves as a storage space for some of the vertical programs for specific diseases. CAMEBU does not deliver the drugs. Instead the BPSs and hospitals come to
CAMEBU to pick up the drugs and supplies they need. CAMEBU recently installed an information technology system (Sage) to record transaction data for the sales of drugs and supplies whereas the other levels of the system still maintain paper-based records.
Provincial Health Bureau (BPS)
The BPSs pick-up drugs from CAMEBU and serve as an intermediate stocking point for the health centers in their province. They are scheduled to visit CAMEBU once per quarter. The BPSs estimate the demand for the health centers in their province and place their order at CAMEBU by filling out an order form displayed in Appendix 3. The BPSs pay the costs of hiring a vehicle for the trips to CAMEBU (if one is needed) while the MOH covers the cost of fuel. The BPSs are required to pay for the drugs they get from CAMEBU; however, they can get the materials on credit under the MOH account if they don't have money. In this case, the Ministry of
Finance would reimburse CAMEBU for the amount of drugs given to the BPS on credit.
Health Center (CDS)
The public health centers pick up drugs and supplies from the BPSs on a monthly basis. They place their orders at the BPS using an order form similar to the one used by the BPSs and the order is supposed to be fulfilled from materials the BPS has in stock. The health centers typically hire a car or taxi for the trip and they have to bear the costs of hiring the vehicle. The health centers are supposed to pay the BPSs for the drugs and supplies within one month of the date of sale. The intent is to allow the health centers to recover the costs for the drugs and supplies by selling to their patients before having to pay the BPS for the materials. The mission-based health
centers are also permitted to procure materials through the public health system, however, they purchase drugs and supplies directly from CAMEBU as needed.
Hospitals
The hospitals in Burundi source their drugs and supplies from CAMEBU as well as private sector pharmacies. They operate autonomously and have the freedom to get materials through the private sector if they choose to since they regularly require drugs, which are not on the Essential Medicines List as well as specialty supplies. The hospitals typically use their own vehicles to pick up drugs and supplies as needed and they bear the full costs of transport.
1.3 Operation of the Public Health System in Burundi
Since the hospitals operate autonomously, our research is focused on what we describe as the Primary Distribution Channel (PDC) in the public health system. Through interviews with several people at different levels and observations during our visit to Burundi we learned that the PDC operates quite differently in practice than intended by design. The following discussion highlights these differences through a description of the system operation from an empirical and anecdotal perspective.
According to the several stakeholders we interviewed, frequent stock outs, and partial order fulfillments are a common occurrence. When health center's request
drugs, they are not always available at the BPS, so they occasionally purchase drugs from private pharmacies or return to the BPS more frequently than intended by design, to obtain partial replenishments of required drugs.
Similarly, the BPSs rarely get all the drugs and supplies they need from CAMEBU to fulfill the quarterly demand of the CDSs they serve, so they frequently return to CAMEBU to obtain portions of orders as drugs become available. In the event that drugs are not available at CAMEBU, BPSs often buy them from private sector wholesale pharmacies. In this case, the BPSs need to get permission from the
Department of Pharmacies, Medicines and Laboratories or Direction Nationale de la Pharmacie, Midicaments et Laboratoires (DPML) to purchase drugs from the private sector. According to estimates received through interviews we conducted in
Burundi, the BPSs regularly procure 30-70% of their requirements through private sector pharmacies. Also, some BPSs do not have the space to store a quarter's worth of drugs-this intensifies the need to frequently return to CAMEBU or private
pharmacies to fulfill drug needs. On the BPS level, needs are also supplemented by private pharmacies.
Our empirical understanding of the public health system in Burundi is based on the receipts from CAMEBUs annual financial reports for 2006 and 2007. Based on information in these reports, the frequency of pick-ups at CAMEBU varied
significantly between the BPSs from different provinces. The table below provides a summary of the number of trips made by each of the BPSs to CAMEBU.
made by the BPSs to CAMEBU in 2006 and 2007.
The records above from CAMEBU's financial statements suggest that out of the 17 provinces in Burundi, only 11 BPSs picked up drugs from CAMEBU in 2006 and only 8 picked up drugs from CAMEBU in 2007. These low and declining numbers of
BPSs that source drugs from CAMEBU is a concern. We suspect that the lack of data for the other provinces is due to transactions that were conducted on credit on the MOH account but this has not been confirmed. This is probably because CAMEBU's financial statements record transactions based on the payer and not the recipient of the drugs and supplies. Further investigation would help to understand the
underlying reasons for this effect. Table 1. Number of trips
BPS Trips No Name 2006 2007 1 BPS Kirundo 1 3 2 BPS Cibitoke 1 no data 3 BPS Gitega 1 no data 4 BPS Cankuzo 2 2 5 BPS Ngozi 3 no data 6 BPS Kayanza 4 4 7 BPS Ruyigi 4 4 8 BPS Muyinga 4 no data 9 BPS Rutana 5 no data 10 BPS Bubanza 6 1 11 BPS Mwaro 7 1 12 BPS Makamba no data 1 13 BPS Buja-Mairie no data 6
14 BPS Buja Rural no data no data
15 BPS Bururi no data no data
16 BPS Karuzi no data no data
1.4 Proposed Health District Reform in Burundi
The proposed Public Health District Reform seeks to increase the efficiency of drug supply throughout Burundi by changing the structure and strategy of
Burundi's public health supply chain. The reform would change Burundi's PDC from its current structure by replacing BPSs with District Health Bureaus (BDSs) as the intermediate stocking points as illustrated in Figure 2 below. In this new district-based-system, the BPSs would not hold any inventory, however, they would perform a management function where they would support, monitor and evaluate the
performance of the BDSs in their province. Strategically, the reform would change the operation from the current pick-up mode of operation to a delivery mode.
Level
1
< U(Central)
Level 2
(District)
Level
3
(mision-ased rr 0E
I-0eFigure 3. Structure of the province-based public health system in Burundi
The effects of multiplicity on the transportation and inventory costs would be impacted by the structure of the system. In the context of this reform, we evaluate 4
CDS1
(pbfc Lpotential scenarios for the primary distribution channel in the public health system. The scenarios are combinations of the system structure (current province-based system or proposed district-based system) and the mode of distribution (pick-up or delivery) as follows:
1. Province-based structure operating in pick-up mode.
2. Province-based structure operating in delivery mode.
3. District-based structure operating in pick-up mode.
4. District-based structure operating in delivery mode.
Each alternative presents different transportation and inventory dynamics, with different cost-benefit tradeoffs.
1.5 Problem Definition
In light of the highly debated health district reform, we aim to provide an objective evaluation of the four different supply chain scenarios identified above. We assess the cost-benefit tradeoffs in each of the alternatives of the primary
distribution channel in the public health system. In order to do so, we will address 3 main questions though our research
-1. What are the factors contributing to the costs of multiplicity in the public health supply chain in Burundi?
3. What can be done to mitigate these costs?
By answering these questions objectively, we hope our research will help to guide the dialogue between the Ministry of Health and other stakeholders in their efforts to improve the effectiveness of health care delivery in Burundi.
1.6 Literature Review
A diverse selection of literature was reviewed to understand the costs of multiplicity in the context of Burundi's Public Health supply chain. Sources
outlining supply chain structure were used to understand the impact of changing structures on transportation and inventory dynamics. Literature on drug supply in African countries helped to frame our approach to the analysis. Specific studies in
health supply chain strategy informed our recommendations.
S.D. Foster's "Improving the Supply and Use of Essential Drugs in Sub-Saharan Africa," discusses the fusion between the private and public supply chains in many African countries. She goes further to define parastatal organizations that duplicate functions in both sectors. To oppose issues of incorrect quantification of drug needs from multiple parties, Foster believes that centralization of public health supply chains is essential for proper public health supply chain management.
Effects of multiplicity are broached in Laverty and Lai's, "Improving Global Health Impact Through Tailored Supply Chains: A Case Study of Ghana" (2008). Segmentation is seen as a way to combat multiplicity in procurement and
distribution. Though specific costs of transportation, and inventories are not fully quantified, but the relative benefits of segmenting drugs are discussed extensively.
Anban Pillay's "The South African Experience: Access, Price, Regulation Towards National Health Insurance," details the fragmented nature of many African public health supply chains. His work provided baseline percentages of public versus private drug purchases in the space. Concerning cash flow issues up and down the supply chain Pillay provides innovative nationalized insurance alternatives that have been well received internationally.
John Snow Incorporated (JSI) has produced numerous documents detailing logistics system structures in African public health supply chains. JSI assessments have analyzed Ghana, Nigeria, and Kenya among other countries. This organization has also developed "Concepts of Logistics Systems Design," which is a manual detailing best practices in logistics system structural design for public health supply chains in Africa (Owens, 2003). Though some of JSI country assessments have touched on the impact of vertical programs, the costs associated with these programs have not been quantified.
Another JSI Article, "Decentralizing and Integrating Contraceptive Logistics Systems in Latin America and the Caribbean" provides a discussion of necessary differences in inventory policies for centralized and decentralized public health supply chains. This information, though not specific to Africa, or detailing costs, contributed to the qualitative inventory discussions.
2 Methods
We used a combination of qualitative and quantitative methods to analyze the costs of multiplicity in the distribution of the drugs and supplies through the public health supply chains in Burundi. Specifically, we used structured interviews to develop a qualitative understanding of the issues, which were complemented by surveys to gather transportation cost information. The data from the surveys were used to model transportation costs in the system to evaluate the current (province-based) and reformed (district-(province-based) scenarios.
2.1 Current Province-Based System
-The Primary Distribution Channel of the public health system in Burundi is comprised of three levels as illustrated in Figure 4 below.
U
el
-CAMEBU
17 BPS
487 CDS
Figure 4. Structure of the province-based public health system in Burundi
Primary Distribution Channel of the ~I ::: ; ::
aaL '~ ~li:;.s~
~? -i:; ;
Qualitative aspects were surveyed from respondents via structured interviews with stakeholders in the Central Procurement & Distribution Agency (CAMEBU), Provincial Distribution Centers (BPS), and at the Health Centers (CDS). These interviews provided the information pertaining to the ordering and transportation process, the types of vehicles used and also provided an initial range of estimates of the costs incurred. Multiple representatives at each of the three levels were
interviewed to triangulate information and validate anecdotal estimates. A set of common questions was used consistently in most interviews to ensure that all necessary information was gathered. A complete list of questions and their responses can be found in Appendix 4.
2.1.1. Scenario 1: Pick-up Mode
-The current distribution system operates in a pick-up mode where the health centers pick up drugs and supplies from the provincial centers, which in turn pick up from the central store. Numerical data was obtained through a survey sent to the central procurement agency, and to provincial distribution centers, which solicited information about transportation costs, frequency of pick-ups, frequency of orders and other factors. A complete list of survey questions can be found in Appendix 5. The data from these surveys was used extensively to create the transportation cost model for the link between the central and provincial levels under the current system. Due to the lack of available data and challenges with implementing a similar survey for the health centers, the quantitative analysis was limited to link between the central and provincial levels.
2.1.2. Scenario 2: Delivery Mode
-In order to perform a quantitative comparison, we created a transportation cost model for a hypothetical scenario where the distribution system would operate in a push mode where CAMEBU would deliver drugs and supplies to the BPS. This would allow us to assess the transportation costs due to the multiplicity of pick-ups from CAMEBU. We used data from the UNDP invoices for the distribution of large quantities of medical supplies to all the BPSs to construct a model to calculate the transportation costs between CAMEBU and the different BPSs. Since the invoice data was only for distribution to the BPSs, our analysis was limited to distribution
between the central and provincial levels.
2.2 Reformed District-Based System
-According to the proposed Health District reform, Burundi is transitioning to a health district system under which the 17 provincial distribution centers will be replaced by 44 district distribution centers. The reformed public health distribution system in Burundi will comprised of three levels as illustrated in Figure 4 below.
-U
Ueta
Leve I
CAMEBU
44 BDS
487 CDS
Figure 5. Structure of the district-based Primary Distribution Channel of the public health system in Burundi
The transportation cost models for both pick-up and push modes of operation were modified to assess the impact of the health reform of transitioning to the
district distribution centers (BDS). These two cost models will help us evaluate the potential cost advantages of the hypothetical centralized distribution system over the current decentralized distribution system for both province level and district
level distribution.
2.2.1. Scenario 3: Pick-up Mode
-The transportation cost model created based on the survey data was modified to quantify the costs that would be incurred in the reformed system for distribution between the central and district levels under the pick-up mode of operation. The 17
BPSs were replaced with 44 BDSs and transportation costs were extrapolated depending on the provinces to which the districts were a part of.
2.2.2. Scenario 4: Delivery Mode
-The transportation cost model based on the data from the UNDP invoices was modified to assess the projected costs that would be incurred in the reformed system for distribution between the central and district levels under the push mode of operation. The transportation costs for delivery to with 44 BDSs instead 17 BPSs from CAMEBU were extrapolated depending on the provinces to which the districts belong.
3 Analysis
Based on information gathered through our interviews in Burundi, we identified several factors contributing to the costs of multiplicity in the public health supply chain. The primary factors contributing to multiplicity in transportation are the pick-up mode of distribution and the constrained supply of drugs a CAMEBU. When operating in a pick-up mode there is the inherent multiplicity of each of the BPSs arranging their own transportation to pick up drugs and supplies from CAMEBU. The constrained supply at CAMEBU often results in only partial fulfillment of BPS orders which causes the BPSs to procure drugs from the private sector at higher prices or to return to CAMEBU more frequently. Both these factors result in higher transportation costs.
The primary factors contributing to multiplicity in inventory are the multiple stocks of some drugs at the same facility and the number of stocking locations. Several health centers are required to maintain separate stocks of drugs for sale and those which were donated to be given away to patients free of charge. Secondly, an increase in the number of stocking locations at the intermediate level would have an effect on the total system inventory.
Our analysis aims to discuss the factors contributing to the costs of multiplicity in the public health supply chain in Burundi and assess the cost impacts under different scenarios. First, we provide an analysis of the current province-based system with 17 provincial centers (BPS) as the intermediate stocking points between CAMEBU at the central level and the health centers at the service level.
Then we analyze the reformed district-based system in which 44 district centers (BDS) serve as the intermediate stocking points between the central and service levels. Each system structure is analyzed under two different modes of distribution: pick-up and delivery. In order to assess the impact of these factors on the
transportation costs we develop two cost models; one quantifying the costs of pick-up by the BPSs or BDSs from CAMEBU and another quantifying the costs of delivery from CAMEBU to the BPSs or BDSs.
3.1 Cost Model for Pick-up mode
-The current distribution system operates in a pick-up mode where the health centers pick-up drugs and supplies from the provincial centers that go to CAMEBU to receive their stock. To analyze the transportation costs of pick-up between the BPS and CAMEBU we utilized data from surveys, which were administered to the directors of the BPS from the different provinces. An example of a completed survey can be found in Appendix 6. Survey responses were received only from 11 of the 17 BPSs. So we used the data from the 11 surveys to create a transportation cost model to estimate the transportation costs for the remaining 6 BPSs under the current system.
Based on the survey data we found a very high degree of variation in the number of trips made by the BPSs to pick-up drugs. By design, they are only intended to pick-up drugs once a quarter or 4 times per year. However, we found that amongst the BPSs who responded to the survey, they made an average of 9 trips per year to
CAMEBU ranging from as few as 4 trips to as many as 18 trips. These additional trips add significant expenses due to the high cost of transportation. The number of trips made by each of the provinces to CAMEBU and private sector pharmacies to pick-up drugs is illustrated in Figure 6 below.
20 18 16 14 12 10 8 6 4 2 0
1 I
I
ol~
,S~"Io
. o_ " eI~p
s "_eTI
.'
" CAMEBU
U Private Pharmacies
Figure 6. Number of trips for picking up drugs from CAMEBU and private pharmacies, by province.
The BPSs currently use several different modes of transport for picking up drugs. They primarily hire trucks for large shipments, use their own vehicle (if available) for smaller shipments, and occasionally hire taxis or motorcycles. The distribution of the number of trips by mode of transport used by the BPSs is shown in Figure 7 below. The other category primarily includes the vehicles owned by BPSs.
14 12 10 8 6 -- Hire Truck 4 - BPS Vehicle 2 0
Figure 7. Trips by province using a hired truck or BPS vehicle
The actual transportation costs incurred by the BPSs as reported in the surveys are listed in Table 2 below. The trucks were hired for larger shipments whereas the BPS vehicles were used for smaller replenishments. It is evident that costs of hiring a truck dominate the total transportation costs.
Table 2. Transport costs by mode and province.
Province Hire Truck Truck BPS Vehicle BPS Vehicle Total Cost
No of trips Cost per trip Total (FBU) No of trips Cost per trip Total (FBU) (FBU)
Bubanza 7 80,000 560,000 3 0 560,000 Cankuzo 1 300,000 300,000 7 0 300,000 Cibitoke 4 200,000 800,000 0 0 800,000 Kayanza 6 300,000 1,800,000 12 0 1,800,000 Kirundo 2 380,000 760,000 5 0 760,000 Makamba 4 350,000 1,400,000 8 130,000 1,040,000 2,440,000 Muramvya 1 200,000 200,000 13 50,000 650,000 850,000 Muyinga 6 500,000 3,000,000 12 150,000 1,800,000 4,800,000 Mwaro 4 800,000 3,200,000 8 400,000 3,200,000 6,400,000 Ngozi 12 200,000 2,400,000 0 2,400,000 Rutana 1 300,000 300,000 11 130,000 1,430,000 1,730,000 TOTAL 14,720,000 8,120,000 22,840,000
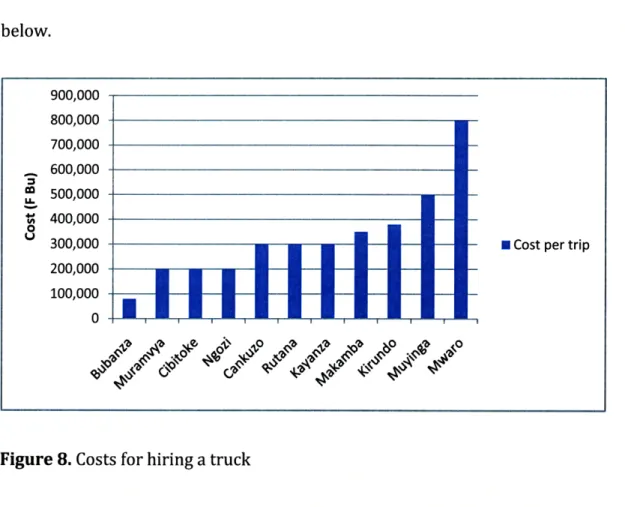
The costs for hiring a truck vary significantly depending on location. The range of cost per trip for hiring a truck in each of the provinces is illustrated in Figure 8 below. 900,000 800,000 700,000 600,000 0L 500,000 U-V 400,000 -0
300,000 -- Cost per trip
200,000 100,000
0
Figure 8. Costs for hiring a truck
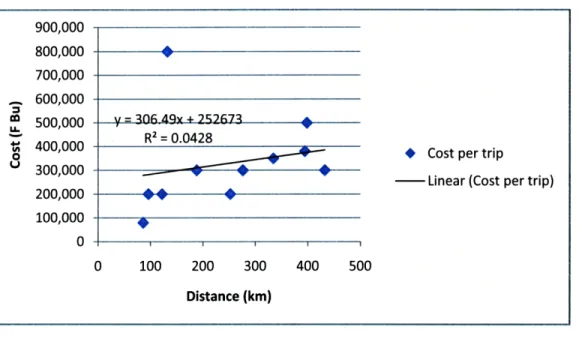
To estimate the total transportation costs between the central and provincial levels we created a model based on the survey data. We assumed a quarterly pick-up routine, which is the intended replenishment frequency by design of the current system. Since the reduced pick-up frequency would result in larger shipments on average we used the costs of hiring trucks to build the transportation cost model. In order to estimate the vehicle costs as a function of distance, we created a scatter plot of the truck rental costs against the distance for each trip as illustrated in Figure 9 and performed a regression. It is evident that one clearly outlying data point is causing a very poor fit as indicated by the very low R2value.
V = 30649x + 752 673 R2 = 0.0428 II Iv~ y 900,000 800,000 700,000 600,000 500,000 400,000 300,000 200,000 100,000 0 100 200 300 Distance (km) 400 500
Figure 9. Preliminary regression of vehicle costs as a function of distance.
In order to get a better estimate of the vehicle costs as a function of distance, we created another scatter plot after removing the outlying data point as illustrated in
Figure 10. The regression on this set of data points resulted in a much better fit as indicated by the significantly higher R2 value.
600,000 500,000 y = 721.27x + 95057 R2 = 0.6466 300,000
0* Cost per trip
u 200,000
- Linear (Cost per trip)
100,000
0
0 100 200 300 400 500
Distance (km)
Figure 10. Revised regression vehicle costs as a function of distance.
* Cost per trip
To allow a comparison between the vehicle costs in the pick-up and delivery modes, we needed to ensure consistency between models. The vehicle costs in the delivery mode are accounted for completely as a variable cost with respect to distance. Therefore, we performed another regression on the data set to eliminate the fixed cost component by forcing a zero intercept as displayed in Figure 11 below. 600,000 500,000 y400000 = 1020.7x 400,000 = 0.5093 ' 300,000 S+ Transport Costs
200,000 Linear (Transport Costs)
100,000
0I I I
0 100 200 300 400 500
Distance (km)
Figure 11. Vehicle costs as a function of distance.
The total vehicle costs, between the central and provincial levels in the pick-up mode, can be estimated as a function of distance using the variable cost of 1020.7 FBU per kilometer travelled as derived from the regression. The table of distances between the provinces provided by the Burundi tourism department (Appendix 7) can then be used calculate round-trip tour distances for pick-ups from CAMEBU to compute the appropriate vehicle costs for each of the tours.
3.2 Delivery Cost Model
-The delivery mode evaluation is based on a proposed scenario in which the central level would deliver drugs and supplies to the provincial level instead of the BPSs picking up from CAMEBU as they do in the current system. To analyze the transportation costs of delivery between CAMEBU and the BPSs we utilized the receipts of transportation costs for a joint distribution effort of supplies by CAMEBU and the United Nations Development Program (UNDP) to the provinces. A summary of the delivery costs is provided in Table 3 below.
Table 3. Transportation costs of UNDP deliveries.
No of Distance No of People Per Diems Rate (FBU/ Vehicle Costs Total Cost
Dates Days (km) from CAMEBU (FBU) tonne-km) (FBU) (FBU)
Le 02/12/2008 1 35 1 0 425 104,125 104,125 Du 10 au 10/09/2008 1 45 1 0 425 133,875 133,875 Le 11/11/2008 1 69 2 70,000 425 205,275 275,275 Le 17/10/2008 1 83 2 35,000 425 246,925 281,925 Le 25/09/2008 1 87 2 35,000 425 258,825 293,825 Du 24 au 25/09/2008 2 171 2 70,000 425 508,725 578,725 Du 03 au 04/09/2008 2 185 2 70,000 425 550,375 620,375 Du 31/10 aul/11/2008 2 190 2 70,000 425 565,250 635,250 Du 28 au 29/10/2008 2 209 2 70,000 425 621,775 691,775 Du 26 au 27/09/2008 2 225 2 70,000 425 669,375 739,375 Du 04 au 05/09/2008 2 227 2 70,000 425 675,325 745,325 Du 18 au 19/11/2008 2 228 2 70,000 425 678,300 748,300 Du 09 au 10/10/2008 2 245 2 70,000 425 728,875 798,875 Du 14 au 15/10/2008 2 248 2 70,000 425 737,800 807,800 Du 29 au 30/09/2008 2 263 2 70,000 425 782,425 852,425 Du 05 au 06/1112008 2 272 2 70,000 425 809,200 879,200 Du 20 au 21/11/2008 2 284 2 70,000 425 844,900 914,900 Du 02 au 03/10/2008 2 300 2 70,000 425 892,500 962,500 Du 01 au 02/09/2008 2 386 2 70,000 425 1,148,350 1,218,350 Du 22 au 23/10/2008 2 388 2 70,000 425 1,154,300 1,224,300 Du 06 au 071110/2008 2 424 2 70,000 425 1,261,400 1,331,400 Du 08 au 10/09/2008 3 351 2 105,000 425 1,044,225 1,149,225 Du 13 au 15/11/2008 3 566 2 70,000 425 1,683,850 1,753,850 Du 25 au 28/11/2008 4 510 2 140,000 425 1,517,250 1,657,250 TOTAL 47 5,991 1,575,000 17,823,225 19,398,225
The UNDP receipts data was used to create a cost model to characterize the vehicle costs as a function of distance and the per diem costs as a function of trip duration in days. The UNDP data was utilized for building the cost model, as it was
the only series of delivery trips made from CAMEBU to the provinces for which cost data was available.
In order to calculate total transportation costs as a function of distance, we needed to estimate the trip duration in days as a function of distance to compute per diem costs. In order to do so we created a scatter plot of the trip distance against the duration is illustrated in Figure 12 below. Based on the receipt data, the per diem rate were fairly consistent for all the delivery trips and determined to be 17,500 FBU per person-day.
700 600 500 y = 170.43x -84.133 R2 = 0.7191 Distance (krn) 400 300 200 - Linear 100 - (Distance (krn)) 0 0 1 2 3 4 5
Figure 12. Correlation between Trip Distance and Duration
We performed a linear regression analysis to establish a correlation between the tour distance and the duration of the trips. This would enable estimation of per diem costs based on a trip distance. The range of distances and corresponding trip
Table 4. Range of trip distances and corresponding duration.
Distance (in km) Duration
Range Low Range Nom Range High (Days)
2 86 171 1
172 257 341 2
342 427 512 3
513 598 682 4
The correlation between trip distance and duration allows us to estimate total trip costs based solely on distance. First, the vehicle cost component is directly a function of distance. Second, the per diem cost component, which is a function of people and duration, is calculated assuming two people per trip. Further, using the results of the distance-duration regression in Table 4 we estimate the number of days needed for the trip based on the tour distance thereby allowing us to calculate total trip costs of delivery solely based on distance. Thus the total cost function is comprised of a vehicle cost component which is linear with respect to the trip distance and a per diem cost component which is a step function with respect to the trip duration as illustrated in Figure 13 below.
2,500,000 1
2,000,000
1,500,000
- Per Diem Costs (FBU) o
S1,000,000 --- Vehicle Costs (FBU)
--- Total Costs (FBU)
500,000
0
A
0 200 400 600 800
Distance (km)
Figure 13. Components of the delivery cost model.
The total vehicle costs, between the central and provincial levels in the delivery mode, can be estimated as a function of distance using the variable cost of 425 FBU per ton-kilometer as derived from the model. The table of distances between the provinces provided by the Burundi tourism department (Appendix 7) can then be used calculate tour distances for delivery from CAMEBU to the BPSs to compute the appropriate vehicle costs for each of the tours. The total per diem costs can also be calculated as a function of distance by estimating the number of days for the trip based on Table 4 and then calculating the per diem costs based on the rate of 17,500 FBU per person-day.
3.3 Analyzing transportation costs for 4 scenarios:
Our evaluation of transportation is focused on the vehicle and per diem costs in all four scenarios, which would vary significantly depending on the system structure and distribution strategy. The quantitative assessment of the transportation costs is limited to the link between the central and intermediate levels (province or district) due to the lack of data to develop a cost model between the intermediate and service levels. However, we provide a framework for extending the analysis to evaluate transportation costs the intermediate and service levels.
3.4 Analysis of Current System
-We analyzed the current 3-level system under two scenarios. First, as the system is currently operating in pick-up mode where the province level picks up drugs and supplies from the central level. Second, as the system would operate in a
hypothetical delivery mode where drugs and supplies would be delivered from CAMEBU to the BPSs.
3.4.1. Scenario 1: Pick-up Mode
-The first scenario is an assessment of how the current system is designed to operate. A representative from the BPSs in each of the 17 provinces goes to CAMEBU once
Figure 14. Province Based System with Pick-Up Strategy
To estimate the total cost of transportation as a function of distance, between the central and provincial levels in the pick-up mode, we used a table of distances
between the provinces (provided in Appendix 7). Then the variable cost of 1020.7 FBU per kilometer travelled as derived in the pick-up cost model was used to calculate the appropriate costs for each of the tours. In order to calculate the per diem costs we used the range of trip distances and corresponding duration in Table 4 to estimate the number of days for each pick-up trip. The per diem costs were then calculated using a rate of 17,500 FBU per person-day (as derived from the delivery cost model) and assuming that two people from the BPS travel for each trip to CAMEBU. According to the cost model, no per diem is paid for trips shorter than 50 kilometers, which is consistent with the data that was used to create the model. We
assumed a quarterly pick-up schedule or frequency of 4 trips per year as intended by design of the system to allow a comparison with the hypothetical delivery mode, which is discussed Scenario 2. The total annual costs of pick-up incurred by the BPSs are as shown in Table 5 below.
Table 5. Total annual costs of pick-up from CAMEBU in the current system.
Duration Transport Costs Perdiem Cost Frequency Annual Cost
Province Distance (km)
(days) (F Bu) (F Bu) (Trips/year) (F Bu)
Buja mairie 4 1 4,083 0 4 16,331 Buja rural 40 1 40,828 0 4 163,312 Bururi 212 2 216,388 70,000 4 1,145,554 Gitega 200 2 204,140 70,000 4 1,096,560 Karuzi 316 2 322,541 70,000 4 1,570,165 Ruyigi 340 2 347,038 70,000 4 1,668,152 Bubanza 86 1 87,780 35,000 4 491,121 Cankuzo 432 3 440,942 105,000 4 2,183,770 Cibitoke 122 1 124,525 35,000 4 638,102 Kayanza 188 2 191,892 70,000 4 1,047,566 Kirundo 394 3 402,156 105,000 4 2,028,623 Makamba 334 2 340,914 70,000 4 1,643,655 Muramvya 96 1 97,987 35,000 4 531,949 Muyinga 398 3 406,239 105,000 4 2,044,954 Mwaro 132 1 134,732 35,000 4 678,930 Ngozi 252 2 257,216 70,000 4 1,308,866 Rutana 276 2 281,713 70,000 4 1,406,853 Total 3,822 31 3,901,115 1,015,000 19,664,462
3.4.2. Scenario 2: Delivery Mode
-The second scenario is an assessment of the current system structure operating in a hypothetical delivery mode. In this case, CAMEBU would deliver drugs and supplies to each of the 17 BPSs once every 3 months.
Figure 15. Province Based Structure with Delivery Strategy
The fundamental advantage of the delivery mode over the pick-up mode is the ability to make multi-stop shipments or what is referred to as 'milk runs'. This provides significant cost efficiency by reducing the number of trips made assuming that the shipments are not constrained by capacity. To plan the delivery routes from CAMEBU, the provinces have been grouped into clusters considering geographic proximity and trying to keep the demand amongst clusters comparable. The total population of the provinces in each cluster was used as an indication of the level of demand of drugs and supplies. The 17 provinces were divided into clusters of two or three as depicted in Table 6 below, to illustrate the potential cost savings of multi-stop deliveries compared to individual pick-ups.
Table 6. Clusters of provinces for delivery to BPS. CLUSTER 1
No Province Name POPULATION
1 BUBANZA 348,188
2 CIBITOKE 460,626 3 KAYANZA 586,096 Total 1,394,910
CLUSTER 4
No Province Name POPULATION
1 BURURI 570,929 2 MAKAMBA 428,917
3 RUTANA 336,394
Total 1,336,240
CLUSTER 2
No Province Name POPULATION
1 KIRUNDO 636,298
2 MUYINGA 632,346
Total 1,268,644
CLUSTER 5
No Province Name POPULATION
1 Buja Mairie 478,155 2 Buja Rural 565,070
3 MWARO 269,048
Total 1,312,273
CLUSTER 3
No Province Name POPULATION
1 NGOZI 661,310
2 KARUZI 433,061
3 MURAMVYA 294,891
Total 1,389,262
CLUSTER 6
No Province Name POPULATION
1 GITEGA 715,080
2 CANKUZO 221,391
3 RUYIGI 400,818
Total 1,337,289
Using the table of the distances between the provinces (Appendix 7) we estimated the tour distance for delivering to each cluster. The transport cost
component was calculated directly as a function of the distance using the rate of 425 FBU per ton-km based on the model. The trip duration was assessed using the distance-duration regression (Table 4), which was then used to compute the per diem costs.
Table 7. Total annual costs of delivery in the current system using UNDP rates.
Cluster Distance Duration Transport Cost Per Diem Cost Total Frequency Annual Cost
(km) (days) (FBU) (FBU) (FBU) (trios/vear) (FBU)
1 271 2 806,225 70,000 876,225 4 3,504,900 2 460 3 1,368,500 105,000 1,473,500 4 5,894,000 3 435 3 1,294,125 105,000 1,399,125 4 5,596,500 4 332 2 987,700 70,000 1,057,700 4 4,230,800 5 142 1 422,450 35,000 457,450 4 1,829,800 6 370 3 1,100,750 105,000 1,205,750 4 4,823,000 Total 2,010 14 5,979,750 490,000 6,469,750 25,879,000
The transportation costs in Table 7 above were calculated using a rate of 425 FBU per ton-kilometer and a shipment size of 7 tons, which was based on the delivery cost model using the UNDP receipts data. These deliveries included
transport of bulky items, which were transported in large trucks with capacities of 20 cubic meters. However, for the delivery of significantly lighter loads comprised of drugs and supplies, a smaller delivery truck comparable to the trucks hired by the BPSs for pick-up would be used. Therefore, we computed the costs of delivery using the same rate of 1020.7 FBU per kilometer, which are summarized in Table 8 below. This rate translates to an equivalent average shipment weight of 2.4 tons instead of 7 tons, which is a more realistic for the relatively light weight drugs and supplies.
Cluster Distance Duration Transport Cost Per Diem Cost Total Frequency Annual Cost
(km) (days) (FBU) (FBU) (FBU) (trips/year) (FBU)
1 271 2 276,610 70,000 346,610 4 1,386,439 2 460 3 469,522 105,000 574,522 4 2,298,088 3 435 3 444,005 105,000 549,005 4 2,196,018 4 332 2 338,872 70,000 408,872 4 1,635,490 5 142 1 144,939 35,000 179,939 4 719,758 6 370 3 377,659 105,000 482,659 4 1,930,636 Total 2,010 14 2,051,607 490,000 2,541,607 10,166,428
Table 8. Total annual costs of delivery in the current system.
Considering the variation in transportation rates and the lack of information about truck capacity constraints we performed a sensitivity analysis to gauge the impact of a range of transport rates on the total annual costs of delivery. Given the rate from the pick-up cost model was 1020.7 FBU per kilometer and the rate from the UNDP delivery cost model was equivalent to 2975 FBU per kilometer (425 FBU per ton-kilometer x 7 tons) we selected a range of 400 to 4000 FBU per kilometer. This range in vehicle rates captures the variation due to a range of vehicle sizes an capacities. The variation of the total annual costs of delivery with a change in the
transport rate is illustrated in Figure 16 below. Vehicle costs accounted for 62-94% of total costs over the range of transportation rates.
Figure 16. Variation of the total annual costs of delivery with a change in transportation rate.
Given the variation in per diem rates we performed a sensitivity analysis to gauge the impact of a range of per diem rates on the total annual costs of delivery. According to the Ministry of Health guidelines, per diem rates should range from 15,000 to 25,000 FBU per day. However, since we had received anecdotal estimates of per diems as high as 40,000 FBU through our interviews in Burundi, we selected a range of 15,000 to 40,000 FBU per day-person for the sensitivity analysis. Even though the high-end per diem rate exceeds current MOH guidelines, it reflects costs, which might actually be paid in the case of policy violation and might be beneficial in case the MOH was potentially considering increasing per diem rates. The
variation of the total annual costs of delivery with a change the per diem rate is illustrated in Figure 16 below. Per diem costs accounted for 17-35% of total costs over the range of per diem rates. The vehicle costs in this sensitivity analysis are constant since they do not vary as a function of the per diem rate.
14 0 12 10 S8Vehicle 8 Costs -(FBU)
S6 - Per Diem Cost
0 u (FBU) .F 4 C -Total Cost 2 (FBU) 0I 0 10 20 30 40
Per Diem Rate (F Bu/day-person) Thousands
Figure 17. Variation of total annual costs of delivery with a change in per diem rate.
3.5 Analysis of Reformed System
-According to the proposed health sector reform, Burundi will potentially be transitioning to a health district system under which the 17 provincial distribution centers will be replaced by 44 district distribution centers as the intermediate stocking points for drugs in the public health distribution system. We analyzed the impact of this reform on the system-wide transportation costs in the pick-up mode as well as the hypothetical delivery mode.
3.5.1. Scenario 3: Pick-up Mode
-The third scenario is an assessment of district-based system operating in a pick-up mode. The BDSs from each of the 44 districts would go to CAMEBU one per quarter to pick up the drugs and supplies they needed.
Figure 18. District Based System with Pick-Up Strategy
To analyze the transportation costs of pick-up from the 44 BDS locations we used the pick-up cost model. To estimate the distance to each of the BDSs, we assumed that the average distance between the BDS locations in a province and CAMEBU was equal to the distance between the BPS in that province and CAMEBU. The transportation costs for pick-up from the 44 BDS locations are summarized in Table 9 below.
Table 9. Annual transport costs of pick-up in the reformed system.
No of Distance Duration Vehicle Costs Perdiem Cost Frequency Annual Transport Province
Districts (km) (days) (F Bu) (F Bu) (Trips/year) Costs (F Bu)
Buja Mairie 3 4 1 4,083 0 4 48,994 Buja Rural 3 40 1 40,828 0 4 489,936 Bubanza 2 86 1 87,780 35,000 4 982,242 Muramvya 2 96 1 97,987 35,000 4 1,063,898 Cibitoke 2 122 1 124,525 35,000 4 1,276,203 Mwaro 2 132 1 134,732 35,000 4 1,357,859 Kayanza 2 188 2 191,892 70,000 4 2,095,133 Gitega 4 200 2 204,140 70,000 4 4,386,240 Bururi 3 212 2 216,388 70,000 4 3,436,661 Ngozi 3 252 2 257,216 70,000 4 3,926,597 Rutana 2 276 2 281,713 70,000 4 2,813,706 Karuzi 2 316 2 322,541 70,000 4 3,140,330 Makamba 2 334 2 340,914 70,000 4 3,287,310 Ruyigi 3 340 2 347,038 70,000 4 5,004,456 Kirundo 4 394 3 402,156 105,000 4 8,114,493 Muyinga 3 398 3 406,239 105,000 4 6,134,863 Cankuzo 2 432 3 440,942 105,000 4 4,367,539 Total 44 3,822 31 3,901,115 1,015,000 51,926,458
3.5.2. Scenario 4: Delivery Mode
-The fourth scenario assesses the reformed district-based system operating in a delivery mode. This alternative makes better use of the potential of the distributed structure to decrease stock out occurrences, because the centralized management, and visibility provided from the BPSs serving as management and support centers would theoretically allow better forecasting, and replenishment procedures. However, managerially, it would be much more complicated to manage centrally than the current system operating in a delivery mode due to the greater number of intermediate stocking points. Managers would have to create forecasts and
replenishment schedules for 44 facilities instead of 17. In this scenario, CAMEBU would deliver drugs and supplies to each of the 44 BDSs one per quarter.
CAMEBU
CDS BDS CDS CDS BDS CDS CDS BDS CDS
Figure 19. District Based System with Delivery Strategy
In this scenario, the drugs would be delivered from CAMEBU to the 44 district level centers (BDS). To analyze the transportation costs of delivery to the 44 BDS locations we used the delivery cost model. We maintained the same six clusters as in the case of delivery to the BPSs (Scenario 2). However, in this case, each tour would include a stop at all the BDS locations within the provinces of each cluster. In order to estimate the total distance for each tour, we assumed an additional distance of 25 kilometers within each province of a cluster. Based on the transport rate
determined for delivery to the BPSs we calculated the quarterly vehicle costs of delivery as summarized in Table 10 below.
Table 10. Quarterly vehicle costs for delivery in the reformed district-based system.
BPS Tour No of BDS Tour Vehicle Cost
Cluster Distance (km) Provinces Distance (km) (FBU)
1 271 3 346 353,162 2 460 2 510 520,557 3 435 3 510 520,557 4 332 3 407 415,425 5 142 3 217 221,492 6 370 3 445 454,212 Total 2,010 17 2,435 2,485,405
In order to calculate the per diem costs, we needed to determine the duration of each tour. We assumed each stop at a BDS to add one hour to duration of the trip. With the current set up of the clusters with 6 to 9 BDSs each, we added a total of 6 to 9 hours to the duration of each tour. Based on the average speed of 21.3 kilometers per hour determined from the regression analysis for delivery to the BPSs, we calculated the equivalent distance added to each tour. This equivalent distance served as the basis for per diem to estimate the number of days needed for the tours based on the range of trip distances and corresponding duration listed in Table 4. We assumed that 2 people from CAMEBU travelled for each delivery tour, which is consistent with the assumption for delivery to the BPS locations. Using the
established per diem rate of 17,500 FBU per person-day and estimated number of days for each tour, we calculated the total per diem costs for the 2 people from CAMEBU travelling to deliver the drugs to the BDS locations. With quarterly delivery trips to the BDSs, we calculated the total costs of delivery in the reformed system as the sum of the transport costs and per diem costs multiplied by the annual
Table 11. Total annual costs of delivery in the reformed district-based system
Distance Duration Vehicle Cost Per Diem Cost Total Frequency Annual Cost Cluster (km) (days) (FBU) (FBU) (FBU) (tri)s/vear) (FBU) 1 346 3 353,162 105,000 458,162 4 1,832,649 2 510 4 520,557 140,000 660,557 4 2,642,228 3 510 4 520,557 140,000 660,557 4 2,642,228 4 407 4 415,425 140,000 555,425 4 2,221,700 5 217 3 221,492 105,000 326,492 4 1,305,968 6 445 4 454,212 140,000 594,212 4 2,376,846 Total 2,435 22 2,485,405 770,000 13,021,618
While the analysis for total annual costs of delivery to BDSs in the reformed system was completed using the same six clusters for delivery to the BPSs in the current system, it is important to note one major difference. Assuming that demand at the health center level stays the same in the case of the current province-based system and the reformed district-based system, the average amount of inventory would increase significantly as described in the inventory section which follows. Consequently, more trips would be required to deliver the drugs and supplies from CAMEBU to all the BDSs. This would increase the vehicle and per diem costs
accordingly.
3.6 Transportation Summary:
Based on the analysis of transportation costs, we found that total annual costs in the current system (with BPSs as the intermediate stocking point) were lower than in the reformed system (with BDSs as the intermediate stocking point) for a given mode of operation. Further, the total annual costs in the delivery mode were lower than the costs in the pick-up mode for a given system structure. A summary of the costs for the 4 different scenarios considered is presented in Table 12 below. It is
evident that a delivery mode of operation with the current system structure is the most cost efficient option in terms of total annual transportation costs. The table also shows the percentage change in total annual costs from the base case, which is the current system operating in pick-up mode.
Table 12. Total annual transportation costs for the current and reformed system operating in pick-up and delivery modes.
System Current Reformed
Mode Pickup Delivery Pickup Delivery
Distance (kim) 15,288 8,040 40,312 9,740 Total Duration (days) 124 56 332 88 (days) Transport Costs (F Bu) 15,604,462 8,206,428 41,146,458 9,941,618 (F Bu) Perdiem Cost (F Bu) 4,060,000 1,960,000 10,780,000 3,080,000 (F Bu) Total Annual Costs (F Bu) 19,664,462 10,166,428 51,926,458 13,021,618 Costs (F Bu) % Change 0% -48% 164% -34%
A comparison of the total annual transportation costs is graphically illustrated in Figure 20 below.