HAL Id: hal-00779864
https://hal.archives-ouvertes.fr/hal-00779864
Submitted on 23 Jan 2013
HAL is a multi-disciplinary open access
archive for the deposit and dissemination of
sci-entific research documents, whether they are
pub-lished or not. The documents may come from
teaching and research institutions in France or
abroad, or from public or private research centers.
L’archive ouverte pluridisciplinaire HAL, est
destinée au dépôt et à la diffusion de documents
scientifiques de niveau recherche, publiés ou non,
émanant des établissements d’enseignement et de
recherche français ou étrangers, des laboratoires
publics ou privés.
Composition of nanoparticles in optical fibers by
Secondary Ion Mass Spectrometry
Wilfried Blanc, Christelle Guillermier, Bernard Dussardier
To cite this version:
Wilfried Blanc, Christelle Guillermier, Bernard Dussardier. Composition of nanoparticles in optical
fibers by Secondary Ion Mass Spectrometry. Optical Materials Express, OSA pub, 2012, 2 (11),
pp.1504-1510. �hal-00779864�
Composition of nanoparticles in optical fibers by
Secondary Ion Mass Spectrometry
Wilfried Blanc,1,* Christelle Guillermier,2 and Bernard Dussardier,1
1Université de Nice-Sophia Antipolis, Laboratoire de Physique de la Matière Condensée, CNRS UMR7336, Parc
Valrose, 06108 Nice Cedex 2, FRANCE
2National Resource for Imaging Mass Spectroscopy, 65 Landsdowne St., Cambridge, Massachusetts 02139, USA
Abstract: The development of new active optical fibre devices requires
materials with « augmented » intrinsic properties, though using luminescent ion (LI) –doped silica as host glass. Optical fibers containing Dielectric Nanoparticles (DNP) grown by phase separation are proposed. DNP would optimally fully encapsulate LI to produce « engineered » spectroscopic properties. To determine the composition of DNP, Secondary Ion Mass Spectrometry imaging at high spatial resolution is employed. Through the use of this technique, we demonstrate without ambiguity the partition of Mg, P and Er in DNP. By increasing Mg concentration, Si concentration in DNP decreases, which explains the spectroscopic behaviour of Er.
2012 Optical Society of America
OCIS codes:(060.2270) Fiber characterization; (060.2290) Fiber materials; (160.4236) Nanomaterials; (160.5690) Rare-earth-doped materials; (160.6030) Silica.
References and links
1. M.J.F. Digonnet, Rare-earth-doped fiber lasers and amplifiers, (CRC Press, 2001). 2. B.N. Samson, L. R. Pinckney, J. Wang, G. H. Beall and N. F. Borrelli, “Nickel-doped nanocrystalline glass-ceramic fiber,” Opt. Lett. 27, 1309-1311 (2002).
3. B. N. Samson, P. A. Tick, and N. F. Borrelli, “Efficient neodymium-doped glass-ceramic fiber laser and amplifier,” Opt. Lett 26, 145-147 (2001).
4. S. Yoo,U.-C. Paek and W.-T. Han, “Development of a glass optical fiber containing ZnO– Al2O3–SiO2 glass-ceramics doped with Co2+
and its optical absorption characteristics,” J. Non-Cryst. Sol. 315, 180–186 (2003).
5. C.I. Oppo, R. Corpino, P.C. Ricci, M.C. Paul, S. Das, M. Pal, S.K. Bhadra, S. Yoo, M.P. Kalita, A.J. Boyland, J.K. Sahu, P. Ghigna and F. d‟Acapito, “Incorporation of Yb3+ ions in multicomponent phase-separated fibre glass preforms,” Opt. Mater. 34, 660-664 (2012).
6. J. Thomas, M. Myara, L. Troussellier, E. Burov, A. Pastouret, D. Boivin, G. Mélin, O. Gilard, M. Sotom, P. Signoret, “Radiation-resistant erbium-doped-nanoparticles optical fiber for space
applications,” Opt. Express 20, 2435-2444 (2012)
7. W. Blanc, B. Dussardier and M.C. Paul, “Er doped oxide nanoparticles in silica based optical fibres,” Glass Technol.: Eur. J. Glass Sci. Technol. A 50, 79-81 (2009).
8. W. Blanc, V. Mauroy, L. Nguyen, S.N.B. Bhaktha, P. Sebbah, B.P. Pal and B. Dussardier, “Fabrication of rare-earth doped transparent glass ceramic optical fibers by modified chemical vapor deposition,” J. Am. Ceram. Soc. 94, 2315–2318 (2011).
9. F. Sidiroglou, S.T. Huntington, A. Roberts, R. Stern, I.R. Fletcher and G.W. Baxter, “Simultaneous multidopant investigation of rare-earth-doped optical fibers by an ion microprobe,” Opt. Lett. 31, 3258-3260 (2006).
10. M. L. Kraft, P.K. Weber, M.L. Longo, I.D. Hutcheon and S.G. Boxer, “Phase Separation of Lipid Membranes Analyzed with High-Resolution Secondary Ion Mass Spectrometry,” Science 313, 1948-1951 (2006).
11. N. Valle, J. Drillet, A. Pic and H. N Migeon, “Nano-SIMS investigation of boron distribution in steels,” Surf. Interface Anal. 43, 573-575 (2011).
12. C. Lechene, F. Hillion, G. McMahon, D. Benson, A.M. Kleinfeld, J.P. Kampf, D. Distel, Y. Luyten, J. Bonventre, D. Hentschel, K. Moo Park, S. Ito, M. Schwartz, G. Benichou and G. Slodzian, “High resolution quantitative imaging of mammalian and bacterial cells using stable isotope mass
spectrometry,” Journal of Biology 5, 20-1-20-30 (2006).
13. J.B. Mac Chesney, P.B. Oapos Connor, H.M. Presby, “A new technique for the preparation of low-loss and graded-index optical fibers,” Proc IEEE 62, 1280-1281 (1974).
14. J.E. Townsend, S.B. Poole, and D.N. Payne, “Solution-doping technique for fabrication of rare-earth-doped optical fibres,” Elect. Lett. 23, 329-331 (1987).
15. W. Blanc, B. Dussardier, G. Monnom, R. Peretti, A.-M. Jurdyc, B. Jacquier, M. Foret and A. Roberts, “Erbium emission properties in nanostructured fibers”, “Erbium emission properties in nanostructured fibers”, Appl. Opt. 48, G119-124 (2009).
16. E.H. Hauri, J. Wang, J.E. Dixon, P.L. King, C. Mandeville and S. Newman, “SIMS Investigations of volatiles in silicate glasses, 1: Calibration, matrix effects and comparisons with FTIR,” Chem. Geol. 183, 99-114 (2002).
1. Introduction
Silica glass as a fiber host material has proved to be very attractive for developing efficient fiber amplifiers and high-power fiber lasers [1]. While this glass offers many advantages such as reliability and low cost, it suffers from limitations in term of spectroscopic properties. Thus, the development of new active optical fibre devices requires materials with « augmented » intrinsic properties, though using luminescent ion (LI) –doped silica as host glass. Dielectric nanoparticles (DNP) in optical fibers are thus considered as they can combine the sturdiness and low cost of silica with particular spectroscopic behavior that would not appear in a pure silica local-environment [2-6]. DNP would optimally fully encapsulate LI to produce « engineered » spectroscopic properties. This technology will be of great interest for a large domain of applications: high power fibre lasers, random lasers, light sources with new wavelengths, telecommunications.
The original route proposed by LPMC to obtain DNP in fibers is based on the industrial MCVD (Modified Chemical Vapor Deposition) process [7]. As silicate systems have a strong stable immiscibility when they contain divalent metal oxides, we take advantage of thermal treatments inherent to this process to obtain DNP through the phase separation mechanism. Through this route, DNP are grown in-situ within the material. Regarding environmental and health considerations, this is of great interest to avoid handling of and exposure to nanoparticles.
When Mg ions are incorporated, modifications of the erbium spectroscopy have been reported as the alkaline-earth ion concentration increases [8]. However, as DNP are obtained through phase separation, the Er3+ ion environment is unknown a priori and needs to be determined at the nanometer scale.
Analytical techniques to determine the composition at nanometer scale are scarce and most of the time require specific sample preparation which restrict their use. Some analyses are performed on fiber preforms with a core diameter of ~1 mm. It is then assumed that the composition is unchanged in the fiber. However, the fiber drawing step requires heating the fiber up to 2000°C and therefore some changes may be expected. Analyses on fibers are preferable but the region of interest is restricted to the core which has a diameter of ~10 µm (the external diameter of the fiber is 125 µm). One of the more standard analytical techniques used to probe fiber is EDX (Energy Dispersive X-ray) coupled with TEM (Transmission Electron Microscopy). Nanometer resolution is reached only if the thickness of the sample is less than 10 µm. Moreover, the exact determination of the composition can be hard to achieve as some X-ray emission bands can overlap, such as those of Mg (K) and Ge (L) which are of interest in our compositions.
In this work, we used Secondary Ion Mass Spectrometry (SIMS) imaging, a surface analysis technique, to investigate the composition of the DNP localized in the fiber core. This technique has been successfully applied previously to determine the distribution of elements in homogeneous fibers [9]. The Nanosims50L [10-12] instrument utilized in this study combines analysis at high spatial resolution (35 nm) with the simultaneous detection of up to 7 secondary ions sputtered from the same probed nano-volume. This makes the Nanosims50L particularly suitable to investigate heterogeneous materials such as nanoparticle-doped fibers. In addition, this technique only requires the fibers to be cleaved for analysis.
With SIMS imaging we demonstrate without ambiguity the partition of Mg, P and Er in DNP. When increasing the Mg concentration, the Si concentration in DNP decreases, which helps explain the spectroscopic behavior of Er.
2. Experimentals
Preforms were fabricated by the conventional MVCD technique [13]. The so-called „solution doping technique‟ [14] was applied to incorporate magnesium and erbium ions: the core porous layer, doped with GeO2 and P2O5, is soaked with an alcoholic solution of ErCl3:6H2O and MgCl2:6H2O of desired concentrations. After drying of the solvent, the core layer is sintered down to a dense glass layer. Then the tube is collapsed into a solid rod, referred to as preform, at an elevated temperature higher than 1800 °C. Preforms are stretched into 125-µm fibers using a drawing tower at temperatures higher than 2000 °C under otherwise normal conditions. Here we report on samples labeled as Mg-0.1 and Mg-1, doped with solutions containing 0.1 and 1 mol/l of Mg salts, respectively. The erbium concentration of 0.01 mol/l was kept constant in the solution. The attenuation coefficient due to absorption by Er3+ ions at 1.53 µm was measured to be 9 dB/m in Mg-0.1. From this value and the estimated overlap between the guided mode and the doped region, the erbium ion concentration was estimated to be ~200 ppm. The concentrations of MgO, P2O5 and GeO2 are discussed in the next section. The core of the fiber is 8 and 10 µm in Mg-0.1 and Mg-1, respectively. Optical losses induced by the DNP have been discussed in a previous paper [8].
For the sample preparation, 200 fibers, side by side, were embedded longitudinally in a resin in a 10 mm diameter and 5mm height stub. The embedded fiber end face cleaved surfaces were then polished with a 3µm diamond paste. The sample was coated with a 40nm gold layer to allow for charge dissipations during SIMS analysis.
SIMS measurements were performed using the Nanosims50L instrument (Cameca) at PSSRI (Planetary and Space Sciences Research Institute), UK. A 16keV positive cesium ion beam was scanned over the sample. The size of the cesium beam on the sample was 60nm or 120nm depending on the resolution that needed to be achieved. The image was obtained by rastering the probe over the sample and recording the intensity variation of each secondary ion for every probe location. Small field images, 4µm×4µm were acquired with a probe of approximately 60nm and an array of 64×64 pixels. For larger images, 15µm×15µm, the probe size was 120nm and pixel array was 128×128. Image acquisitions were run as a serie of several scans at the rate of 100s per plane. The negative Secondary Ions (SI) of interest, Si-, P -, MgO-, Ge- and ErO-, sputtered from the same nanovolume, were simultaneously detected by 5 electron multipliers. In order to keep the SI transmission maximal, the mass resolution was set to less than 5000 since no mass interferences had to be resolved for the SI considered here. Nanosims50 data were analyzed with the software developed at the National Resource for Imaging Mass Spectrometry, Cambridge, USA.
3. Results and discussion
The distributions of the elements Ge and P in the core of the fiber are shown in Fig. 1. Germanium ions are distributed homogeneously over a ring in both fibers. The dark central part of the core is caused by the evaporation of germanium ions. This is a common artifact of the MCVD technique that can be corrected through process optimization. The diameter of the Ge-ring (which is assumed to be the core of the fiber) is 8 and 10 µm in Mg-0.1 and Mg-1, respectively. Phosphorus is clearly heterogeneously distributed and partly segregated within nanoparticles whose formation is known to be triggered by the incorporation of alkaline-earth ions [8,15]. In the case of Mg-1 it can be noticed that nanoparticles are not confined to the core (as for Mg-0.1) but also spread into the optical cladding which contains phosphorus. For clarity, the Mg distribution is not shown on these figures but matches the one for P. It is then assumed that, due to the higher content of Mg in Mg-1, this element can migrate outside the
core of the fiber and forms nanoparticles with the phosphorus ions present in the optical cladding.
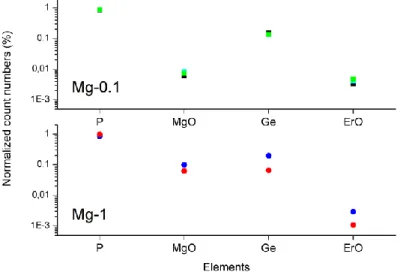
To compare the average global composition of the core of the fibers Mg-1 and Mg-0.1, number of counts for P, MgO, Ge and ErO were extracted from several 4µm×4µm SIMS zoomed images of the part of the fiber core containing the nanoparticles. More specifically, the data reported in figure 2 are the number of counts (×100) for a specific element extracted from the whole image normalized to the number of counts of all elements, i.e Np+NMgO+NErO+NGe. It is well known that the number of counts for a specific ion obtained in SIMS strongly depends on its chemical environment, its electron affinity and many other parameters. Then, we only compare the qualitative information relative to an element in both fibers. Conclusions regarding the relative elemental composition within one fiber are not possible from the present SIMS data. This type of study would require the use of various standards of known concentrations for P, Mg, Er and Ge [16].
Fig. 1 SIMS images of the cross-sections of the relative ion distribution of P (blue) and Ge (red) in the core of fibers doped with (a) 0.1 and (b) 1 mol/l of MgCl2. The area scanned is (a) 10 µm×10 µm and (b) 15 µm×15 µm. The images result from the sum of 150 planes. The acquisition time was 250 s/plane and the cesium probe current 1.8 pA.
Fig. 2. Intensity for various elements present in the core of the fibers Mg-1and Mg-0.1. The intensity is normalized to Np+NMgO+NErO+NGe where N represent the number of counts for a specific element. Data were extracted from 4µm×4µm SIMS images.
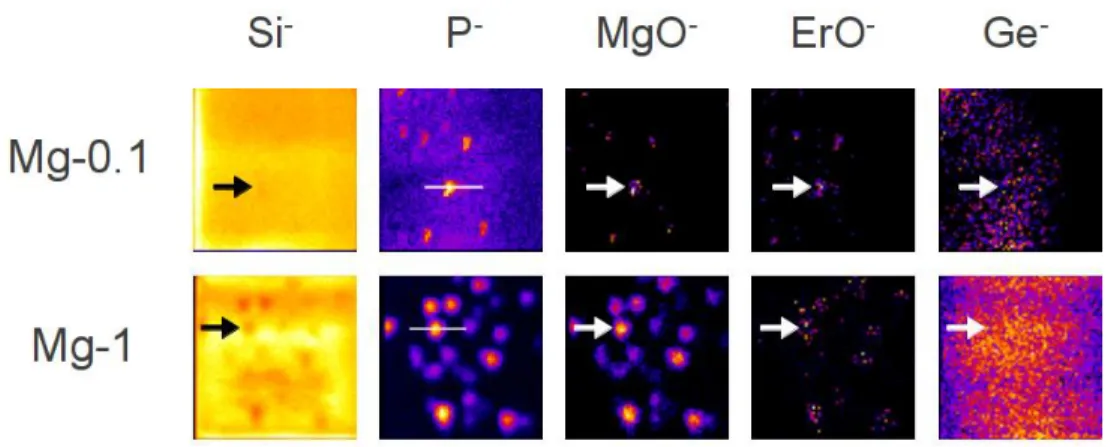
The results reported on Fig. 2 clearly indicate that the signal for P, Ge and Er are of the same magnitude for both fibers. However, the Mg signal is ten times lower in Mg-0.1 than in Mg-1. This result is not surprising since both fibers were fabricated with the same recipe, except for Mg whose concentration in the doping solution is ten times lower in Mg-0.1 than in Mg-1. The fiber compositions were also estimated from EPMA (Electron Probe Micro-Analyser) measurements and the results are in good agreement with that obtained from the SIMS analysis Indeed, it was found that P2O5, GeO2 and Er2O3 concentrations of approximately 0.35 mol%, 0.8 mol% and 200 ppm respectively are similar in both fibers. In the case of MgO, the concentration in Mg-0.1 and Mg-1 are estimated to be 0.1 mol% and 1.4 mol%, respectively. These results obtained from 2 different techniques show that the overall compositions of the fibers are the same, except for the Mg content.Fig 3 shows the 4µm×4µm zoomed SIMS images of the part of the core fiber containing the nanoparticles for the Si, P, MgO, ErO and Ge elements. Images are obtained from the sum of 11 and 21 acquisition planes for Mg-0.1 and Mg-1, respectively. P, Mg and Er elements are clearly partitioned into the phase-separated region whereas Germanium seems to be present at the same concentration, inside or outside the particles, for both fibers.
To further discuss the relative composition of the particles, we report the variation of the secondary ions intensity across the particles in Fig.4 for every element. These profiles correspond to the particles indicated by an arrow in Fig 3 and the line profile is shown as a white line in the P image.
Fig. 3. Spatial distributions of Si, P, Mg and Er elements in Mg-0.1 and Mg-1 measured by Nanosims50. Images are obtained from the sum of 11 planes for Mg-0.1 and 21 for Mg-1.
Image field is 4µm×4µm, 64×64 pixels. Cs+ Probe size is ~ 60nm diameter.
From the results reported on Fig. 4, P, Mg and Er signals present a maximum at the same position in the line scan which corresponds to the position for the particle. This maximum is associated to a minimum for the Si signal. The Ge signal intensity remains constant in both the particle and the matrix. It can be noticed that the width of the intensity distribution, clearly visible from the profiles for P and Mg elements, is twice as broad in fiber Mg-1 compared to Mg-0.1. This width is related to the size of the particles. For increased accuracy, the particle diameter was estimated from a depth profile analysis of the Phosphorus SIMS image rather than from the line scan. Briefly, in SIMS, the depth resolution is much better than the lateral resolution which is related to the size of the probe. Given the probe current (1pA) used to acquire the SIMS image of Fig. 4 and a dwell time of 20 ms/pixel, the thickness of the layer of atoms removed was estimated at 2nm/plane while the probe size was 60nm. Size measurements as well as characterization of the shape of the nanoparticles deduced from depth profile will be developed in another paper. Thus, the diameters of these two particles
were estimated to be 60 nm for the Mg-0.1 fiber and 170 nm for Mg-1. Note that the size of the smaller particle is close to the size of the probe. This point is important, since we want to compare the composition of the nanoparticles for fiber Mg-1 and Mg-0.1. Indeed, in this case we can reasonably assess that the maximum intensities in the line scan are due to signal from the nanoparticle itself and do not result from the convolution of the particle and matrix signal.
Fig. 4. Radial distribution of Si, P, MgO, Ge and ErO in the particles indicated by an arrow in Fig. 3. Each pixel corresponds to 64 nm. Count numbers were renormalized to the same number of planes, all other acquisition parameters being identicals. The error bar on the number of counts is 20% .
As the composition of SiO2 is expected to change from 99 to 98 % between Mg-0.1 and Mg-1 the Si signal far from the particle should be very close in both fibers. The difference is 15% less in Mg-0.1 compared to Mg-1 but remains within the estimated error bar of 20% on the number of counts. The error bar was derived from the variation of the Si signal in the matrix near the particles within the same image from several regions of interest. These variations are attributed to the effects of sample charging during SIMS analysis.
The Si signal presents a depletion in the particle area for both fibers. The Si signal is depleted by 5% when compared to the matrix for the fiber Mg-0.1 and by 20% for Mg-1. For P and Mg ions, the intensity in the particle is ~2 times and 10 times higher respectively in Mg-1 and Mg-0.Mg-1. It is worth noting that there is still phosphorous ions in the matrix in Mg-0.Mg-1, while this signal is at the limit of detection in Mg-1. Despite low count numbers for Er, it appears that the nanoparticles from the fiber of low Mg concentration contain more Er than that in the fiber of higher Mg concentration. This latter behavior can be explained by the fact that the overall erbium ion concentration is the same in both fibers while the nanoparticles volumic fraction is ten times higher in Mg-1 compared to Mg-0.1. If we assume that the entire erbium ions are partitioned into nanoparticles then we expect the erbium concentration to be lower in nanoparticles from fiber Mg-1 as observed in Fig. 4.
From these results we can conclude that, while the doping solution technique is usually used to prepare homogeneous core optical fiber, thermal treatments inherent to the MCVD process lead to a phase separation when an alkaline-earth element such as Mg is added to the doping solution. Through this mechanism, Er and Mg are totally partitioned within the
nanoparticles while the migration of P within the particles depends on the Mg concentration. Mg and P concentrations increase in the particles while Si content decreases when Mg concentration in the doping solution is increased..
The changes in the nanoparticle composition evidenced through this Nanosims50 analysis can be correlated with Er3+ ions spectroscopic properties reported previously [8]. Indeed, it has been observed that Er3+ spectroscopic features in Mg-0.1 were similar to those observed in silica glass while they shift to a phosphate-like behavior in the case of Mg-1.
4. Conclusion
To overcome some limitations inherent to silica glass with respect to spectroscopic properties of luminescent ions, optical fibers with a core containing luminescent ions doped nanoparticles have been developed. To understand the spectroscopic properties of the luminescent ions in these fibers, SIMS imaging at high spatial resolution (Nanosims50L) was used for the first time to assess the composition of nanoparticles diluted in a silica glass matrix in the core of optical fibers. In this work, SIMS evidenced the partitioning of P, Mg and Er into phase separated domains and demonstrated that the composition of the particle depends on the Mg concentration. The usual way to manage the transparency in fiber is based on a reduction of the nanoparticle size. However, in the process developed here, small particles are not desired as modifications of the Er3+ spectroscopy are observed only in big (>50 nm) particles. Then optimization of the process would tend to optimize a low particle density.
Acknowledgments
Authors greatly acknowledge Michèle Ude and Stanislaw Trzesien for the preparation of the preforms and fiber samples and Ivan Kasik for EPMA measurements realized at the Institute of Photonics and Electronics of the Academy of Sciences of the Czech Republic. This work is supported by a grant from ERA.Net RUS (Project TRANSLUCE). Authors also thank the Planetary and Space Science Research Institute (PSSRI), UK for granting Nanosims50L time to this project.