Tracer Experiment in a Brownfield
Using Geophysics and a Vadose
Zone Monitoring System
Natalia Fernández de Vera,* Jean Beaujean, Pierre
Jamin, Vivien Hakoun, David Caterina, Ofer Dahan,
Marnik Vanclooster, Alain Dassargues, Frédéric Nguyen,
and Serge Brouyère
A saline tracer infiltration test across the fractured vadose zone of an indus-trial contaminated site in Belgium was monitored by combining surface and cross-borehole electrical resistivity tomography (ERT) methods with a vadose zone monitoring system (VMS). The VMS provides in situ continuous hydraulic and chemical information on the percolating tracer at multiple depths in the vadose zone. The combination of such high-resolution data with time-lapse geophysical images that capture the spatiotemporal variability of the subsurface improves interpretations of flow and transport, providing a better characterization of infiltration mechanisms and preferential flow paths. The tracer infiltration test was performed over a heterogeneous vadose zone composed of backfilled materials, sands and silts, and unsaturated frac-tured chalk. Monitoring results during a 5-d period revealed the formation of a tracer plume in the upper backfilled deposits, while some of the tracer migrated laterally following preferential pathways. Slow vertical flow through matrix pores was found to be dominant under dry conditions. Infiltration of small quantities of rain during the test was found to have an influence on the spatial distribution of the plume. Results from long-term monitoring revealed vertical transport of the tracer toward depths that reached 4 m during a time period of 105 d. During that period, fracture and matrix flow mechanisms across the vadose zone were activated as a response to fre-quent rainfall episodes. The study demonstrates that the interpretation of geophysical images is improved by in situ information from the VMS.
Abbreviations: ERT, electrical resistivity tomography; FTDR, flexible time domain reflec-tometry; VMS, vadose zone monitoring system; VSP, vadose sampling port.
The detailed characterization of the contaminant distribution and percolation
mechanisms of industrial contaminated soils is particularly challenging. The presence of disturbed soil, artificial ground, and abandoned infrastructures modifies flow mecha-nisms in the vadose zone, generating preferential flows that are difficult to identify and quantify. Additionally, temporal and spatial coverage is required to capture the physical and biochemical changes of multiple contaminants in such a dynamic system (Atekwana et al., 2000).Electrical resistivity tomography (ERT) methods are suitable for flow and transport characterization because subsurface electrical properties are influenced by parameters such as solute concentration or water saturation (Slater et al., 2000; Johnson et al., 2013). Electrical resistivity tomography measurements allow monitoring of infiltrated water during precipitation events, which have an impact on contaminant transport across the vadose zone (Descloitres et al., 2008; Clément et al., 2009; Carrière et al., 2015). The combination of ERT methods with tracer tests allows the identification of prefer-ential flow paths and solute transport processes (Ptak et al., 2004; Robert et al., 2012). However, information provided by ERT measurements is limited by temporal and spatial data resolution. The loss of spatial resolution with depth that occurs when applying
Core Ideas
• Time-lapse ERT imaging was com-bined with VMS data in a brownfield. • The setup monitored an infiltrated
saline tracer across the vadose zone. • The spatial distribution of the tracer
was monitored with geophysics. • Flow mechanisms inferred from
VMS data improved subsoil characterization.
• Both technologies combined can improve site conceptual models.
N. Fernández de Vera, P. Jamin, V. Hakoun, A. Dassargues, and S. Brouyère, Dep. ArGenCo, Hydrogeology and Environmental Geology, Univ. of Liège, Quartier Polytech 1, Allée de la découverte 9- B52, 4000, Liège, Belgium; J. Beaujean and F. Nguyen, Dep. ArGenCo, Applied Geophysics, Univ. of Liege, Liège, Quartier Polytech 1, Allée de la découverte 9- B52, 4000, Belgium; D. Caterina, Institute of Bio- and Geosciences 3, Forschungszentrum, Wilhelm-Johnen-Straße, 52428 Jülich, Germany; O. Dahan, Dep. of Hydrology and Microbiology, Zuckerberg Institute for Water Research, Blaustein Institutes for Desert Research, Ben Gurion Univ. of the Negev, Sde Boker Campus, Negev 84990, Israel; M. Vanclooster, Earth and Life Institute—Environmental Sciences, Univ. Catholique de Louvain, Croix du Sud 2, 1348 Louvain-La-Neuve, Belgium. *Corresponding author ([email protected]). Vadose Zone J. doi:10.2136/vzj2016.06.0051 Received 10 June 2016. Accepted 16 Nov. 2016. Original Research Vol. 16, Iss. 1, 2017
© Soil Science Society of America 5585 Guilford Rd., Madison, WI 53711 USA. All rights reserved.
surface ERT techniques can be improved with the implemen-tation of cross-borehole geophysical methods (Cassiani et al., 2006; Nimmer et al., 2007; Wilkinson et al., 2010). However, the inversion of geophysical data and sensitivity to errors may still lead to a misinterpretation of ERT images (Singha and Gorelick, 2005). The development of time-lapse measurement techniques has improved the imaging of dynamic processes (e.g., Ramirez et al., 1996; Tsourlos et al., 2003; Singha and Gorelick, 2005; Vereecken et al., 2006, 2015; Miller et al., 2008; Coscia et al., 2012). However, the estimation of hydrological parameters from geophysical measurements is still a challenge. Day-Lewis et al. (2005) developed a sensitivity analysis to evaluate how the parameters that affect the resolution of tomograms influence quantitative hydrological estimations. Results from synthetic cases indicated that the application of petrophysical models to tomograms might produce erroneous estimates of hydrologic parameters in field applications. One of the main reasons for such errors is the fact that geophysical estimates represent local averages, providing poor estimations of point-scale hydrologic parameters. This was corroborated in field applications. Looms et al. (2008) used ground-penetrating radar and ERT methods to monitor a forced infiltration of a tracer across the subsurface of a field site in Denmark. In spite of obtaining substantial amounts of information that allowed the analysis of migration and vertical spreading of water and tracer mass, there was an overestimation of unsaturated transport parameters. Haarder et al. (2015) used ERT methods for long-term monitoring of saline tracer transport. They used time-lapse methods and calculated the tracer concen-tration and total mass inferred from resistivity values. Although the system was extremely useful in estimating recharge rates, there was an underestimation of the recovered mass of 50% with the ERT system compared with those from core values.
The application of ERT techniques has been successful in con-trolled laboratory experiments (e.g., Slater et al., 2000; Koestel et al., 2008; Masy et al., 2016). In spite of achievements, there is a limited spatial resolution in laboratory studies that cannot be extrapolated to field heterogeneities. Electrical resistivity tomog-raphy methods have been also used in field measurements based studies with undisturbed natural soil (e.g., Cassiani et al., 2006). However, the implementation of such techniques at industrial contaminated sites remains a challenge. Installation of electrodes in compacted artificial ground is problematic because achieving a good electrode contact is difficult. In some cases, the equipment cannot be left on site and repeatability of the measurements might be affected if electrodes are not installed in the exact same loca-tion (Miller et al., 2008). The presence of metallic abandoned infrastructures may alter subsurface conductivity (Johnson and Wellman, 2015), leading to artifacts and high error values that are problematic for geophysical interpretations. In addition, con-ductivity values are also altered by the complex hydrochemical interactions of contaminants in the subsurface (Atekwana et al., 2000), which complicates the design of tracer experiments.
Recent advances in vadose zone monitoring technologies have led to the design of devices that provide continuous measurements of rock water content and allow soil pore water sampling (Burns et al., 2000; Hubbell et al., 2002). Their implementation in intermedi-ate and deep vadose zones has been achieved through installation in vertical and slanted boreholes (Hubbell et al., 2002; Gee et al., 2003). One of the technologies, known as a vadose zone monitor-ing system (VMS), has been successfully applied to monitor vadose zone infiltration processes, providing unique data on the dynamics of water and contaminant infiltration in the vadose zone (Dahan et al., 2009, 2014; Rimon et al., 2011; Amiaz et al., 2011; Baram et al., 2013; Turkeltaub et al., 2015; Fernández de Vera et al., 2015). This system provides continuous hydraulic and chemical informa-tion across the vadose zone by inserting a flexible sleeve containing customized sensors into a slanted borehole.
In this study, we conducted a tracer infiltration experiment moni-tored via the combination of ERT methods and a VMS. The infiltration experiment was performed at an industrial contami-nated site in Belgium, over a vadose zone containing artificial backfill, sands and silts, and unsaturated fractured chalk. This is the first time that both technologies have been combined to monitor a tracer infiltration experiment in a complex fractured heterogeneous system, with the aim of understanding flow infiltra-tion mechanisms across a spatially variable subsurface.
6
Materials and Methods
Study Site
The study site is located at the northern flank of the Mons Basin, which is a large east–west-oriented syncline in the southwest of Belgium. The geology of the basin consists of a Paleozoic basement overlain discordantly by Mesozoic and Cenozoic deposits (Marlière, 1977; Faculté Polytechnique de Mons, 2000). Specifically, the experimental setup was positioned over the base of the Cretaceous chalk deposits. The formations are characterized by heterogeneous chalk levels from the St. Vaast and Maisières formations underlain by levels of flints and chalks (Hautrage formation). Such litholo-gies mark the transition to marl deposits containing chert nodules (Ville-Pomereuil formation) (Fig. 1).
The area of interest is located over the Cretaceous chalk aquifer, which is shallow and phreatic at this location and is encountered at depths that range from 6 to 15 m. The chalk is characterized by its dual-porosity and dual-permeability structure. The chalk matrix is characterized by high porosities (30–50%) but low hydraulic con-ductivities (5 ´ 10−8 to 5 ´ 10−10 m/s). Fractures in the chalk are
characterized by low porosities (0.5%) and larger hydraulic conduc-tivities (5 ´ 10−5 to 2 ´ 10−3 m/s) (Dassargues and Monjoie, 1993;
Barker and Wright, 2000; Brouyère et al., 2004). Preliminary stud-ies were performed with the aim of identifying fractures in the chalk at the study site. However, identification was not successful
because the chalk is strongly altered by the presence of flints and clays, which makes it quite heterogeneous.
Groundwater flows from north to south, although local fluctua-tions toward northwest to southeast direcfluctua-tions at the scale of the study site have been observed (Fig. 1). The groundwater table is located at 8 m below ground level, with seasonal fluctuations of up to a maximum of 3 m.
Soil and Groundwater Pollution
The study area is located at a former industrial site, where coal production and elaboration of byproducts coming from coal distil-lation were performed during the period of activity (1928–1997). The legacy of such activities led to soil and groundwater pollu-tion in the area. Results from soil sampling surveys revealed soils contaminated with heavy metals and polycyclic aromatic hydro-carbons (PAHs). Groundwater sampling campaigns have indicated groundwater contamination with cyanide, inorganic compounds (SO42−, NH
4+, Cl−, NO2−, and NO3−), and benzene, toluene,
eth-ylbenzene, and xylene (BTEX). At the area where the experiment was set up, soil and groundwater are affected by PAH and heavy metal contamination (Fig. 1).
Tracer Monitoring
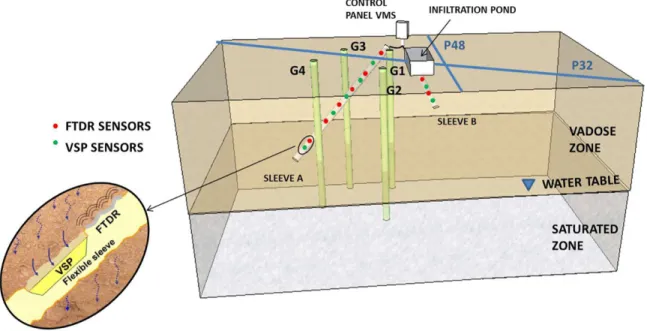
The tracer test was monitored with a setup that integrates geo-physical methods (surface and cross-borehole ERT) and a VMS (Fig. 2) (Fernández de Vera et al., 2015).
The tracer infiltration system consists of an infiltration pond with dimensions of 1.5-m length, 1-m width, and 0.50-m height. Two lines of electrodes were deployed near and across the infil-tration pond for surface ERT measurements, with the aim of characterizing the tracer as it percolates through shallow areas of the subsurface. A different electrode spacing was assigned to each line to retrieve images with different resolution and depths of investigation (Table 1). A line containing 48 electrodes (P48) was deployed parallel to the infiltration pond in the direction northwest to southeast, with an electrode spacing of 0.40 m and length of 20 m. Oblique to P48, a line of 32 electrodes (P32) with a spacing of 1.25 m was installed across the infiltration pond, ori-ented in the northeast to southwest direction and with a length of 40 m (Fig. 2).
Tracer characterization along deeper areas of the vadose zone was performed via cross-borehole ERT. Such methodology requires Fig. 1. Location of the study site, showing the local geology and hydrogeology along with the position of the experimental setup and delineated areas where contamination in soil and groundwater are presumed (according to Société Publique d’Aide à la Qualité de l’Environnement de la Région Wallonne, 2008).
electrode arrays installed in two or more boreholes. A single electrode consisted of a stainless steel ring attached to a 5-cm (2-inch)-diameter polyvinyl chloride tube. A cable was run up from the electrode to the surface (Cassiani et al., 2006). Four vertical boreholes (G1, G2, G3, and G4; Fig. 2) were drilled on site with lengths of 15 m each and an external diameter of 10 cm (4 inches). Each of the four boreholes installed on site was permanently equipped with 24 electrodes for ERT imaging, spaced vertically at intervals of 0.60 m. The borehole annular space was filled with a mixture of 25 kg of bentonite and 12.5 kg of cement to ensure contact with the surrounding formation. This proportion was chosen so that the resistivity values of the mixture would not differ
significantly from the background resistivity values (10–60 W m, according to preliminary studies of the site).
In situ continuous information on the chemical and hydraulic properties of the percolating tracer across the vadose zone was provided by a VMS. The VMS was designed and installed by Sensoil Innovation Ltd. (www.sensoils.com). The characteris-tics of this system, as well as its performance, installation, and application to different studies have been extensively covered in other publications (e.g., Dahan et al., 2009, 2014; Rimon et al., 2011; Baram et al., 2013; Turkeltaub et al., 2015). Therefore, only a brief description is presented here to avoid an overload of information. More details on its specific installation in the test site were provided by Fernández de Vera et al. (2015). The VMS system allows the attachment of monitoring units to the sidewall of an uncased slanted borehole (40°) of small diameter (150 mm). Monitoring units were customized and distributed along the length of a flexible sleeve. The sleeve was inserted into a slanted borehole to ensure contact with undisturbed lithologies, avoiding typical disturbances from vertical drilling. Upon insertion, the sleeve was filled with non-shrinking cement grout. Such filling leads to the sleeve expansion, ensuring a proper attach-ment of the monitoring units to the irregular walls of the borehole and preventing preferential flows along the borehole.
Two sleeves were equipped with monitoring units composed of flexible time domain reflectometry Fig. 2. The experimental setup: Two slanted boreholes are equipped with a vadose zone monitoring system (VMS). Each VMS is composed of a flexible sleeve containing vadose sampling ports (VSP) and flexible time domain reflectometry (FTDR) sensors. An infiltration system is installed on top of Sleeve B. Two lines of electrodes (P48 and P32) are deployed for surface geophysical measurements; G1, G2, G3, and G4 represent vertical boreholes for cross-borehole geophysical measurements. The figure is not to scale.
Table 1. Acquisition parameters for different geophysical profiles using electrical resis-tivity tomography (ERT).
Parameter Surface ERT P48 Surface ERT P32 Cross-borehole ERT
Electrode number 48 32 24 per borehole
Electrode spacing, m 0.4 1.25 0.6
Depth of investigation, m 4 8 15
Array dipole–dipole dipole–dipole bipole–bipole (AM-BN)
Infiltration, mA 100–200 100–200 100
Acquisition time, s 1 0.06 0.3
Delay time, s 0.8 0.8 0.1
Max. number of stacks 3 3 3
Min. number of stacks 2 2 2
Data points 1152 1152 1749
Error parameters
a, W 0.02 6.00 ´ 10−4 0.02
sensors (FTDR) and vadose zone sampling ports (VSP) (Fig. 2). Sleeve A had a length of 9.60 m and hosts six FTDR sen-sors and six VSP. Sleeve B had a length of 3.90 m and contains two FTDR sensors and two VSP. The FTDR sensors provided continuous measurements of volumetric water contents (every 15 min) obtained from permittivity interpretations via flexible waveguides (Dahan et al., 2003). The TDR measurements were conducted through an Acclima TDT time domain transmission electric circuit adapted for operation with flexible waveguides. Prior to installation, each individual sensor was calibrated to ensure a linear correlation to varying moisture content values (average R2 = 0.97) and the potential impact of soil type and
salinity. No salinity impact on water content measurements was observed to electrical conductivities of 20 mS/cm. The VSP are made of a flexible porous interface that enables hydraulic continuity between the inner sampling cell and the sediment pore water (Dahan et al., 2009). The mechanism that allows sampling water and tracer from the VSP is similar to standard tensiometers. However, it can be applied in hard rocks thanks to its flexible structure.
The infiltration pond was located above Sleeve B because Sleeve A was initially used for other types of studies (Fernández de Vera
et al., 2015).
Tracer Experiment
The saline tracer used in the experiment was prepared on site by mixing 50 kg of CaCl2 and 5 kg of LiCl in 600 L of water. The conductivity of the mixture (107.1 mS/cm) had a contrast of 60:1 with vadose zone waters (1.8 mS/cm) for detection with geophysical methods. Once mixed, the tracer was poured into the infiltration pond. The tracer test started on 23 May 2014. The height of the water was kept to a maximum of 20 cm to avoid leaks from the infiltration pond. Therefore, the infiltration was inter-rupted twice to avoid overflowing the infiltration system by letting the water infiltrate progressively. The last tracer infiltration step occurred at 16:20 h and by 20:31 h the entire tracer had infiltrated into the subsurface.
The design of the ERT image acquisition system aimed to alter-nate profiles with different resolutions and different depths of investigation, allowing characterization of tracer transport. Electrical data were acquired with an ABEM Terrameter LS device using dipole–dipole schemes with surface measurements and bipole–bipole schemes for cross-borehole measurements (Table 1). First, P48 measurements were made because the depth of investigation was expected to be shallower. Subsequently, mea-surements in P32 were performed, followed by cross-borehole geophysics (panel G1–G2). Two datasets were collected daily at each geophysical configuration from 23 to 27 May 2014 from P48, P32, G1 and G2. On 28 May 2014, cross-borehole measure-ments among boreholes G1, G2, G3, and G4 were made as well as one dataset collected from P48 and P32.
Inversion of the Electrical Resistivity
Tomography Dataset
A three-dimensional inversion of the background borehole dataset was performed and compared with 2.5-dimensional inversions. In this case, the three-dimensional inversion was not able to image certain lithological features detected during drilling (e.g., a flint layer located at 4 m). Due to the high number of parameters to resolve, the three-dimensional inversion smoothed the anomaly generated by the flint layer and did not have enough sensitivity to image it correctly. The 2.5-dimensional inversion, that contained fewer parameters, provided a stronger constraint that allowed imaging of the layer. Therefore, 2.5-dimensional inversion was chosen over the three-dimensional inversion in this study case because the latter did not provide additional information when compared with the 2.5-dimensional inversion.
Error Analysis
Previous to the tracer experiment, direct and reciprocal mea-surements were performed to assess the quality of the ERT data because the smoothness of the image depends on the dataset error level (LaBrecque et al., 1996). Errors might arise due to electrode contact, inaccuracies with the measurement device, or external errors (Perri et al., 2012). For this study, a linear error model was used to quantify the error parameters for the inversion. This method, which was used by Slater et al. (2000) and Singha and Gorelick (2005) among others, uses
= +
e a b R [1]
where a defines the minimum error, b is the increase in e with R, and R is the measured resistance. Parameters a and b were measured by removing outliers after the trend line that fitted all measurements was found. Table 1 shows parameters a and b cal-culated for each type of profile. Reciprocal measurements were only taken previous to the tracer test; no measurements were per-formed afterward. Their acquisition is time consuming and the lack of electricity onsite led to a limited number of measurements. Therefore, it was decided to prioritize the acquisition of data for time-lapse images over reciprocal measurements.
Depth of Investigation
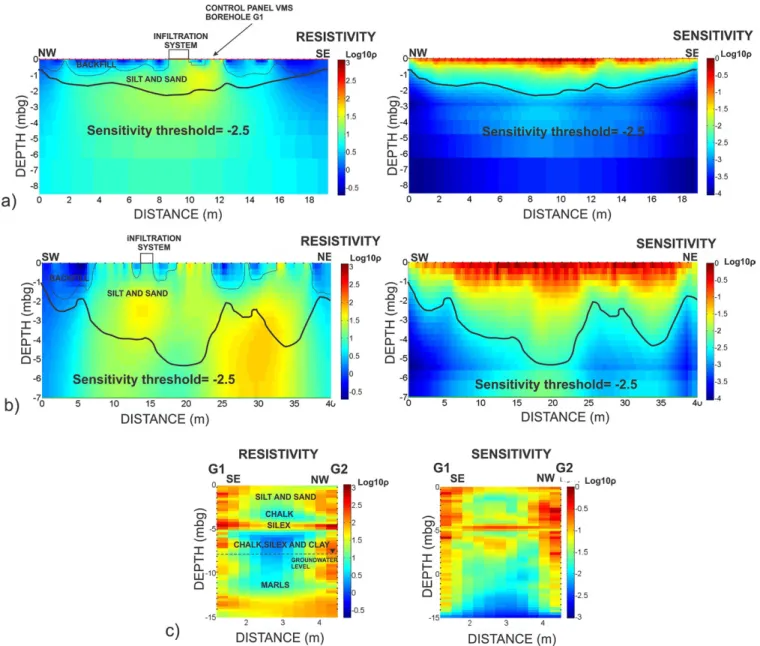
For surface electrodes, the resolution of tomographic profiles decreases with depth (Daily and Owen, 1991). To distinguish areas that are sufficiently resolved, the cumulative sensitivity is used (Nguyen et al., 2009; Caterina et al., 2013, Beaujean et al., 2014). Sensitivity shows how the data is influenced by model cell parameters (Kemna, 2000). Figure 3 shows the sensitivity thresh-olds along with the background resistivity images from surface and cross-borehole profiles. A sensitivity threshold of −2.5 was established for surface profiles. This is an arbitrary value that was chosen based on experience. For P48, the depth of investigation reached 1 to 1.5 m at the sides of the profile and 2 m at the central part. For P32, the depth of investigation was higher: 2 to 2.5 m at
the sides of the profile and up to 5.5 m at the center. The sensitivity of tomographic profiles for cross-borehole geophysics is higher in general due to the electrode setup; therefore, no sensitivity thresh-old was established for this configuration.
Background Resistivity Variations and
Time-Lapse Inversion
To discriminate variations in the ERT images due to the tracer from those related to ambient noise (Robert et al., 2012), time-lapse images from two different background measurements for each profile can be computed, and the percentage change in resis-tivity can be calculated. Such changes in resisresis-tivity provide a cutoff that separates anomalies produced by the temporal variations within the noise from those produced by the tracer infiltration. Previous to infiltration experiments, two different background
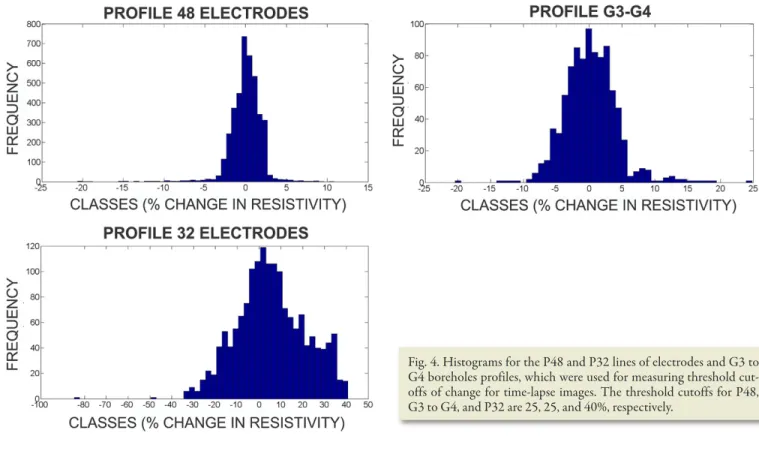
measurements were performed for surface and cross-borehole con-figurations. Background resistivity variations for each profile are presented in the form of histograms for the entire image (Fig. 4). Keeping error values low for this study was challenging due to the amount of artifacts produced at such a contaminated site and the difficulties in achieving good electrode contact in the artificial backfill. Therefore, conservative error values were chosen. For P48, the error values of change can reach between −20 and 15% error. With a conservative approach, it is considered that changes associated with background noise could be on the order of 25%. Background resistivity variations for P32 indicated a high amount of noise, as the error values of change were 40%. The P32 mea-surements might have been influenced by the installation of the infiltration system, which was performed simultaneously. Such influence might have caused such a high amount of noise. Fig. 3. Background resistivity images and sensitivity thresholds for the (a) P48 and (b) P32 lines of electrodes, and (c) resistivity images and sensitivity patterns are shown for Boreholes G1 to G2. A logarithmic scale has been chosen to represent resistivity values as opposed to a linear scale, as the image is visually clearer.
For cross-borehole geophysics, two background profiles for G1 and G2 were not available. However, they were available for the pair G3 and G4, 3.5 m away from G1 and G2. Results from histograms indicate a maximum error of 25%. The level of background varia-tions observed onsite was therefore one magnitude higher than reported elsewhere (e.g., Robert et al., 2012).
Time-lapse images were obtained by carrying out independent inversions that corresponded to the times of snapshots before, during, and after the infiltration test. Changes in resistivity were measured by subtracting pixel by pixel values from background images (Cassiani et al., 2006).
6
Results
Background Geophysical Images
Results from ERT imaging allow the characterization of the main lithological structures in the subsurface of the study area (Fig. 3). The presence of more resistive areas around the boreholes (Fig. 3c) indicates artifacts produced by borehole completion with bentonite and cement. However, such artifacts do not hinder the geological interpretation unless very saline water is present (Perri et al., 2012). In addition, their impact on time-lapse measurements was likely to be minimal because their measurements were practi-cally the same at all times, assuming that the tracer was not having a strong impact on the boreholes (Perri et al., 2012).
The upper area (0–1-m depth) is characterized by low to middle resis-tivity values, corresponding to the upper backfill deposits. The lateral
distribution of this layer is discontinuous; when present, thicknesses vary from 0.5 to 1 m. Beneath the backfill, silt and sand deposits are distributed heterogeneously, as reflected by higher resistivities. It is unclear whether such materials are part of the natural subsoil or were deposited during backfilling operations. In some areas, independent layers of homogenous sands and silts were encountered, whereas in other zones, sands and silts appeared to be mixed with chalk. The presence of chalk becomes more evident with increasing depth, result-ing in lower resistivity values. At the 4-m depth, an abrupt change in resistivity marks the presence of an accumulation of flints (1-m thickness), which are highly resistive compared with the chalk (Fig. 3c). Beneath the flints, clay was detected; the occurrence of both deposits is a consequence of chalk dissolution (Laignel et al., 1998). Low resistivity values were registered from 5 to 11 m, indicating the presence of chalk and clay materials. At the 11-m depth, the presence of marls is indicated by an increase in resistivity. The water table at the moment of the data acquisition was located at a depth of 7.8 m.
Monitoring Tracer Infiltration via
Time-Lapse Images and Vadose Zone
Monitoring System Information
Infiltration and Short-Term Monitoring (23–28 May 2014)
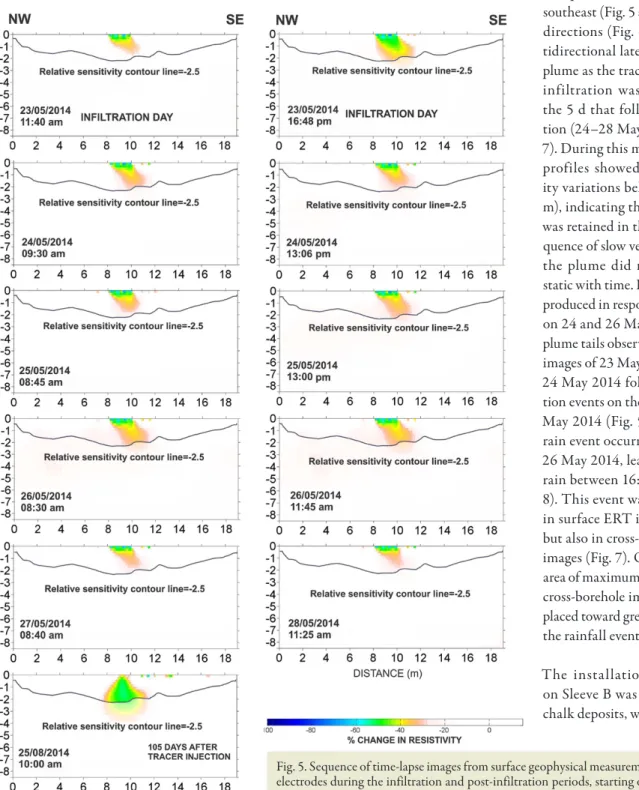
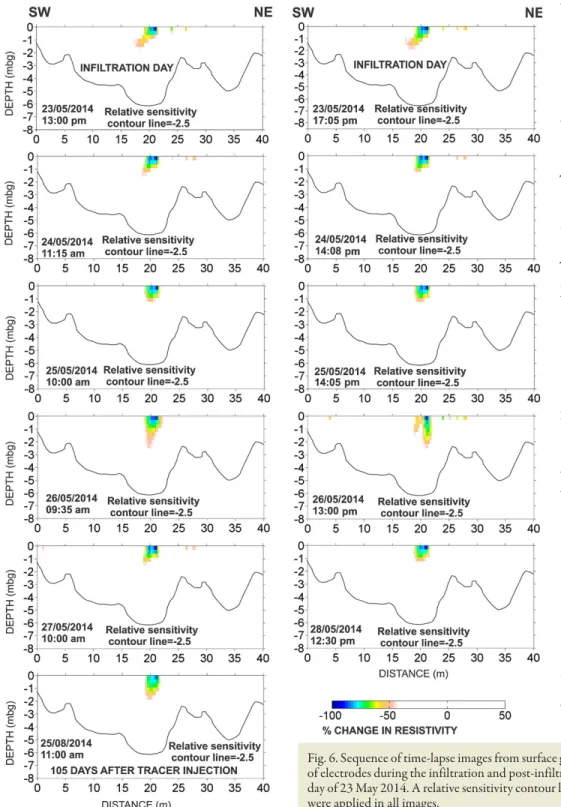
Tracer infiltration was monitored with time-lapse ERT measure-ments in P48 (Fig. 5), P32, (Fig. 6) and G1 to G2 (Fig. 7). The change in resistivity with respect to background resistivity values is shown in each time-lapse image. Maximum differences are expressed in the form of negative values because the tracer was more conductive than the background and therefore tended to decrease the measured resistivity.
Fig. 4. Histograms for the P48 and P32 lines of electrodes and G3 to G4 boreholes profiles, which were used for measuring threshold cut-offs of change for time-lapse images. The threshold cutcut-offs for P48, G3 to G4, and P32 are 25, 25, and 40%, respectively.
Two different filters were applied at each surface array from the sensitivity and background variation analysis. For the P48 electrode profile, a sensitivity cutoff of −2.5 was applied with a threshold cutoff for variations in resistivity <25%.The same sen-sitivity cutoff and a 40% error value were applied for P32. A 25% error was used for cross-borehole measurements.
The VMS sensors located in Sleeves A and B were used for moni-toring water contents and tracer concentrations. While Sleeve B was located directly below the pond infiltration, Sleeve A was
placed in the vicinity of the area where the infiltration took place (Fig. 2). Results from tracer infiltration monitoring mostly focus on information obtained from Sleeve B because most relevant information was found directly below the infiltration pond. Time-lapse ERT results from measurements performed during tracer infiltration (23 May 2014) revealed the formation of a plume in the subsurface with a non-uniform distribution of resis-tivity changes (Fig. 5, 6, and 7). The highest resisresis-tivity variations were located right beneath the infiltration system (60–80%).
The plume was oriented toward the southeast (Fig. 5 and 7) and southwest directions (Fig. 6), indicating a mul-tidirectional lateral expansion of the plume as the tracer infiltrated. Tracer infiltration was monitored during the 5 d that followed tracer applica-tion (24–28 May 2014; Fig. 5, 6, and 7). During this monitoring period, all profiles showed maximum resistiv-ity variations below the surface (0–1 m), indicating that most of the tracer was retained in the backfill as a conse-quence of slow vertical flow. However, the plume did not remain entirely static with time. Instead, changes were produced in response to rainfall events on 24 and 26 May 2014 (Fig. 8). The plume tails observed on surface profile images of 23 May 2014 diminished by 24 May 2014 following rain infiltra-tion events on the early morning of 24 May 2014 (Fig. 5 and 6). A stronger rain event occurred on the evening of 26 May 2014, leading to 12.8 mm of rain between 16:00 and 20:00 h (Fig. 8). This event was not only reflected in surface ERT images (Fig. 5 and 6) but also in cross-borehole geophysical images (Fig. 7). On 27 May 2014, the area of maximum resistivity changes in cross-borehole images was slightly dis-placed toward greater depths following the rainfall event on 26 May 2014. The installation of VMS sensors
on Sleeve B was performed to cross chalk deposits, with monitoring units Fig. 5. Sequence of time-lapse images from surface geophysical measurements at the P48 line of electrodes during the infiltration and post-infiltration periods, starting on the infiltration day of 23 May 2014. A relative sensitivity contour line of −2.5 and cutoff of 25% were applied in all images.
located at depth ranges from 1.58 to 2.96 m. Water samples from VSPs located at 2.04 and 2.96 m were retrieved daily from 22 to 28 May 2014. Lithium, Ca2+, and Cl− concentrations were
analyzed by capillary electrophoresis. No significant differences in concentrations were found during this period. This is an indi-cation that most of the tracer was retained in the backfill matrix, as indicated by geophysical images.
On 28 May 2014, additional geophysical measurements were per-formed in Boreholes G1, G2, G3, and G4 to determine the lateral
and vertical extent of the tracer (Fig. 9). The results revealed the existence of independent areas where resistivity variations were registered. These zones were separated from the main multidirec-tional plume. Such areas confirm the existence of preferential flow paths and tracer accumulation in other areas of the vadose zone as a consequence of subsurface heterogeneities.
Long-Term Monitoring after Tracer Infiltration Results from long-term monitoring revealed time variations of water contents in the unsaturated fractured chalk as a response to rainfall events. Rainfall infiltration was expressed through fast rises in water content subsequent to infiltration epi-sodes (Fig. 10). An almost instant response to rainfall events was regis-tered at different depths, as reflected by sharp changes in water content. There was a short delay between water arrival and drainage, and water was flowing to underlying materials almost instantly. This is an indication that water was bypassing the chalk matrix following preferential flow mechanisms.
After the short-term geophysical cam-paign was concluded, water samples were retrieved monthly during a long-term survey. In June and July 2014, no remarkable infiltration events occurred and ion concentrations from samplers located at 2.04 and 2.96 m did not increase notably. On 9 July 2014, 38.6 mm of rainwater percolated through the vadose zone. As a response to such a high infiltration event, fast water wetting and draining patterns were registered at 1.58 and 2.04 m, indicating the activation of preferen-tial flow through fractures. As a result of this event, an increase in Ca2+, Cl−,
and Li+ concentrations was registered
at depths that reached 2.96 m. On 25 Aug. 2014, surface and cross-borehole measurements were performed to monitor the spatial evo-lution of the tracer (Fig. 5, 6, 7, and 9). Results from these measurements Fig. 6. Sequence of time-lapse images from surface geophysical measurements at the P32 line of electrodes during the infiltration and post-infiltration periods, starting on the infiltration day of 23 May 2014. A relative sensitivity contour line of −2.5 and a cutoff threshold of 40% were applied in all images.
revealed vertical transport of the tracer plume as well as of tracer accumulated in separate areas. The tracer plume had expanded laterally with increasing depths (Fig. 5). The plume had reached the 4-m depth, as revealed by measurements from G1 to G2 (Fig. 7). High tracer concentrations were detected continuously for several months (up to January 2015) during a period in which frequent rain events were observed (Fig. 10).
Comparison of Electrical Resistivity
Tomography and Vadose Zone
Monitoring System Data
Electrical resistivity tomography provides information on the spa-tial distribution of the bulk electrical resistivity of the subsurface.
Basically, it is a function of the rock or sediment mineralogical composition, lithological structure, porosity, water content, and pore-water salinity among other variables (e.g., temperature). Nevertheless, in this setup, temporal variations in the ERT could be mainly attributed to changes in water content and pore-water salinity. These two variables could be monitored independently by the VMS at multiple points across the vadose zone. However, on comparison of observations made by ERT and VMS, one should note that these two methods provide different points of view to the subsurface. The ERT measurements are conducted at a time scale of minutes and are impacted by the bulk electrical properties of the entire domain. Moreover, they are sensitive to the cumu-lative impact of changes in matrix pore-water salinity and water content. However, the ERT method is less sensitive in depicting the impact of erratic and very localized flow and transport events that take place through preferential flow paths and fracture net-works. The reason for that is that the fractures and macropores in the unsaturated zone tend to drain quickly after infiltration events and impact only minor and insignificant volumes of the subsurface space. Therefore, the overall impact of the flow in a fracture network in the unsaturated rock on the general bulk elec-trical conductivity field may be insignificant, except if the ERT resolution is adapted to it. On the other hand, the VMS provides measurements of water content and pore-water salinity at specific points. Obviously some of these points might depict variations in the rock matrix, while others may be impacted by flow processes taking place in the fracture network according to the position of the monitoring units. Moreover, the salinity of the water samples collected by VSP represents the cumulative properties of a water sample that is collected during a time period of several days. As such, the sample is a mixture of both matrix flow and fracture flow. In spite of the limitations and advantages of each method, it has been hypothesized that an infiltration event with saline water should be Fig. 7. Sequence of time-lapse images from cross-borehole geophysical
measurements at G1-G2 during the infiltration and post-infiltration periods, starting on the infiltration day of 23 May 2014. A cutoff threshold of 25% was applied in all images.
Fig. 8. Rainfall registered on an hourly basis during the short-term monitoring period (23–28 May 2014).
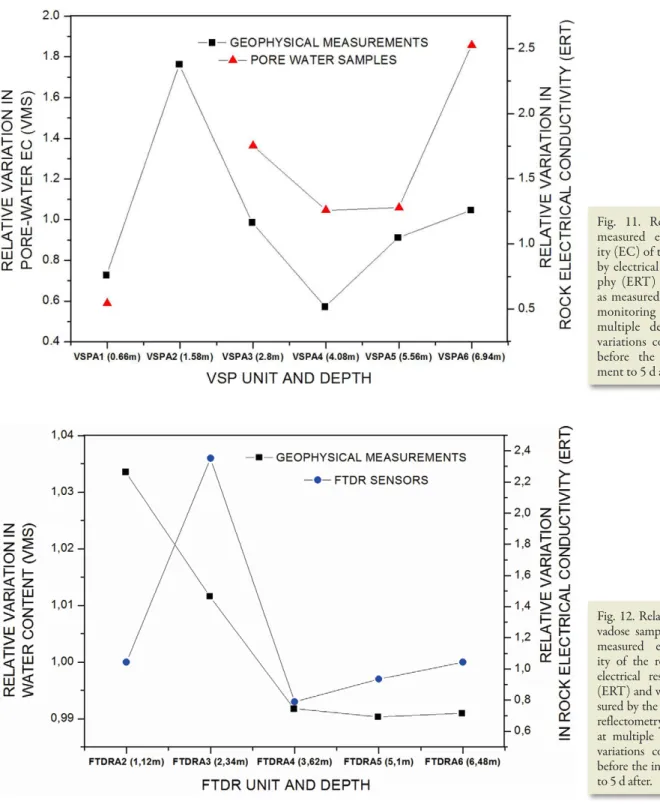
reflected in both visible changes in the electrical conductivity–resis-tivity field as measured by the ERT and as variations in both water content and salinity of the water samples obtained by the VMS. For the sake of comparison, relative variations in ERT field at the points where the VMS monitoring units are located were compared with the actual measurements of water content and pore-water salinity as obtained by the VMS. The comparison was based on ERT measure-ments obtained from sensors located on boreholes G1 and G4 and Sleeve A because these are located approximately on the same plane (Fig. 2). The comparison is presented as the relative variation in the electrical conductivity (EC) of the field as obtained by the ERT com-pared with the EC values of the pore water as obtained by the VSP at different depths (Fig. 11). Apparently, the general trend in the variation of bulk conductivity (ERT) followed the variation in the pore-water salinity at most depths, except 1.58 m (VSPA2), which did not provide a water sample at this particular sampling date. On the other hand, only partial correspondence between the variation in the ERT conductivity field and the variation in water content was observed (Fig. 12). Nevertheless, this weak correspondence is not surprising because the general change in water content during this period was very small.
6
Discussion
Results from the VMS and geophysical data revealed that the spa-tial distribution and transport of the tracer across the vadose zone was strongly influenced by rainfall infiltration. Flow mechanisms are governed by the textural properties and water contents of dif-ferent vadose zone deposits.
The response of backfill deposits to the infiltration of high quanti-ties of tracer led to ponding and slow vertical flow (Hendrickx and Flury, 2001) as well as to a heterogeneous distribution of tracer con-centrations (Fig. 5, 6, and 7). When tracer enters backfill macropores, a fraction of the tracer is absorbed by the backfill matrix through the macropore walls, whereas the rest percolates vertically via gravitational forces (Hendrickx and Flury, 2001; Guebert and Gardner, 2001). The differences in hydraulic conductivities between the backfill and the underlying silt and sand deposits led to tracer ponding at the layer boundary. Therefore, most of the tracer was retained in the backfill micro- and macropores, constituting the main plume, which is identi-fied in Fig. 5, 6, 7, and 9. Lateral propagation of the tracer occurred via connected voids in the backfill. Part of the tracer that migrates laterally might accumulate in separate areas if preferential flow paths are encountered, as shown by separated resistivity areas in the cross-borehole images (Fig. 9). During dry periods, the tracer located at the borders of the saturated plume was slowly displaced through the matrix pores toward less saturated zones following pressure differences and gravitational forces (e.g., Fig. 5 and 6, 26 May 2014).
Smaller infiltration episodes produced by rainfall infiltration led to vertical percolation of water, modifying the tracer distribu-tion in the subsurface. Water infiltradistribu-tion from rainfall episodes might dilute or drain the tracer plume tail toward greater depths, depending on the frequency and intensity of the events (Fig. 5 and 6, 26–27 May 2014). Water drainage subsequent to rainfall events enhanced tracer movement across the matrix front (Fig. 7, 27 and 28 May 2014). If the amount of infiltrated water overcomes the retention capacity of the matrix as a consequence of a highly Fig. 9. Sequence of changes in electrical resistivity measured in Boreholes G1, G2, G3, and G4 in May (left) and August 2014 (right). A cutoff of 25% was applied in all panels.
intensive rainfall event, preferential flow is activated and the tracer is transferred to greater depths. Long-term monitoring results show that tracer propagation reached chalk deposits via matrix and fracture flows, as the plume reached the 4-m depth according to geophysical information (Fig. 7, 25 Aug. 2014) and tracer was detected in waters collected from fractures by the VSP.
A considerable number of tracer test experiments have been per-formed under field conditions for the purposes of hydrologic characterization in the vadose zone (e.g., Binley et al., 2001, 2002;
Cassiani and Binley 2005; Winship et al., 2006; Deiana et al., 2008; Looms et al., 2008). To our knowledge, most of these studies could not be validated with in situ information on the tracer as it leached across the vadose zone. In some cases, tracer concentrations were estimated indirectly from geophysical measurements. For example, Winship et al. (2006) calculated pore water concentrations by com-bining ERT and ground-penetrating radar tomograms. Looms et al. (2008) calculated tracer concentrations by combining images of moisture content and electrical resistivity. In this study, the infor-mation provided from VSP sensors has allowed the validation of Fig. 10. Variations in water content and ion concentrations at different depths of the vadose zone as a response to infiltration events, starting on the infiltration day of 23 May 2014. The top graph represents the effective infiltration. Below, evolution of water content at 1.58 and 2.50 m is represented. At 2.04 and 2.96 m, the evolution of Ca2+, Cl−, and Li+ concentrations (indicated by CONC.) is shown; Li+ concentrations are shown on the right
side of the concentration graphs, as their magnitude was too low compared with those of Ca2+ and Cl−. The dotted lines indicate the periods at which
time-lapse images with in situ information on tracer concentrations across the vadose zone. In addition, the hydraulic information pro-vided from FTDR sensors has allowed assessment of how recharge episodes have affected the spatial distribution and vertical trans-port of the tracer in the subsurface. This experimental setup has the potential for installation under different contexts other than industrial sites. In this case, the experimental setup has been tested in unsaturated fractured rocks. Both the geophysical setup and the VMS have been used successfully in other field applications compris-ing different lithologies such as clay, gravels, and sands (e.g., Cassiani and Binley, 2005; Looms et al., 2008; Rimon et al., 2011; Baram et
al., 2013; Dahan et al., 2014). Therefore, the experimental setup is suitable for installation at other sites comprising a variety of litholo-gies. In addition, customized sensors and electrodes can be adapted for the conditions of the specific site. The VMS has the potential for including new types of sensors for the purposes of different studies.
6
Summary and Conclusions
The combination of geophysical methods and a VMS was used to characterize the transport of a saline tracer as it was infiltrated through the vadose zone of an industrial contaminated site.
Fig. 11. Relative variation in measured electrical conductiv-ity (EC) of the rock as measured by electrical resistivity tomogra-phy (ERT) and pore-water EC as measured by the vadose zone monitoring system (VMS) at multiple depths. The relative variations compare values from before the infiltration experi-ment to 5 d after.
Fig. 12. Relative variation among vadose sampling ports (VSP) in measured electrical conductiv-ity of the rock as measured by electrical resistivity tomography (ERT) and water content as mea-sured by the flexible time domain reflectometry (FTDR) sensors at multiple depths. The relative variations compare values from before the infiltration experiment to 5 d after.
Results revealed the development of a plume in the subsurface with high resistivity variations beneath the infiltration system and lower differences toward the borders of the plume. Measurements per-formed during a short term period (5 d) revealed that the tracer plume accumulated within the backfill pores at shallow depth (0–1 m) as a consequence of slow vertical flow through matrix pores. Such flow was enhanced by infiltration associated with rain events. Measurements performed during a longer period (3 mo) revealed that high-intensity rainfall episodes, such as the one that occurred on the 09 July 2014, constitute one of the main factors favoring vertical transport through matrix and fractures. Such a high intensive rainfall episode that occurred in a dry period acti-vated fracture and matrix flow, and tracer was transported toward deeper depths, reaching 4 m.
From such information, some conclusions can be drawn regarding the fate and transport of contaminants across the vadose zone of the study site. Contaminants transported via preferential flow mecha-nisms can reach the groundwater within hours during or after rain infiltration events. However, if matrix flow mechanisms are domi-nant, contaminant transport is slower. In the absence of rainfall episodes, it could take months for the pollutant to be transferred through the matrix of the backfill, silts, sands, and chalk before it reaches the saturated zone. Contaminant leaching in the vadose zone is controlled by the frequency of infiltration events from rain episodes and water distribution between the matrix and fractures. The results obtained from the combination of both geophysics and the VMS revealed not only that infiltration across the vadose zone is not uniform but also the strong influence of recharge processes in the activation of flow mechanisms in the vadose zone. The sampling capabilities of the VMS allowed a more specific understanding of how such recharge has a direct influence in the vadose zone. The combination of both geophysical and VMS data was essential to interpret tracer flow and transport throughout the vadose zone. Geophysical methods were successful in characterizing the spa-tial distribution of the tracer in the subsurface. However, surface measurements provided by P32 were found to have limited spatial resolution due to the presence of artifacts and a high amount of noise. At other industrial sites, a different approach such as time-lapse inversion of ratio or focused time-time-lapse inversion (Rosas Carbajal et al., 2012; Vignoli et al., 2015; Nguyen et al., 2016) might be considered, as they have proven to be successful in avoid-ing inversion artifacts.
Long-term measurements provided by the VMS were crucial to understand tracer transport mechanisms across the vadose zone. Without the VMS data, it would have been difficult to have a pre-cise interpretation of the changes observed in geophysical images. Therefore, based on the results, it is clear that the combination
of both techniques is of great use when assessing contaminant transport at contaminated sites. However, improvements must be
achieved to minimize errors that might arise when performing geophysical measurements in such sites. This could be improved by performing more background measurements.
Acknowledgments
This research was completed within the framework of the Marie Curie Initial Training Net-work ADVOCATE—Advancing Sustainable In Situ Remediation for Contaminated Land and Groundwater, funded by the European Commission, Marie Curie Actions Project no. 265063. Vivien Hakoun acknowledges the support of the European Research Council (ERC) through the project MHetScale (Grant no. 617511).
References
Amiaz, Y., S. Sorek, Y. Enzel, and O. Dahan. 2011. Solute transport in the vadose zone and groundwater during flash floods. Water Resour. Res. 47:W10513. doi:10.1029/2011WR010747
Atekwana, E.A., W.A. Sauck, and D.D. Werkema, Jr. 2000. Investigations of geoelectrical signatures at a hydrocarbon contaminated site. J. Appl. Geophys. 44:167–180. doi:10.1016/S0926-9851(98)00033-0
Baram, S., Z. Ronen, D. Kurtzman, C. Kulls, and O. Dahan. 2013. Desicca-tion-crack-induced salinization in deep clay sediment. Hydrol. Earth Syst. Sci. 17:1533–1545. doi:10.5194/hess-17-1533-2013
Barker, J.A., and T.E. Wright. 2000. A pulsed-velocity method of double-porosity solute transport modelling. IAHS Publ. 262:297–302.
Beaujean, J., F. Nguyen, A. Kemna, A. Antonsson, and P. Engesgaard. 2014. Calibration of seawater intrusion models: Inverse parameter es-timation using surface electrical resistivity tomography and borehole data. Water Resour. Res. 50:6828–6849. doi:10.1002/2013WR014020 Binley, A., G. Cassiani, R. Middleton, and P. Winship. 2002. Vadose zone
flow model parameterisation using cross-borehole radar and resistiv-ity imaging. J. Hydrol. 267:147–159. doi:10.1016/S0022-1694(02)00146-4 Binley, A., S.S. Hubbard, J.A. Huisman, A. Revil, D.A. Robinson, K. Singha,
and L.D. Slater. 2015. The emergence of hydrogeophysics for im-proved understanding of subsurface processes over multiple scales. Water Resour. Res. 51:3837–3866. doi:10.1002/2015WR017016
Binley, A., P. Winship, R. Middleton, M. Pokar, and J. West. 2001. High-reso-lution characterization of vadose zone dynamics using cross-borehole radar. Water Resour. Res. 37:2639–2652. doi:10.1029/2000WR000089 Brouyère, S., A. Dassargues, and V. Hallet. 2004. Migration of
contami-nants through the unsaturated zone overlying the Hesbaye chalky aquifer in Belgium: A field investigation. J. Contam. Hydrol. 72:135–164. doi:10.1016/j.jconhyd.2003.10.009
Burns, H.H., D. Wyatt, M. Maryak, T. Butcher, J. Cook, B. Looney, et al. 2000. The Savannah River Site vadose zone monitoring system. Paper present-ed at: Waste Management Symposia (WM’00), Tucson, AZ. 27 Feb.–2 Mar. 2000. http://www.wmsym.org/archives/2000/pdf/06/6-4.pdf Carrière, S.D., K. Chalikakis, C. Danquigny, R. Clèment, and C. Emblach.
2015. Feasibility and limits of electrical resistivity tomography to moni-tor water infiltration through karst medium during a rainy event. In: B. Andreo et al., editors, Hydrogeological and environmental investiga-tions in karst systems. Environ. Earth Sci. Ser. 1. Springer, Berlin. p. 45–55. doi:10.1007/978-3-642-17435-3_6.
Cassiani, G., and A. Binley. 2005. Modeling unsaturated flow in a layered formation under quasi-steady state conditions using geophysical data constraints. Adv. Water Resour. 28:467–477. doi:10.1016/j.advwatres.2004.12.007
Cassiani, G., V. Bruno, A. Villa, N. Fusi, and A.M. Binley. 2006. A saline trace test monitored via time-lapse surface electrical resistivity tomography. J. Appl. Geophys. 59:244–259. doi:10.1016/j.jappgeo.2005.10.007 Caterina, D., J. Beaujean, T. Robert, and F. Nguyen. 2013. A comparison
study of different image appraisal tools for electrical resistivity tomog-raphy. Near Surf. Geophys. 11:639–657. doi:10.3997/1873-0604.2013022 Clément, R., M. Descloitres, T. Günther, O. Ribolzi, and A. Legchen-ko. 2009. Influence of shallow infiltration on time-lapse ERT: Ex-perience of advanced interpretation. C. R. Geosci. 341:886–898. doi:10.1016/j.crte.2009.07.005
Coscia, I., N. Linde, S. Greenhalgh, T. Vogt, and A. Green. 2012. Estimating travel times and groundwater flow patterns using 3D time-lapse cross-hole ERT imaging of electrical resistivity fluctuations induced by infiltrat-ing river water. Geophysics 77:E239–E250. doi:10.1190/geo2011-0328.1 Dahan, O., A. Babad, N. Lazarovitch, E.E. Russak, and D. Kurtzman. 2014.
Nitrate leaching from intensive organic farms to groundwater. Hydrol. Earth Syst. Sci. 18:333–341. doi:10.5194/hess-18-333-2014
Dahan, O., E. McDonald, and M. Young. 2003. Development of a flexible TDR probe for deep vadose zone monitoring. Vadose Zone J. 2:270– 275. doi:10.2113/2.2.270
Dahan, O., R. Talby, Y. Yechieli, E. Adar, N. Lazarovitch, and Y. En-zel. 2009. In situ monitoring of water percolation in layered soils us-ing a vadose zone monitorus-ing system. Vadose Zone J. 8:916–925. doi:10.2136/vzj2008.0134
Daily, W.D., and E. Owen. 1991. Cross-borehole resistivity tomography. Geophysics 56:1228–1235. doi:10.1190/1.1443142
Dassargues, A., and A. Monjoie. 1993. Chalk as an aquifer in Belgium. In: R.A. Downing et al., editors, Hydrogeology of the chalk of north-west Europe. Oxford Univ. Press, Oxford, UK. p. 153–169.
Day-Lewis, F.D., K. Singha, and A.M. Binley. 2005. Applying petrophysi-cal models to radar travel time and electripetrophysi-cal resistivity tomograms: Resolution-dependent limitations. J. Geophys. Res. 110:B08206. doi:10.1029/2004JB003569.
Deiana, R., G. Cassiani, A. Villa, A. Bagliani, and V. Bruno. 2008. Calibra-tion of a vadose zone model using water injecCalibra-tion monitored by GPR and electrical resistance tomography. Vadose Zone J. 7:215–226. doi:10.2136/vzj2006.0137
Descloitres, M., O. Ribolzi, Y. Le Troquer, and J.-P. Thiébaux. 2008. Study of water tension differences in heterogeneous sandy soils using surface ERT. J. Appl. Geophys. 64:83–98. doi:10.1016/j.jappgeo.2007.12.007 Faculté Polytechnique de Mons. 2000. Etude de la pollution des aquifères
du bassin de Mons en aval du site Carbochimique à Tertre. Report. Ministère de la Région Wallonne, Direction Générale des Ressources Naturelles et de l’Environnement, Namur, Belgium.
Fernández de Vera, N., O. Dahan, A. Dassargues, M. Vanclooseter, F. Nguyen, and S. Brouyére. 2015. Vadose zone characterization at in-dustrial contaminated sites. ADVOCATE Bull. 7. CL:AIRE, London. Gee, G.W., L.A. Ward, J.B. Sisson, J.M. Hubbell, D.A. Myers, and H.A.
Sydnor. 2003. Hydrologic characterization using vadose zone moni-toring tools: Status report. Pac. Northw. Natl. Lab., Richland, WA. doi:10.2172/15010103
Guebert, M.D., and T.W. Gardner. 2001. Macropore flow on a reclaimed surface mine: Infiltration and hillslope hydrology. Geomorphology 39:151–169. doi:10.1016/S0169-555X(00)00107-0
Haarder, E.B., K.H. Jensen, A. Binley, L. Nielsen, T. Uglebjerg, and M. Looms. 2015. Estimation of recharge from long-term monitoring of saline trac-er transport using electrical resistivity tomography. Vadose Zone J. 14(7). doi:10.2136/vzj2014.08.0110
Hendrickx, J.M.H., and M. Flury. 2001. Uniform and preferential flow mechanisms in the vadose zone. In: conceptual models of flow and transport in the fractured vadose zone. Natl. Acad. Press, Washing-ton, DC. p. 149–187.
Hubbell, J.M., E.D. Mattson, J.B. Sisson, and S.O. Magnuson. 2002. Under-standing fluid and contaminant movement in the unsaturated zone using the INNEEL vadose zone monitoring system. Paper presented at: Waste Management Symposia (WM’02), Tucson, AZ. 24–28 Feb. 2002. http://www.wmsym.org/archives/2002/Proceedings/28B/413.pdf Johnson, T.C., J. Greenwood, C. Strickland, M. Truex, V. Freedman, G.
Chronister, and D. Rucker. 2013. 3D characterization and time-lapse imaging of the desiccation treatability test at the Hanford BC-cribs and trenches site using high performance computing applied to electrical resistivity imaging. Paper presented at: Waste Manage-ment 2012 Conference (WM2012), Phoenix, AZ. 26 Feb. –1 Mar. 2012. http://www.wmsym.org/archives/2012/papers/12271.pdf
Johnson, T.C., and D.M. Wellman. 2015. Accurate modeling and inversion of electrical resistivity data in the presence of metallic infrastructure with known location and dimension. Geophys. J. Int. 202:1096–1108. doi:10.1093/gji/ggv206
Kemna, A. 2000. Tomographic inversion of complex resistivity: Theory and application. Ph.D. diss. Ruhr-Univ. of Bochum, Bochum, Germany. Koestel, J., A. Kemna, M. Javaux, A. Binley, and H. Vereecken. 2008.
Quantitative imaging of solute transport in an unsaturated and undisturbed soil monolith with 3D ERT and TDR. Water Resour. Res. 44:W12411. doi:10.1029/2007WR006755
LaBrecque, D.J., M. Miletto, W. Daily, A. Ramirez, and E. Owen. 1996. The effects of noise on Occam’s inversion of resistivity tomography data. Geophysics 61:538–548. doi:10.1190/1.1443980
Laignel, B., F. Quesnel, J.J. Macaire, and R. Meyer. 1998. Relations quantitatives entre les craies à silex et les formations résiduelles à silex de l’ouest du Bassin de Paris. Geodin. Acta 11:171–181. doi:10.1016/S0985-3111(98)80003-X
Looms, M.C., K.H. Jensen, A. Binley, and L. Nielsen. 2008. Monitoring unsat-urated flow and transport using cross-borehole geophysical methods. Vadose Zone J. 7:227–237. doi:10.2136/vzj2006.0129
Marlière, R. 1977. Carte géologique de la Belgique à l’échelle 1:25,000 no. 139, Beloeil-Baudour. Service Géologique de Belgique, Brussels. Masy, T., D. Caterina, O. Tromme, B. Lavigne, P. Thonart, S. Hiligsmann,
and F. Nguyen. 2016. Electrical resistivity tomography to moni-tor enhanced biodegradation of hydrocarbons with
Rhodococ-cus erythropolis T902.1 at a pilot scale. J. Contam. Hydrol. 184:1–13.
doi:10.1016/j.jconhyd.2015.11.001
Miller, C.R., P.S. Routh, T.R. Brosten, and J.P. McNamara. 2008. Application of time-lapse ERT imaging to watershed characterization. Geophysics 73:G7–G17. doi:10.1190/1.2907156
Nguyen, F., A. Kemna, A. Antonsson, P. Engesgaard, O. Kuras, R. Ogilvy, et al. 2009. Characterization of seawater intrusion using 2D electrical im-aging. Near Surf. Geophys. 7:377–390. doi:10.3997/1873-0604.2009025 Nguyen, F., A. Kemna, T. Robert, and T. Hermans. 2016. Data-driven
selec-tion of the minimum-gradient support parameter in time-lapse focused electrical imaging. Geophysics 81:A1–A5. doi:10.1190/geo2015-0226.1 Nimmer, R.E., J.L. Osiensky, A.M. Binley, K.F. Sprenke, and B.C. Williams.
2007. Electrical resistivity imaging of conductive plume dilution in frac-tured rock. Hydrogeol. J. 15:877–890. doi:10.1007/s10040-007-0159-z Perri, M.T., G. Cassiani, I. Gervasio, R. Deiana, and A.M. Binley. 2012. A
saline tracer test monitored via both surface and cross-borehole elec-trical resistivity tomography: Comparison of time-lapse results. J. Appl. Geophys. 79:6–16. doi:10.1016/j.jappgeo.2011.12.011
Ptak, T., M. Piepenbrink, and E. Martac. 2004. Tracer tests for the investi-gation of heterogeneous porous media and stochastic modelling of flow and transport: A review of some recent developments. J. Hydrol. 294:122–163. doi:10.1016/j.jhydrol.2004.01.020
Ramirez, A., W. Daily, A. Binley, D.J. LaBrecque, and D. Roelant. 1996. Detection of leaks in underground storage tanks using electrical re-sistance tomography methods. J. Environ. Eng. Geophys. 1:189–203. doi:10.4133/JEEG1.3.189
Rimon, Y., R. Nativ, and O. Dahan. 2011. Physical and chemical evidence for pore-scale dual-domain flow in the vadose zone. Vadose Zone J. 10:322–331. doi:10.2136/vzj2009.0113
Robert, T., D. Caterina, J. Deceuster, O. Kaufmann, and F. Nguyen. 2012. A salt tracer test monitored with surface ERT to detect preferential flow and transport paths in fractured/karstified limestones. Geophys-ics 77:B55–B67. doi:10.1190/geo2011-0313.1
Rosas Carbajal, M., N. Linde, and T. Kalscheuer. 2012. Focused time-lapse inversion of radio and audio magnetotelluric data. J. Appl. Geophys. 84:29–38. doi:10.1016/j.jappgeo.2012.05.012
Singha, K., and S.M. Gorelick. 2005. Saline tracer visualized with three-dimensional electrical resistivity tomography: Field-scale moment analysis. Water Resour. Res. 41:W05023. doi:10.1029/2004WR003460 Slater, L., A.M. Binley, W. Daily, and R. Johnson. 2000. Cross-hole
electri-cal imaging of a controlled saline tracer infiltration. J. Appl. Geophys. 44:85–102. doi:10.1016/S0926-9851(00)00002-1
Société Publique d’Aide à la Qualité de l’Environnement de la Région Wallonne. 2008. Rapport Annuel 2008. SPaQuE, Liege, Belgium. Tsourlos, P., R. Ogilvy, P. Meldrum, and G. Williams. 2003. Time-lapse
moni-toring in single boreholes using electrical resistivity tomography. J. En-viron. Eng. Geophys. 8:1–14. doi:10.4133/JEEG8.1.1
Turkeltaub, T., D. Kurtzman, G. Bel, and O. Dahan. 2015. Examina-tion of groundwater recharge with a calibrated/validated flow model of the deep vadose zone. J. Hydrol. 522:618–627. doi:10.1016/j.jhydrol.2015.01.026
Vereecken, H., A. Binley, G. Cassiani, A. Revil, and K. Titov, editors. 2006. Applied hydrogeophysics. NATO Sci. Ser. IV. Springer, Dordrecht, the
Netherlands.
Vignoli, G., G. Fiandaca, A.V. Christiansen, C. Kirkegaard, and E. Auken. 2015. Sharp spatially constrained inversion with applications to transient electromagnetic data. Geophys. Prospect. 63:243–255. doi:10.1111/1365-2478.12185
Wilkinson, P.B., P.I. Meldrum, O. Kuras, J.E. Chambers, S.J. Holyoake, and R.D. Ogilvy. 2010. High-resolution electrical resistivity tomography monitoring of a tracer test in a confined aquifer. J. Appl. Geophys. 70:268–276. doi:10.1016/j.jappgeo.2009.08.001
Winship, P., A. Binley, and D. Gomez. 2006. Flow and transport in the unsaturated Sherwood sandstone: Characterization using cross-borehole geophysical methods. Geol. Soc. Spec. Publ. 263:219–231. doi:10.1144/GSL.SP.2006.263.01.12