MONITORING OF SUBARCTIC SHRUB VEGETATION CHARACTERISTICS
USING TERRASAR-X AND RADARSAT-2 DATA
Yannick Duguay1,3, Monique Bernier1,3, Esther Lévesque2,3, Benoît Tremblay4 1 Institut National de la Recherche Scientifique, Québec, Canada
2 Université du Québec à Trois-Rivières, Trois-Rivières, Canada 3 Centre d'études nordiques, Québec, Canada
4 Ministère du Développement durable, de l'Environnement et de la Lutte contre les changements climatiques ABSTRACT
Due to its sensitivity to the vertical structure of vegetation, SAR remote sensing has the potential to become a useful tool to map changes in shrub vegetation in subarctic environments. In this paper we evaluate the sensitivity of RADARSAT-2 and TerraSAR-X data to subarctic shrub vegetation. Backscattering was compared with field measurements of shrub height and regression analyses were performed to estimate the sensitivity of SAR signal to shrub height. An unsupervised Wishart classification was also performed on the RADARSAT-2 images to evaluate the separability between shrubs and other elements of the environment. RADARSAT-2 proved to be the most sensitive to shrub height with R² values reaching 0.64 for σ0
HV for fall acquisitions and losing
little sensitivity during the winter. The unsupervised classification provided good separability between shrub dominated areas and other land cover types and was able to distinguish high shrubs from low shrubs.
Index Terms— SAR, Shrub, Subarctic,
RADARSAT-2, TerraSAR-X
1. INTRODUCTION
The arctic and subarctic environments are undergoing rapid changes due to warming air temperatures observed in the past decades. This affects many aspects of the subarctic ecosystems, from the thawing of permafrost to the changes in vegetation cover and their combined effect on the local populations as well as the fauna. One process which has received some attention is the expansion of the shrub vegetation at the expense of the tundra [1]. The presence of shrubs can trigger a feedback loop where shrubs capture windblown snow, keeping ground temperatures
relatively warm during the winter and accelerating the onset of growth in the spring. This can also have an effect on the permafrost since the ground temperatures will remain warmer in the winter. While a few studies have investigated the sensitivity of SAR backscattering to shrub vegetation parameters [2], [3], none have specifically turned their attention to subarctic environments. This paper studies the sensitivity SAR remote sensing data to shrub vegetation characteristics, in particular height and ground coverage, in subarctic environments. A classification is then performed in order to map the various types of shrub coverage.
2. METHODS 2.1. Study area
The study area is a 60 km2 region situated around the
Umiujaq community (56.55° N, 76.55° W) on the eastern shore of the Hudson Bay in northern Quebec, Canada. It is a discontinuous permafrost zone positioned at the northern treeline, forming a transition between the boreal forest to the south and the tundra to the north. The area can be divided into two distinct environments: the coastal region to the west and the Tasiapik valley to the east. The vegetation in the coastal region is very sporadic and dominated by tundra vegetation with a few clusters of shrubs. The Tasiapik valley is mainly shrublands with some patches of lichens as well as clusters of Black spruce (Picea mariana).
2.2. Datasets
A series of RADARSAT-2 Single Look Complex (SLC) Fine Quad-Pol (FQ) scenes (HH, HV, VH, VV polarisations) as well as Dual-polarised TerraSAR-X Single Look Slant Range Complex (SSC) Strip Map (SM) scenes (HH, HV polarisations) were acquired
1194
over the study area from October 2011 to April 2012. All the acquisitions were made on descending orbits with two incidence angle modes, one at low incidence with θ≈27° and one at high incidence with θ≈38°. The choice for the orbit and incidence modes was made in order to maximize the coverage of the study area with both sensors while capturing a good range of incidence angles. The winter data were acquired during March and April when the snow cover is at its maximum. The fall data are needed as reference snow-free data and have been acquired between late October and early December, at the start of the ground freeze-up and when the snow cover is still shallow and has negligible influence on SAR backscattering.
In-situ measurements of shrub characteristics have been collected during the summer of 2009. A total of 238 circular plots with a 10 meter diameter were sampled. Each species of shrub and tree were identified, the percentage of the ground that they cover within the plot was measured as well as the height for each species. Six field campaigns were carried out in coordination with satellite data acquisitions during the 2011 and 2012 winter seasons. Snow depth, density and snow water equivalent, as well as ground temperatures were measured over various terrain types at locations corresponding to vegetation sampling sites. Snowpits were dug at selected sites to gather information on particle size and shape in addition to snow densities from the different layers of the snowpack.
2.3. SAR Processing
In order to assess the sensitivity of SAR backscattering to shrub height and percent ground coverage, a
regression analysis is performed. The backscattered signal in each polarisation for both RADARSAT-2 and TerraSAR-X data is plotted against the weighted mean of shrub height, which is the height of each shrub species weighted by the percentage of ground it covers within each plot. The model used for regression analysis takes the form:
σ0
fpqθ=A+B*log(h)
where σ0
fpqθ is the backscattering coefficient (in dB)
at frequency f, polarisation pq and incidence angle θ,
A is a constant, B is the slope or sensitivity coefficient
(in dB/log of height) and h is the weighted mean of shrub height. The log transformation was necessary as shown in Figure 1, where it can be seen that the majority of measurements are concentrated below 0.5 meter mean height with a dynamic range of over 10 dB.
An unsupervised classification is also performed to assess the separability of the various types of shrub cover. The classification is based on the Wishart classifier applied to the coherency matrix derived from the RADARSAT-2 data and using eight predefined zones in the plane formed by entropy and α polarimetric parameters [4].
3. RESULTS 3.1. Sensitivity ro shrub height
The first results from the regression analysis show that the C-band σ0
HV is the most sensitive to shrub height
with the B coefficient ranging from 2.3 dB to 2.9 dB and R² values between 0.50 and 0.64 for images acquired between October and December. The incidence angle has little effect on the sensitivity
Figure 1: RADARSAT-2 Backscattering in HV polarisation as a function of vegetation height. SAR data were acquired on Oct 19 2011 at 38° incidence. Left: weighted average of vegetation height. Right: vegetation height on log scale.
coefficient, but the data at θ=27° have slightly lower
R² values between. For the same period, copolarized
backsctattering displays lower sensitivity with a B coefficient varying between 0.7 dB and 1.8 dB and R² values ranging from 0.14 to 0.48 for both HH and VV polarisations. However, incidence angle has more impact on the copolarised signal and lower incidence (θ=27°) displays a slightly lower sensitivity (0.7 dB ≤
B ≤ 1.4 dB) and significantly lower R² values (0.14 ≤ R² ≤ 0.27). During the late winter, in the presence of
snow, the sensitivity of HV backscattering decreases very slightly (2.0 dB ≤ B ≤ 2.2 dB) and the fit deteriorates slightly (0.35 ≤ R² ≤ 0.45).
In the case of TerraSAR-X data, the sensitivity to shrub height is lower and the signal seems to saturate rapidly compared to RADARSAT-2. The sensitivity of
σ0
HV ranges between 1.3 dB and 1.8 dB in the fall (0.37
≤ R² ≤ 0.47) and only decreases slightly in the winter down to 1.0 dB ≤ B ≤ 1.4 dB. As for σ0
HH there is no
significant difference between fall and winter with the
B coefficient which ranges between 0.8 dB and 1.4 dB
with R² values between 0.10 and 0.40. There are also no noticeable differences between the two incidence angles for the TerraSAR-X data, for both co- and cross-polarised data.
Overall, RADARSAT-2 data is more sensitive to shrub height, mainly due to its longer wavelength enabling better penetration into the canopy compared to TerraSAR-X. The highest sensitivity is observed
with σ0
HV which is mainly influenced by the volume
scattering generated by the randomly oriented branches of the shrubs. This sensitivity is slightly deteriorated by the presence of snow during the winter, but volume scattering by shrubs is still dominant.
3.2. Wishart classification
The most interesting results with the Wishart classification were obtained with the RADARSAT-2 image acquired on October 19 2011 at incidence angle
θ=38° (Figure 2). The map generated from the
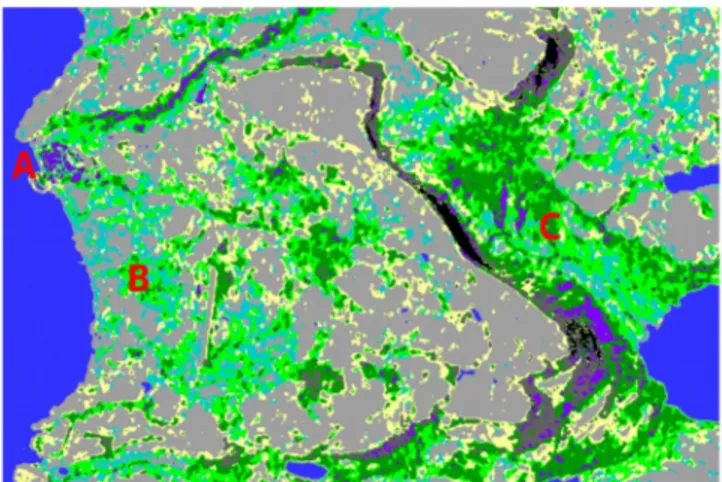
unsupervised classification scheme was compared with high resolution (0.8 m) aerial photographs of the area in order to assign labels to the classes defined by the algorithm and to do a basic visual assessment of the quality of the classification. The algorithm generated 8 classes which were labeled as: bare soils, exposed bedrock, high shrub, low shrub, lichen with sparse shrub, rock boulders, trees and buildings and water bodies. The “lichen with sparse shrub” class was covered with 50% or less shrubs, the “low shrub” class was covered by at least 50% of shrubs with height below 1.5 meters and the “high shrub” class was covered by at least 50% of shrubs higher than 1.5 meters. The double bounce generated by some trees, especially on river banks and steep slopes in the Tasiapik valley area, lead to an aggregation of these areas with others containing buildings in the village (upper left corner of the image) which resulted in the “Trees and buildings” class. Since human constructions are not the focus of this research, these areas will be masked in further analyses. The areas dominated by single bounce scattering (excluding water) were classified as bedrock, bare soils or lichen with sparse shrubs. While there is little misclassification between these three classes and the shrub dominated classes, there is some confusion within them. Generally, the areas classified as bedrock are overestimated to the expense of bare soils and lichen with sparse shrub classes. In the case of the two shrub classes there is little confusion between them, indicating a good separability between various shrub height classes, in addition to being well discriminated from other land cover types. Further classification methods using supervised classification techniques will be tested to improve the precision and to see if a more fine grained separability can be achieved between shrub species or height classes.
Figure 2: Wishart classification of Oct. 19 2011 RADARSAT-2 image. The letters on the map represent A) the Umiujaq village, B) the coastal area, C) the Tasiapik valley. The classes are: ▲ Bedrock (light grey), ▲ Boulders
(dark grey), ▲ Water (blue), ▲ Bare soil (yellow),
▲ Lichen with sparse shrub (light blue), ▲ Low shrubs (light green), ▲ High shrubs (dark green), ▲ Trees and
buildings (purple), ▲ No data (black).
4. CONCLUSION
Multifrequency and multipolarised SAR data were analyzed to assess the sensitivity of the backscattering coefficient to shrub vegetation height and ground coverage. C-band cross-polarised backscattering displays the most sensitivity to the weighted mean of shrub height, while TerraSAR-X tends to saturate rapidly. The effect of the vegetation height is still important during the winter and needs to be considered for snow characterisation using SAR data. An unsupervised classification using the Wishart classifier on the polarimetric RADARSAT-2 data yielded interesting results. The next steps will be aimed at improving the vegetation classification using supervised classification methods. A better classification of the structural characteristics of vegetation (height, coverage, branch structure) will provide good indicators for snow accumulation areas and help in monitoring the growth of shrub vegetation in subarctic environments.
5. ACKNOWLEDGEMENTS
The authors would like to acknowledge the financial support of the ARCTICNET Excellence Network and the Center for Northern Studies (CEN). Y. Duguay got a Ph.D. scholarship from NSERC Canada.
6. REFERENCES
[1] M. Sturm, J. Schimel, G. Michaelson, J. M. Welker, S. F. Oberbauer, G. E. Liston, J. Fahnestock, and R. V.E., “Winter biological processes could help convert arctic tundra to shrubland,” BioScience, vol. 55, no. 1, pp. 17–26, 2005.
[2] H. B. Musick, G. S. Schaber, and C. S. Breed, “AIRSAR Studies of Woody Shrub Density in Semiarid Rangeland: Jornada del Muerto, New Mexico,” Remote Sensing of Environment, vol. 66, no. 1, pp. 29–40, Oct. 1998.
[3] T. Svoray, M. Shoshany, P. J. Curran, G. M. Foody, and A. Perevolotsky, “Relationship between green leaf biomass volumetric density and ERS-2 SAR backscatter of four vegetation formations in the semi-arid zone of Israel,” International Journal of Remote
Sensing, vol. 22, no. 8, pp. 1601–1607, 2001.
[4] J. S. Lee, M. R. Grünes, T. L. Ainsworth, L. J. Du, D. L. Schuler, and S. R. Cloude, “Unsupervised classification using polarimetric decomposition and the complex Wishart classifier,” Ieee Transactions on
Geoscience and Remote Sensing, vol. 37, no. 5 pt 1,
pp. 2249–2258, 1999.