Design of an Instrumented Microchannel Device for
Characterization of Phase Change Nanofluids
by
MASSACHUS
Karl J. Suabedissen
OF TECB.S., Mechanical Engineering (2008)
NOV
0
Rutgers University
LIBR
Submitted to the Department of Mechanical Engineering in Partial Fulfillment of the Requirements for the Degree of Master of Science in Mechanical Engineering
at the
Massachusetts Institute of Technology
TTS INSTITUTE HNOLOGY
4
2010
ARIES
ARCHNES
September 2010C20 10 Massachusetts Institute of Technology All rights reserved
Signature of Author:
...-Department of Mechanical Engineering July 19, 2010
Certified by: ... ..
-.-.-.-.--Evelyn N. Wang
Assistant Professor of Mechanical Engineering Thesis Supervisor Accepted by: ...
David E. Hardt Chairman, Department Committee on Graduate Theses
Design of an Instrumented Microchannel Device for Characterization of
Phase Change Nanofluids
by
Karl J. Suabedissen
Submitted to the Department of Mechanical Engineering on, 2010, in Partial Fulfillment of the Requirements for the Degree of Master of Science
Abstract
As the energy needs of the world continue to grow, it becomes increasingly important to investigate alternative sources of energy. Solar energy is one of our most abundant sources of renewable energy, and researching ways to harness this energy is an area of great interest. While there are several different methods by which solar energy can be harnessed, including
photovoltaics, low temperature collectors, and concentrated solar collectors, this investigation focuses on parabolic trough solar thermal power generation. Parabolic trough solar thermal power generation relies on parabolic shaped mirrors to concentrate sunlight on an array of pipes through which a heat transfer fluid flows. The heated fluid is subsequently used to drive a steam cycle to generate electricity.
Two of the main challenges facing parabolic trough solar thermal power generation are high temperature stability of heat transfer fluids and thermal storage methods. The current fluids used for heat transfer can only withstand temperatures of up to 400C before undergoing thermal breakdown. The heat capacity of these fluids is also insufficient for them to act as an effective thermal storage mechanism during periods of low sunlight. This thesis explores a method of increasing the heat capacity of heat transfer fluids by introducing nanoscale phase change particles. A low temperature proof of concept is used to study nanosized particles of lauric acid which undergo phase change in water, which promises to increase the effective heat capacity by
16.4% using 10% volume fraction of particles. In order to characterize the heat transfer
characteristics of the prepared phase change nanofluid, a heated microchannel was designed and fabricated. A microchannel with doped resistors as temperature sensors was microfabricated. The high temperature coefficient of resistance of doped silicon resistors allows for precise
temperature measurements of 52.5 ohms/K. However, challenges with nanofluid stability and drift of the doped sensors limited further detailed investigations. This work is the first step towards developing nanofluids and characterization tools to demonstrate the feasibility of such fluids for parabolic trough solar thermal power generation.
Thesis Supervisor: Evelyn N. Wang
Acknowledgements
There are many people in my life whose help and support were instrumental in the completion of my thesis.
Professor Evelyn Wang has supported my work from beginning to end, especially when I needed it most. Her guidance and patience were invaluable.
The other students in the lab and my friends at MIT understand well the troubles that present themselves in the course of research. The presence of like-minded people to use as a sounding board for ideas was valuable in more ways than can be counted. Their advice, as well as the advice of post-docs Ryan Enright, Anand Veeraragavan, and Matt McCarthy led to solutions for challenges that I would likely have stumped me indefinitely without their input.
The MTL staff and their expertise made fabrication of my devices possible. I would have been lost without their advice.
Most importantly, my family supported me throughout the whole process. They may not have understood exactly what I was going through, but their words and thoughts helped me though the tough times.
Contents
1 . In tro d u ctio n ... 12
1 .1 M o tiv atio n ... 12
1 .2 B a ck g ro u n d ... 13
1.3 Thesis Objective and Outline... 19
2. Investigation of H eat Transfer Fluids... 21
2 .1 Io n ic L iq u id s ... 2 2 2.2 Encapsulated Phase Change M aterials... 23
2.3 Phase Change N anoFluids... 25
3. D esign and Fabrication... 42
3.1 M icrochannel D esign and D im ensions... ... ... ... 44
3.2 Therm ometer D esign... 47
3 .3 F a b ric atio n ... 5 3 3 .4 S u m m a ry ... 7 5 4. Experim ental Setup and Testing ... 77
4 .1 D e sig n ... 7 7 4.2 Alterations and Challenges ... ... 84
5. Conclusions and Future W ork ... 89
6 . A p p e n d ic e s ... 9 2 6.1 Process Flow ... 92
6.2 M ATLAB Code ... 95
6.3 TSUPREM 4 Code... 98
List of Figures
Figure 1. Flat plate solar collector [1], and evacuated tube heat pipe solar collector [2]...13
Figure 2. Image of linear Fresnel solar collector (left) and parabolic trough installation (right).. 15
Figure 3. Parabolic dish solar concentrator with Stirling engine generator (left) and power tower generating station (right) [1]... . 16
Figure 4. Two tank molten salt storage system [4]... ... ... 18
Figure 5. N-octadecane encapsulated in polymer shell [7]. .. ... ... 23
Figure 6. Heat flux curves for pure n-octadecane and prepared nanoencapsulated n-octadecane [7 ] ... 2 4 Figure 7. TEM of indium nanoparticles in polyalphaolefin [8]. ... ... ... .... 25
Figure 8. Heat flux curves for pure indium, PAO, and indium in PAO nanofluid [8]. ... 26
Figure 9. Thermophysical properties of lead in VP 1 mixture... 27
Figure 10. Energy storage density of fluoride salt in VP1 nanofluid. ... ... 29
Figure 11. Effective specific heat of fluoride salt in VP1 nanofluid. ... ... 30
Figure 12. Combination hot plate and magnetic stirrer. ... 35
Figure 13. 500W Vibra Cell ultrasonic disruptor with hot plate.. ... ... 36
Figure 14. DLS characterization of LANF without high pressure homogenization...37
Figure 15. DLS characterization of LANF with high pressure homogenization. ... 37
Figure 16. Heat capacity of water, lauric acid in water nanofluid...40
Figure 17. Schematic of microchannel device. Depth is 50 ptm measured into the page. ... 44
Figure 18. Resistance/square as a function of the logarithm of implant dosage in ions/cm2... 50
Figure 19. Temperature coefficient of doped resistors as defined by implant dosage. ... 51
Figure 20. Ratio of temperature coefficient to total resistance of doped resistors. ... 52
Figure 2 1. L -edit m ask overlay... 53
Figure 22. A lignm ent m arks m ask... 54
Figure 23. Alignment marks photolithography and etching. ... 55
Figure 24. R eservoir and channel m ask. ... 57
Figure 25. Microchannel and reservoir photolithograpy and etching ... ... 58 Figure 26. Cross shaped alignment marks on microchannel mask (left) and alignment mark mask (rig h t) . ... 5 9
Figure 27. D oped resistor m ask... 60
Figure 28. Photolithography and doping of resistors... 61
Figure 29. Alignm ent marks for dopant mask... 62
F igu re 30 . R esisto r p attern . ... 63
Figure 31. Result of hydrofluoric acid etch of grown oxide. ... ... 65
Figure 32. Removal of remaining oxide and deposition/etching of new oxide layer...66
Figure 33. Aluminum heater and contact pad mask. ... ... 67
Figure 34. Photolithography and etching of deposited aluminum layer... 69
Figure 35. Mask for thermal isolation and inlet/outlet hole etch. ... ... 71
Figure 36. Photolithography and etching of inlet/outlet holes and thermal isolation tabs...73
Figure 37. Clamping block with gasket (left) and mounting disk (right). ... ... 77
Figure 38. Top and bottom views of ProEngineer schematic of microchannel device. ... 78
Figure 39. Top and bottom views of test assembly schematic. ... ... 79
Figure 40. Fabricated microchannel devices...79
Figure 41. Keithley 2001 Series 7 1/2 Digit M ultim eter. ... 81
Figure 42. Keithley 7001 Series Switch System with 7011-S switch card... 82
Figure 43. Lauda RE207 heated/refrigerated circulator.... ... 83
Figure 44. Schematic of experimental setup. ... 84
Figure 45. Resistance drift with constant temperature of 25'C...86
Figure 46. Time averaged resistance measurements with increasing temperature...87
Chapter 1
1. Introduction
1.1 MOTIVATION
As our society becomes ever more dependent on electricity driven devices, it is very important to find sustainable sources of energy. The sun represents the largest source of
renewable energy, with roughly 162,000 [1] terawatts of energy reaching the surface of the Earth every year. Even a small percentage of this could supply a large portion of the less than 20TW used worldwide each year. Currently, more than three quarters of the world's energy needs are met through the burning of non-renewable fossil fuels. Without speculation as to the effects burning of such fossil fuels has on our climate, it is generally agreed upon that cleaner energy sources would be better for our environment. The ability to cleanly harness solar energy and reduce our dependence on fossil fuel would be a huge step towards achieving these goals. There are currently many different ways of utilizing the solar energy to meet our growing energy needs. Some of them, such as low temperature solar collectors, use the sun's thermal energy to supply heat for domestic hot water purposes, while others such as photovoltaics convert the energy carried by the sun's photons directly into electricity. Solar thermal power generation, which harvests solar energy to create steam to power electric generator, is a method capable of producing large amounts of electricity. This thesis will discuss the development and testing of new heat transfer fluids aimed at improving solar thermal power generation technology.
1.2 BACKGROUND
1.2.1 Low Temperature Solar Thermal Applications
For many years, solar energy has been used as a source of low temperature thermal
energy. There are several different types of low temperature solar thermal energy collectors, most of them being very simple [2]. While low temperature solar thermal energy cannot be used for electricity generation, it can be readily used for the heating of domestic hot water or process heat for industrial facilities. The simplest and cheapest type of low temperature solar energy
collector is the flat plate solar collector.
Heat pipe Manifold condenser
Fluid flow
Collector plate
Heat pipe evaporator
Evacuated
tube
'AI
Figure 1. Flat plate solar collector [1], and evacuated tube heat pipe solar collector [2].
Flat plate solar collectors are stationary devices placed in areas of high sunlight in warm climates. The most rudimentary flat plate collector consists only of a flat black absorbing plate and a series of tubes through which either air or water is pumped. More advanced flat plate collectors have glazed glass covers that reduce re-radiation to the atmosphere and maximize the heat capture. Special coatings on the absorber surface and glass cover can further enhance the overall efficiency of the device. Some systems operate in an open loop, heating city water and
13
-storing it for later use, while other systems keep the heated water in a closed heating and storage loop. These systems transfer the stored heat to supply water by means of a heat exchanger, and often use a water/ethylene glycol mixture in the closed loop to prevent boiling of the water in the absorber tubes. Hot water from flat plate collector systems can achieve temperatures of up to
100C. Operating temperatures are limited both by the method of collection and by conduction
and convection losses to the environment. While the glazing on the glass cover of a flat plate collector helps mitigate radiation losses, there is no protection from conduction and convection of heat away from the glass surface.
Evacuated tube heat pipe type collectors, Figure 1, overcome the operational temperature limitations of flat plate collectors by introducing an insulating vacuum between the absorbing tube and the outside environment. Inside the absorbing tube is a small amount of fluid that absorbs the solar energy through evaporation. The vapor transfers its thermal energy to an external heat transfer fluid and returns to the liquid phase. The operating temperature of the heat pipe is set by choice of the working fluid and the internal pressure of the sealed pipe. As a result of the evacuated tube surrounding the heat pipe, evacuated tube solar collectors can achieve temperatures of up to 200'C without suffering appreciable heat losses to the environment.
1.2.2 High Temperature Solar Thermal Applications
High temperature solar thermal applications refer to those systems which are capable of producing high temperature and pressure steam for electricity generation or industrial processes. In order to generate these higher temperatures, it is necessary to use concentrating mirrors to increase the heat flux on a given area. High temperature systems include linear Fresnel reflectors, parabolic trough solar collectors, parabolic dish reflectors, and central receiver, in order of
increasing concentration factor. The concentration factor is directly correlated to the maximum possible operating temperature of each system.
Linear Fresnel reflectors, Figure 2, use a series of flat rectangular mirrors to focus sunlight on a pipe through which a heat transfer fluid flows.
Figure 2. Image of linear Fresnel solar collector (left) and parabolic trough installation (right). Linear Fresnel collectors are very similar in principle to parabolic trough solar collectors, but they cannot achieve the same concentration ratios. For two systems of the same physical dimensions, the power output of a parabolic trough system will be greater than that of a linear Fresnel system. However, the linear Fresnel system does possess certain advantages.
Construction of a linear Fresnel system is substantially simpler and less costly, owing largely to the flat mirrors that comprise the reflective surfaces. The flat mirrors are mounted low to the ground and do not require complex and expensive structures to track the sun.
Parabolic trough solar collectors operate on the same principle as linear Fresnel
reflectors, but are much more refined. A long trough shaped parabolic mirror, seen in Figure 2, concentrates light onto the line that describes the focus of the parabola. Through the focus of the parabola runs a pipe covered in a special absorptive coating and surrounded by an evacuated glass tube. Parabolic mirrors are expensive to make and maintain, but they offer concentration
15
ratio advantages over non-focusing optics. Several different parabolic trough configurations are commercially available, with concentration ratios ranging from 50 to more than 80 [3]. Parabolic trough arrays are installed with the troughs running north to south, and track the sun as it crosses the sky from east to west.
Parabolic dish reflectors are parabolic mirrors with a heat collecting mechanism at the focus of the parabola. Figure 3 shows a parabolic dish reflector with a Stirling engine located at its focal point. Other choices for power generating element are photovoltaics or microturbines.
Figure 3. Parabolic dish solar concentrator with Stirling engine generator (left) and power tower generating station (right) [1].
Although the point focus of the parabolic dish can achieve much higher concentration ratios than the parabolic trough collectors, the total output of a parabolic dish reflector is limited due to size limitations of the parabolic mirror. Parabolic dish reflectors must track the sun on both axes in order to maintain the high concentration ratio. Concentration ratios can reach as much as 2000, and operating temperatures exceed 1500*C.
Central receiver systems, also known as power towers, are analogous to parabolic dish reflection systems in the same way the linear Fresnel systems relate to parabolic trough
installations. Although central receivers like the one in Figure 3 cannot achieve concentration ratios as high as a parabolic dish reflector, they still reach concentration ratios of up to 1500.
A central receiver system consists of many mirrors mounted on the ground and angled such that
they reflect light to a receiver atop a tower. Like the parabolic dish system, these individual mirrors much track the sun on both axes to keep the sun's rays focused on the central receiving unit. Molten salt is passed through the receiver, collecting the energy at a temperature of 550'C to drive a steam cycle and generate electricity. The advantage of a central receiver system is that it can achieve high concentration ratios but can be built much larger than a parabolic dish system due to the smaller size of the mirrors it uses. Table 1 compares the discussed solar thermal collection technologies.
Table 1. Comparison of solar thermal collection technologies.
Collector Type Concentration Ratio Operating Temperature Flat plate 1:1 1000C Evacuated tube 1:1 2000C Linear Fresnel 60:1 3000C Parabolic trough 80:1 4000C Parabolic dish 2000:1 15000C Central Receiver 1500:1 5500C
1.2.3 Common Challenges Associated with Parabolic Trough Power Generation Systems
Parabolic trough solar thermal power generation is the lowest cost large-scale solar power generation technology currently available [3], but there is still significant room for improvement, most notably in the heat transfer fluid used for transferring the thermal energy from the
collectors to a steam cycle. A recent DOE call for research proposals seeks to address these concerns. Some of the metrics that are desired include a fluid that is stable to 500"C, has a freezing point below 80*C, and has a heat capacity between 2-5kJ/kg*K. Two of the challenges that any parabolic trough system must face are cold overnight temperatures and long periods without significant sunlight. Even in sunny areas, nighttime temperatures during the winter can drop to near freezing levels. Unlike power tower systems, whose fluid can drained by gravity alone, it is very difficult to remove the heat transfer fluid from the horizontal pipes of a parabolic trough system. As such, a suitable heat transfer fluid must have a freezing point low enough that overnight freezing is not a substantial risk. Also, during periods of low sunlight it would be advantageous for a parabolic trough system to be able to store sufficient thermal energy such that it can continue to generate electricity without additional input energy.
Figure 4. Two tank molten salt storage system [4].
The heat transfer fluid used in contemporary parabolic trough systems, Therminol VP1, is too expensive to be used as a thermal storage fluid. The current thermal storage method is a two tank molten salt system, pictured in Figure 4. In the two tank molten salt storage system, heat is collected by the parabolic trough array and carried by the heat transfer fluid to a heat exchanger. Heat is transferred from the heat transfer fluid to the molten salt and stored in a hot salt tank. In order to generate power, the molten salt must transfer the energy back to the heat transfer fluid before being stored in the cold salt tank. This method introduces two additional heat transfer steps that result in a loss of energy that would not be present if the heat transfer fluid itself could be used as a thermal storage mechanism. A heat transfer fluid with a higher heat capacity would obviate the need for a secondary storage fluid and result in greater energy capture.
1.3 THESIS OBJECTIVE AND OUTLINE
Phase change nanofluids may have advantages when used in heat transfer applications, specifically parabolic trough solar thermal power generation. The energy required to overcome the latent heat of phase change nanoparticles seeded in a carrier fluid acts to increase the
effective heat capacity of the fluid, allowing similar masses nanofluid to remove more heat than their pure fluid counterparts. The phase change may also introduce other effects on the heat transfer characteristics of the fluid which are not obvious without testing. In order to determine the feasibility of phase change nanofluids as a heat transfer fluid for solar thermal power
generation, candidate materials for phase change nanofluids are identified and characterized. To test the heat transfer characteristics of fabricated nanofluids, an instrumented microchannel device is developed and fabricated. The main focuses of this thesis are outlined below:
In Chapter 1, the challenges in current parabolic trough solar thermal power generation
systems were discussed and phase change nanofluids were introduced as a potential solution to some of these challenges.
In Chapter 2, current and potential heat transfer fluids for use in solar thermal power
generation are considered. A candidate phase change nanofluid is identified.
In Chapter 3, the design and fabrication of the instrumented microchannel device are
described in detail.
In Chapter 4, an experimental setup for measuring the heat transfer characteristics of
nanofluids using the microchannel device is presented. Challenges in the instrumentation and use of the device are also discussed.
In Chapter 5, methods for improving the microchannel device and resolving challenges are
Chapter 2
2. Investigation of Heat Transfer Fluids
The current fluid used in solar thermal power generation is a eutectic mixture of biphenyl and diphenyl oxide known by the trade name of Therminol VP 1 and produced by Solutia. This particular fluid has a relatively high heat capacity of about half that of water, and remains liquid between 12C and 252C. The liquid range can be extended to nearly 400C by pressurizing the system to 10 atmospheres. VP1 is an excellent heat transfer fluid for this application because of its high heat capacity and low freezing point, Table 2.
Table 2. Properties of Therminol VP1
Density, 393C 704 kg/m3 Freezing Point 120C
Boiling Point, latm 2520C
cp, 293 C 2.30 kJ/kg*K
cp, 393C 2.60 kJ/kg*K
Viscosity, 393C 1.5*104 Pa*s
Fluids used in parabolic trough power generation systems must have good freezing protection because it is very difficult to drain the horizontal fluid carrying pipes. However, improvements upon VP 1 would make parabolic trough solar thermal power generation a more viable solution. The two major improvements that would be the most valuable are an increase in heat capacity as well as an increase in the maximum operating temperature of the fluid. An increase in heat
amount of fluid needed for a given heat flux, and also a decrease in pumping power. Increasing the maximum operating temperature would allow the Rankine cycle to operate in a more efficient regime, generating more electricity from the available energy. Potential solutions to both of these problems were investigated.
2.1 IONIC LIQUIDS
Ionic liquids are a class of ionic compounds that are liquid at or near room temperature. These liquids were investigated for their potential as a replacement heat transfer fluid for parabolic trough solar thermal power generation systems. Initial reports suggested that ionic liquids might possess both the low freezing point and high boiling/thermal breakdown point desired for use in solar thermal power generation. The National Renewable Energy Laboratory has done significant work investigating the properties of ionic liquids with specific application to solar thermal power [5]. Although initial research suggested that ionic liquids might withstand higher temperatures than the VP 1, thermogravimetric analysis showed ionic liquids tested to date do not show any substantial improvement, Table 3.
Table 3. Properties of Select Ionic Liquids [6]
Ionic liquid Melting point. * Decomposition point. Viscosity at 25*C. mPa s Density at 25'C.
*c kam m [Ciomnim][PF6] 34 390 --[C'8min][PF6] -75 416 --[C'4miin][PF6] 4 390 312 [Ciomimj[BF4j -77.5 -- --[Csiim][BF4] -- -- --[C4mii][BF4] -75 407 219 1119 [C4nin][bistriflylimlide] -89 402 54.5
2.2 ENCAPSULATED PHASE CHANGE MATERIALS
One method of increasing the heat capacity of a fluid is by incorporating encapsulated phase change materials into the carrier fluid. The additional energy absorbed by the latent heat of phase change results in a greater overall heat capacity. Commercially available phase change fluids typically encapsulate a fatty acid or paraffin material inside a polymer shell. Encapsulation of the phase change material circumvents the problem of agglomerating phase change material during phase transitions. However, commercially available encapsulated phase change materials are all tens of microns in size. Microsized particles tend to increase viscosity significantly and can crush each other during pumping, reducing the effectiveness of the system over time.
Fang et al devised a method for producing nanosized encapsulation phase change materials in an effort to improve on microencapsulated phase change materials. N-octodecane was encapsulated in polystyrene [7]. After experimenting with different polymerization techniques, Fang was successful in making 124nm average diameter nanocapsules that would withstand multiple freeze/thaw cycles shown in Figure 5.
eN
Figure 5. N-octadecane encapsulated in polymer shell [71.
Samples were thermally cycled over 100 times and no degradation of performance or leakage of
the n-octadecane was detected. Although the nanosized encapsulated phase change materials are
a promising idea, the polymer coating would not be able to withstand the high operating
temperatures of a solar thermal power generation system. In addition, a shell of any material
reduces the effectiveness of adding phase change material to the carrier fluid. An optimal
solution would be to introduce the phase change material with a minimum of extraneous
substances, thus not diluting the effects of the phase change.
Flow 8 ---- NEPCM 4 U -4 0 -8 1 I I I I I 0 10 20 30 40 50 60 70 temperture/*C
Figure 6. Heat flux curves for pure n-octadecane and prepared nanoencapsulated n-octadecane [7].
The reduced effective latent heat of encapsulated phase change materials can be seen in the heat
flux plot in Figure 6. Pure n-octadecane requires more than twice the heat flux to induce phase
change as the same mass of encapsulated n-octadecane. This reduction in effective latent heat
results in a similar increase in the amount of nanoparticles needed to introduce the same effective
heat capacity increase. Additional nanoparticles can cause problems both in rapid increases in
viscosity as particle loading fraction increases as well as additional difficulties maintaining a
2.3 PHASE CHANGE NANOFLUIDS
A promising idea for increasing the effective heat capacity of heat transfer fluids is the
incorporation of nanosized phase change material into the carrier fluid without an encapsulating shell. Yang et al were able to suspend indium nanoparticles in polyalphaolephin oil and observe the melting and freezing peaks through the use of a differential scanning calorimeter [8]. Figure
7 shows the indium nanoparticles of roughly 30nm in diameter. To fabricate the nanofluid, PAO
is heated such that its temperature is greater than the melting point of indium. After addition of indium, the mixture is stirred for 2 hours using a magnetic stirrer, creating a microemulsion. The
micron sized indium droplets are ruptured through the use of an ultrasonic disruptor for an additional two hours.
Figure 7. TEM of indium nanoparticles in polyalphaolefin [8].
Differential scanning calorimetry is subsequently used to characterize the thermophysical nature of the suspension in Figure 8. It is evident that melting occurs at the same temperature as pure indium, but there is some lag in the freezing point. The suspended indium does not return to the solid phase until nearly 40*C below its melting point. The difference in freezing and melting
temperature of the suspended phase change material must be accounted for in using phase change nanofluids for practical applications, as it establishes a minimum working range of temperatures. 3 --- - - - -. Indium
2
--- PAO -- Nanofluid ~~I
Freezing
~E
0 1: - F Mefing0
80
100 120
140
160
180
Temperature (*C)
Figure 8. Heat flux curves for pure indium, PAO, and indium in PAO nanofluid [8].
The first step in developing a phase change nanofluid for use in parabolic trough solar thermal power generation was to develop a list of materials that melt within the 293 0C to 393 C working range of current systems. A list of common materials satisfying this requirement can be found in the appendices. Two important things to watch for are an increase in the effective heat capacity over the working range of the fluid, and an increase in the volumetric energy storage capability. An increase in the effective heat capacity will reduce the required mass flow and fluid requirements. Increasing the energy storage per unit volume allows for smaller, easier to insulate storage vessels. As a benchmark, simple calculations were performed on a mixture of lead and VP 1. Using published thermophysical data for both lead and VP 1, it is possible to determine the effective heat capacity and energy stored per cubic meter of a mixture of the two materials. A MATLAB program, cplkg2.m (Appendix 6.2.7) was written to calculate the thermophysical
properties of mixture of VP 1 and a designated material over a given temperature range. The plot clearly illustrates the advantages and drawbacks that must be considered when choosing a suitable phase change material for integration with VP1, or another heat transfer fluid.
X105 6 ,, ,,,,, 3 4- -2 Ca
o
CO >% 0 0. 0u 0 0.1 0.2 0.3 0.4 0.5 0.6 0.7 0.8 0.9 1 Volume FractionFigure 9. Thermophysical properties of lead in VP1 mixture.
Since the lead has a relatively low latent heat and heat capacity compared to the heat capacity of the VP1 oil, Figure 9 shows that adding lead to VP1 steadily decreases the overall heat capacity of the suspension. However, the high density of the lead causes an increase of the volumetric energy storage capability. It is also apparent that the mass fraction of lead required to attain an appreciable benefit would be prohibitive. Excluding lead as a possible material helps establish guidelines for the sort of material needed. Since the heat capacity of the phase change material in its solid and liquid phases will likely be less than that of the VP1, a high latent heat will be
required in order to make up for this shortcoming. High density will also lend itself to increasing the volumetric energy storage capabilities of the heat transfer fluid.
Using the calculation results from lead as a guideline, further investigation of candidate phase change materials yielded a small group of eutectic mixtures of fluoride salts that seem to show promise, listed in Table 4. Due to the strong interatomic forces that hold ionic compounds together, they often have large heat capacities and correspondingly large latent heats of fusion. However, these strong forces also mean that most pure salts have melting temperatures that are well outside the working range of a parabolic trough solar thermal power generation system. Forming eutectic mixtures of two or more salts can create substances that possess melting temperatures lower than that of its individual components. In general, the more salts that are involved in a eutectic, the more the melting point is decreased. Below is a short list of fluoride salt eutectics that could potentially be used in solar thermal power generation.
Table 4. Thermophysical Properties of Fluoride Salts [91
Density Viscosity
Form. Melting (g/cm3) 700'C heat (cP) Thermal
Salt wt. pt. T capacity T cond.
(mol,) (g/mol) (OC) (1C) (J/g0C) (K) (W/cm C)
Alkali-Fluorides (IA) LiF-NaF-KF (46.5-1l.5-42) 41.2 454 2.53-0.00073xT 1.89 0.04 exp(4170/T) 0.006-0.01 Alkali+ZrF4 NaF-ZrF4 (50-50) 104.6 510 3.79-0.00093 X T 1.17 0.071 exp(4168/T) -0.01 (est) NaF-KF-ZrF4 (10-48-42) 102.3 385 3.45-0.00089 X T 1.09 0.061 exp(3171 / T) -0.01
(est.) (est.) (est.)
Li-NaF-ZrF4 (42-29-29) 71.56 460 3.37-0.00083 X T 1.46 0.0585 exp(4647/ T) -~0.01 Fluoroborates
NaF-NaBF4 (8-92) 104.4 385 2.252-0.000711 X T 1.51 0.0877 exp(2240/ T) -0.005
Although these salts were intended to be used as heat transfer fluids in high temperature systems operating well above their melting points, they possess certain thermophysical characteristics that lend themselves to use in our intended application. The melting point of the NaF-KF-ZrF4 eutectic is very near to the upper end of the working range of a parabolic trough system. It is readily apparent that this salt eutectic would be much more beneficial than lead because of its
much higher heat capacity or 1.09 kJ/kg. Since the heat capacity of the fluoride salts are much closer to the heat capacity of the oil, the latent heat does not have to make up for the loss in specific heat incurred by adding the fluoride salt. Using a working range of 293*C-393'C and a heat capacity of 410 kJ/kg for the eutectic mixture, the increase in energy storage density as a function of volume fraction can be calculated. The results in Figure 10 show that even a small volume fraction of 4% results in a 25% increase in the amount of energy that can be stored in a particular volume. 1.45 1.4-. 1.35- 1.3-4) 1.2-( 1.15-E) 1.1-1.05- -1 0 0.01 0.02 0.03 0.04 0.05 0.06 Volume Fraction
Figure 10. Energy storage density of fluoride salt in VP1 nanofluid.
Since the heat capacity of VP 1 is highly dependent on temperature, it is not practical to plot the change in heat capacity as a function of increasing volume fractions of fluoride salts. Rather, it makes more sense to calculate an effective average specific heat. Effective average specific heat computes the total energy absorbed by the suspension and divides it by the temperature width of
""'hut
the working range, resulting in a value that describes the behavior of the suspension as if it were a pure fluid with constant heat capacity.
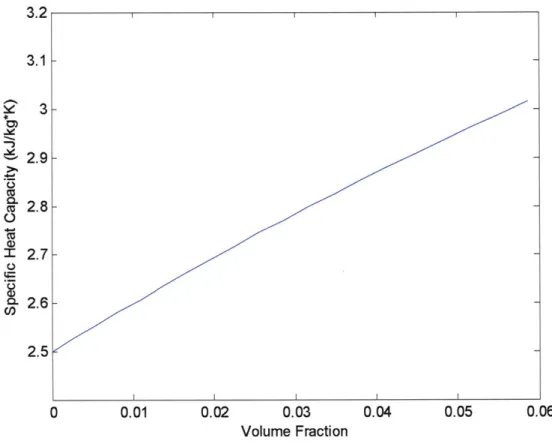
3.2 1 1 3 2.9 2.8 2.7 2.6 2.5 0.01 0.02 0.03 0.04 0.05 Volume Fraction 0.06
Figure 11. Effective specific heat of fluoride salt in VP1 nanofluid.
Examining Figure 11, it is clear that the large latent heat of the fluoride salt mixture more
than makes up for its shortcomings in the area of specific heat. Although the increases in heat capacity are not nearly as pronounced at low volume fractions as those of the energy storage density, the calculated results are still very promising. Due to the difficulties in fabricating stable nanofluids at any volume fraction, the ability to achieve increases in the desired parameters even at low volume fractions is a great advantage.
Although the VP1 will benefit from the addition of the fluoride salt mixture in terms of its thermophysical properties, testing at these high temperatures does present challenges. VP 1 must be pressurized to nearly 10 atmospheres at a temperature of 3930C in order to remain in the
liquid phase. The high pressure, in tandem with the high temperatures, makes testing the characteristics of a fluoride salt-VP 1 suspension extremely challenging. For this reason, it was determined that initial testing would be a test of a fluid at lower temperatures without a
pressurization requirement. Though initial testing will be carried out at temperatures much closer to room temperature, special attention will be paid to the testing methods such that they might be used for higher temperature tests at a later time.
Lower temperature testing requires an investigation of phase change materials that melt at more manageable temperatures. The most obvious choices for a carrier fluid are water or some form of oil. It makes the most sense to use VP 1 for any oil based nanofluids as it is the heat transfer fluid in a parabolic trough system, unless the VP 1 is for some reason incompatible for the chosen phase change material. Two materials were initially tested as potential lower temperature phase change materials: HITEC solar salt and HITEC XL. These two salts are eutectic mixtures of salts in much the same way that the fluoride salts that are intended for use in the higher temperature system, and are used in solar power tower systems as the primary heat transfer fluid.
HITEC and HITEC XL were candidate phase change materials because of their melting
point and similarity to the proposed high temperature fluoride salts. HITEC solar salt melts at
220C, and HITEC XL melts at 147C. First attempts with both salts began by heating a small
amount of VP1 in an open beaker on a hot plate. Once the VP1 oil reached a temperature above the salt's melting temperature (monitored by thermocouple), a small amount of the salt was
added. Addition of the salt lowered the boiling point of the VP1 to approximately 140C, no longer high enough to melt either of the salts. One theory was that the extremely jagged structure
salt was melted first, and oil was then added on top of the already melted salt. Unfortunately, one of the components present in both salts is a very strong oxidizer, and does not react favorably with the oil. The salt causes the 252*C boiling point of the VP1 synthetic oil to be significantly reduced. The reduction is enough such that the maximum temperature of the boiling oil is no longer sufficient to melt the salt. As such, the HITEC/HITEC XL and VP1 mixtures are no longer a viable option as a low temperature phase change nanofluid.
Paraffins and fatty acids are often used as phase change materials for the purposes of energy storage, and were the next class of materials investigated as candidates for a low temperature phase change nanofluid. Below, Table 5 and Table 6 list paraffins, fatty acids, and their properties. It has been reported that paraffins do not have sharp melting points, and possess a 'melting range', it was decided that fatty acids would be more appropriate for low temperature testing. Due to a combination of pricing, availability, and thermophysical properties, lauric acid was selected as the first fatty acid material for testing as a phase change material. Following the same procedure as was followed for the HITEC salts, it quickly became apparent that the lauric acid was soluble in the VP . As a result, lauric acid and VP 1 are not appropriate as components of a phase change nanofluid.
Table 5. Potential Organic Compounds [10] Heat of fu- Thermal conductivity sion (kJ/kg) (W/mK) Paraffin C14 Paraffin C15-C16 Polyglycol E400 Dimethyl-sulfoxide (DMS) Paraffin C16,-CIS Polyglycol E600 Paraffin C,.-C24 I -Dodecanol Paraffin Cis 1 -Tetradecanol Paraffin C16-CIx Paraffin Cj,-C3. Paraffin C21-C41 Parflin wax Polyglycol E6000 Paraffin Ci-C-N Biphenyl Propionamide Naphthalene Erythritol HDPE Trans-1,4-polybuta-diene (TPB) 4.5 [1] 8 [1] 8 [4,11] 16.5 [28] 20-22 [29] 22 [4,11] 22-24 [1] 26 [9] 28 [1] 27.5 [30] 38 [9] 42-44 [1] 48-50 [1] 58-60 [1] 64 [4,11] 66 [4,111 66-68 [1] 71 [4,11] 79 [11] 80 [4,11] 118.0 [31] 165 [1] n.a. 153 [1] n.a. 99.6 [4,11] 0.187 (liquid, 38.6 *C) [4,111 0.185 (liquid, 69.9 *C) [11] 85.7 [28] n.a. 152 [29] n.a. 127.2 [4,11] 0.189 (liquid, 38.6 C) [4,11] 0.187 (liquid, 67.0 *C) [11] 189 [1] 0.21 (solid) [1] 200 [9] 244 [1] 243.5 [30] 205 [9] 189 [1] 189 [1] 189 [1] n.a. 0.148 (liquid, 4) C) [30] 0.15 (solid) [1] 0.358 (solid, 25 *C) [30] 0.21 (solid) [1] 0.21 (solid) [1] 0.21 (solid) [1] 173.6 [4,11] 0.167 (liquid, 63.5 *C) [4,11] 266 [6] 0.346 (solid, 33.6 *C) [4,11] 0.339 (solid, 45.7 *C) [11] 190.0 [4,11] 189 [1] n.a. 0.21 (solid) [1] 119.2 [4,11] n.a. 168.2 [11] n.a. 147.7 [4,11] 0.132 (liquid, 83.8 *C) [4,11] 0.341 (solid, 49.9 *C) [4,11] 0.310 (solid, 66.6 *C) [11] 339.8 [31] 0.326 (liquid, 140 *C) [31] 0.733 (solid, 20 *C) [31] 100-150 [32] 200 [32] 145 [33] 144 [33] n.a. n.a. n.a. n,.a. 1125 (liquid, 25 oC) [4,11] 1228 (solid, 3 *C) [4,11] 1009 (solid and liquid) [28] n.a. 1126 (liquid, 25 'C) [4,11] 1232 (solid, 4 *C) [4,11] 0.760 (liquid, 70 *C) [1] 0.900 (solid, 20 *C) [1] n.a. 0.774 (liquid, 70 'C) [1] 0.814 (solid, 20 *C) [I] 0.765 (liquid, 70 *C) [1] 0.9 10 (solid, 20 *C) [1] 0.769 (liquid, 70 *C) [1] 0.912 (solid, 20 *C) [1] 0.795 (liquid, 70 *C) [1] 0.920 (solid, 20 *C) [1] 790 (liquid, 65 *C) [4,11] 916 (solid, 24 *C) [4,11] 1085 (liquid, 70 IC) [4,11] 1212 (solid, 25 *C) [4,11] 0.830 (liquid, 70 *C) [1] 0.930 (solid, 20 *C) [1] 991 (liquid, 73 *C) [4,11] 1166 (solid, 24 *C) [11] n.a. 976 (liquid, 84 *C) [4,11] 1145 (solid, 20 *C) [4,11] 1300 (liquid, 140 *C) [31] 1480 (solid, 20 *C) [31] n.a. n.a. n.a.: not available.
Compound Melting tem-perature (*C)
Density
Table 6. Candidate Fatty Acids for Use as a Low Temperature Phase Change Material [10] Compound Propyl palmiate Isopropyl palmiate Capric-lauric acid + pentadecane (90:10) Isopropyl stearate Caprylic acid Capric-lauric acid (65 molA-35 mol%) Butyl stearate Capric-lauric acid (45-55'!) Dimethyl sabacate 34% Mistiric acid + 66 % Capric acid Vinyl stearate Capric acid Methyl-12 hydroxy-stearate Lauric acid Myristic acid Palmitic acid Stearic acid Melting tem-perature (*C) 10 [9] 11 [34] 13.3 [35] Heat of fusion (kJlkg) 186 [9] 95-100 [34] 142.2 [35] Thermal conductivity (W/ m K) n.a. n.a. n. a. 14-18 [34] 140-142 [34] n.a. 16 [4,11] 148.5[4,11] 0.149 (liquid, 38.6 *C) [4,11] 16.3 [1] 149 [1] 0. 145 (liquid, 67.7 *C) [11] 0.148 (liquid. 20 *C) [1] 18.0 [36] 19 [9] 21 [9] 21 [34] 24 [11] 148 [36] 140 [9] 123-200 [34] 143 [9] 120-135 [34] 147.7 [11] 27-29 [34] 122 [34] 32 [4,11] 152.7 [4,11] 31.5 [1] 42-43 [34] 42-44 [1] 44 [11] 49-51 [37] 54 [1] 58 [11] 64 [4,11] 61 [38,39] 63 [1] 69 [4,11] 60-61 [39,40] 70 [1] 153 [1] 120-126 [34] 178 [1] 177.4 [11] 204.5 [37] 187 [1] 186.6 [11] 185.4 [4,11] 203.4 [38,39] 187 [1] 202.5 [4,11] 186.5 [39,40] 203 [1] n.a. n.a. Density (kg/m3) n.a. n.a. n.a. 901 (liquid, 30 *C) [4.111 862 (liquid, 80 *C) [1] 981 (solid, 13 C) [4,11] 1033 (solid, 10 *C) [1] n.a. n.a. n.a. 0.164 (liquid, 39.1 *C) [11] 0.154 (liquid, 61.2 *C) [11] n.a. 0.153 (liquid, 38.5 *C) [4,11] 0.152 (liquid, 55.5 *) [11] 0.149 (liquid, 40 *C) [1] n.a. 0. 147(liquid. 50 *C) [1] n.a. 0.162 (liquid, 68.4 *C) [4,11] 0.159 (liquid, 80.1 *C [I I] 0. 165 (liquid. 80 *C) [1] 0.172 (liquid. 70 *C) [1] n.a. n.a. 888 (liquid, 25 C) [11] 1018 (solid, 1 *C) [I1] n.a. 878 (liquid, 45 *C) [4,11] 886 (liquid. 40 *C) [1] 1004 (solid. 24 *C) [4,11] n.a. 862 (liquid, 60 *C) [11] 870 (liquid, 50 *C) [1] 1007 (solid, 24 *C) [1 1] 861 (liquid, 55 *C) [11] 844 (liquid, 80 *C) [1] 990 (solid. 24 *C) [11] 850 (liquid, 65 *C) [4,11] 847 (liquid, 80 *C) [1] 989 (solid, 24 0C) [4.11] 848 (liquid. 70 *C) [4,11] 965 (solid, 24 *C) [4,11]
% in weight; n.a.: not available.
While it is evident that lauric acid and VP 1 will not work as a phase change nanofluid, water can be used as the carrier fluid since the melting point of lauric acid is between 42C and 44C. Since the heat transfer mechanisms of a low temperature phase change nanofluid are the same as those in a high temperature fluid, a low temperature proof of concept will validate the additional efforts needed to overcome the difficulties that come with operating VP 1 at high temperature and
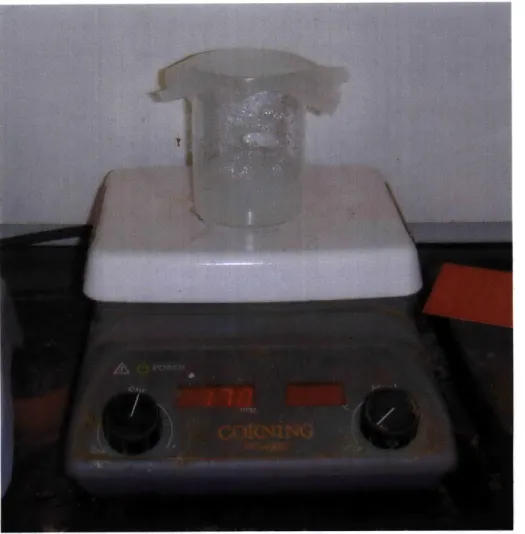
pressure. To create the lauric acid in water nanofluid (LANF), water is first heated to 70*C and the desired amount of lauric acid is added. Once the lauric acid has completely melted, the mixture is stirred with a magnetic stirrer for 2 hours using a combination hot plate/magnetic stirrer shown in Figure 12.
Figure 12. Combination hot plate and magnetic stirrer.
The resulting microemulsion is milky in color as a result of light diffusion from the microsized particles. To further reduce the size of the particles, an 500W Vibra-Cell ultrasonic disruptor manufactured by Sonics & Materials Inc. seen in Figure 13 applies high level shear to the suspension.
Figure 13. 500W Vibra Cell ultrasonic disruptor with hot plate.
The suspension remains on the hot plate throughout the disruption to prevent the particles from agglomerating before they have had sufficient time to be broken apart into smaller particles. After 2 hours of ultrasonic disruption, the heat source is removed with the disruptor still on and the lauric acid and water mixture is allowed to cool. The disrupted suspension is now clear, suggesting that the particles are no longer large enough to diffuse the ambient light and cause a
cloudy appearance. Nanoemulsion status was verified through the use of dynamic light scattering
(DLS). A DLS instrument from Malvern Instruments verifies a particle size distribution centered
about 57nm shown in Figure 14.
25.00 - 100.0
0.- 0.0
10.0 100.0 1000.0 6000
Figure 14. DLS characterization of LANF without high pressure homogenization.
Although it is unnecessary to further reduce the size of the particles, another Malvern instrument was tested as an alternate method of reducing the particle size after the 2 hour stirring step. A
high pressure homogenizer forces the fluid through a microfluidic channel at high pressure, which generates enormous shear forces on the small lauric acid particles.
25.0C C)
0.0
10.0 100.0 1000.0 1100.0 0OFigure 15. DLS characterization of LANF with high pressure homogenization.
I i i I
1' ' .. " .. .. ... ---, ... .. .... .. 11 7 7 11 1111 7 11 11 I .. . .... .... .. .. .. .. .. .. .... .. I . ...
-I
I I I I I I I I I I is"
DLS analysis of the fluid after high pressure homogenization showed an even smaller particle
size distribution, peaking at 13nm in Figure 15. Although the high pressure homogenizer does result in smaller lauric acid particles, the ultrasonic disruptor produces small enough particles for the present application.
Within an hour, the disrupted lauric acid phase could be seen agglomerating and separating to the top of the water. In order to combat this separation, the effects of adding the surfactants NaDDBS and SDS were tested. Guidelines from Islam were followed concerning the proper amounts of surfactant that should be added. Surfactant in the amount of ten times the mass of the lauric acid present was added to the suspension. Based purely on the separation rates of the suspensions post-disruption, SDS was the better surfactant choice. An important note is that no surfactant could be identified that would be usable at the higher temperatures at which a solar thermal power generation system operates. Lack of a suitable surfactant could prove problematic with respect to developing high temperature phase change nanofluids.
In order to characterize the heat capacity of the fabricated nanofluids, a differential scanning calorimeter was purchased. Before settling on the PolyDSC from Mettler Toledo, DSC units from Neztsch Thermal Analysis, Mettler Toledo, and TA Instruments were evaluated. The Polymer DSC of Mettler Toledo was compared to the Q200 of TA Instruments and the DSC 200
F3 Maia of Neztsch Thermal Analysis. Samples of VP1 sent to all three manufacturers revealed
that each of the three units were more than capable of measuring the heat capacity to the degree of accuracy that is necessary. The standard method for calculating the specific heat capacity of a material using a DSC is detailed in ASTM method 1269-05. Although a standard method for the measurement of specific heat capacity exists, the method cannot guarantee better than ten percent error. The difficulties arising in the measurement of specific heat capacity stem from the need to
simultaneously measure both temperature and heat flux to a great degree of accuracy. More common applications of a DSC include identifying temperatures at which phase changes or crystal transitions occur. Phase changes and crystal transitions can be identified by a large peak or drop in the amount of heat flux required to heat the material. While it is necessary to measure heat flux in these applications, the amount of heat flux is not important, merely the temperature at which the transition occurs. When greater temperature accuracy is desired, very small heat fluxes and temperature ramps of less than 5 C/minute are used to allow the entire system to thermally equilibrate. If greater accuracy of heat flux measurement is desired, fast temperature ramps of greater than 200C/minute must be used. In measuring heat capacity, the ASTM1269-05 method requires a temperature ramp rate of 10-20*C/minute in an effort to balance the need for both heat flux and temperature measurements. Data gathered from all three manufacturers showed much better performance. The Netzsch DSC 200 was ruled out due to pricing reasons. Both TA Instruments and Mettler Toledo were able to offer refrigeration units with their DSCs for comparable prices. The refrigeration units enable DSC measurements to be taken at
temperatures as low as -40'C, greatly expanding the range of temperatures at which the machine is useful. Ultimately, the Mettler Toledo PolyDSC was selected to meet the DSC needs of the project.
To verify that the nanofluid behaved as expected, the Mettler Toledo DSC unit was used to provide heat flux data for a 10% volume fraction suspension of lauric acid in water, displayed in Figure 16.
3.95 i i I I I -LA Nanofkud -D Water Phase 3.9 Change Peak 3.85-CO) c 3.8-! 3.75 - 3.7-3.6,5 40 45 50 55 60 65 70 Temperature (C)
Figure 16. Heat capacity of water, lauric acid in water nanofluid.
Heat flux data matched the expected behavior of a phase change nanofluid. Since the heat capacity of both the solid and liquid lauric acid was less than that of water, it was expected that the calculated heat capacity would be less than that of pure water for those regions outside the melting regime. Inside the melting regime, there was a peak in heat flux and therefore calculated
specific heat capacity. For the right range of working temperatures, the specific heat capacity peak resulting from the latent heat of melting can overcome the reduced specific heat capacity observed outside the melting regime. For example, take a 10% by volume suspension of lauric acid in water. A 10% volume fraction of lauric acid in water corresponds to an 8.9% by mass suspension. If we take the heat capacity of water as a constant 4.182 kJ/kg*K, and that of the lauric acid as 2.0 kJ/kg*K, the heat capacity of the nanofluid is 3.988 kJ/kg*K. This represents a
0.194 kJ/kg*K or 4.6% decrease compared to that of pure water. However, the latent heat of
... ...
lauric acid is 178 kJ/kg. As long as the nanofluid is exposed to a working range of temperatures in which the lauric acid melts, the system will benefit from 15.8 kJ of energy absorbed by the lauric acid during the phase change, provided the working range is less than 81.7 K. However, the advantage of the phase change nanofluid is greatest when the working range is small.
An investigation of different types of fluids for potential use as a heat transfer fluid in a solar thermal power generation facility revealed a promising idea in phase change nanofluids. Although phase change nanofluids cannot address the challenge of increasing the temperature stability of the heat transfer fluid, they can serve to increase the heat storage capability of the heat transfer fluid. However, there still exist some challenges to this approach. While it has been
shown that nanoparticles can be observed to change phase while suspended in a carrier fluid, the heat transfer characteristics of a phase change nanofluid in a flow situation remain to be
characterized. Also, nanofluid stability and fabrication method challenges must be addressed in order to make phase change nanofluids feasible in a large scale system.
Chapter 3
3. Design and Fabrication
In addition to using DSC measurements to characterize the specific heat capacity of fabricated fluids, it is necessary to observe the behavior of the phase change nanofluids in a non-static situation. As a result, a microchannel device was envisioned for the testing of phase change nanofluid heat transfer characteristics. The two main choices in the experimental design were those of scale and temperature measurement methodology. As detailed in the previous chapter, there are many issues with fabricating large volumes of nanofluids. It is difficult to make more than 1 00s of mL of nanofluid at a time, and the process is very time consuming. A macro-scale setup, even a closed-loop system that recycled the fluid through the test section many times would require a prohibitively large volume of fluid. Potential agglomeration issues would further complicate the use of a macro-scale system. Agglomerated and solidified PCM could potentially build up in the test section or other areas of the experimental setup and contaminate
measurements. As a result, it becomes apparent that a disposable test cell capable of performing measurements on a small volume of fluid would be extremely beneficial for testing purposes. For this reason, a microfluidic device was chosen as the appropriate method for testing. This
microfluidic device must be capable of both heating the flowing fluid as well as measuring its temperature precisely. Since our device must map the temperature profile of a substance undergoing phase change, during which the temperature is nearly static, it is necessary to have the capability to measure temperature to within 0.1K. The method of temperature measurement is the second major design choice.
There are many different ways to measure temperature in an experimental setting. The most common method of temperature measurement is the thermocouple, which is cheaply available in different configurations for the measurement of different temperature ranges.
However, thermocouples are easily ruled out for our application as they cannot be relied upon to measure temperature to a level of precision any less than 1K. A common technique used to measure temperature in microfluidic devices is the use of platinum resistance thermometers.
Compared to other metals, platinum has one of the highest temperature coefficients of resistance of patternable materials (3.92* 10-3 Q/K), which makes it a very good thermometer material for many applications. However, the most common microfluidic application in which platinum was used as a thermometer dealt with temperature differences measured in tens of degrees [11]. These differences were more than two orders of magnitude greater than the 0.1K necessary for our application. Although platinum is often used in larger scale resistance temperature detectors to measure temperature, the small scale that our device requires makes this approach prohibitive. In order to accommodate enough thermometers to create a detailed temperature profile of the fluid in the channel, they must have extremely small dimensions. These geometric restrictions and the limitations of metal deposition technology result in patterned resistors with high
resistance. Typical platinum RTDs have a base resistance of just 100 Q. At this resistance level, a 0.1K measurement requires a multimeter to accurately register a resistance change of 0.03 Q, or 0.03% of the full scale measurement. While a very small proportion of the original
measurement, this is still within the range of many common laboratory multimeters. However, the dimensional and technological restrictions that we are presented with would result in resistors
in the 100 kQ range. A 0.1K temperature measurement would still require the measurement of a
Doped silicon resistors provide a solution to this problem, as they can have a temperature coefficient of resistance much higher than that of platinum, and they can be patterned directly into a silicon wafer. For this reason, doped silicon resistors became the chosen method of temperature measurement. Since doped silicon resistors obviously require a silicon substrate, it was determined that microfluidic channels would be etched into the silicon, as opposed to using PDMS or glass.
3.1 MICROCHANNEL DESIGN AND DIMENSIONS
Although the flow in a full scale parabolic trough solar thermal power generation system is highly turbulent, with a Reynolds number of nearly 60000, numbers such as these are not practical in a microfluidic system. For this reason, Reynolds numbers for the microfluidic flow cell were not chosen to reflect those of the full scale system. Reynolds numbers were set low so as to reduce the volume of required nanofluid and keep heating power requirements to a
minimum. The channel design and dimensions were structured around a Reynolds number of 25.
A channel etched into silicon will be roughly rectangular; and in order to simplify heat transfer
calculations for the purpose of mathematical simulation, a high aspect ratio rectangular shape was selected. The channel width is 2mm, and its depth is 50 pm, giving it an overall aspect ratio of 40: 1.
2mm
3.5 cm
1 cm
Figure 17. Schematic of microchannel device. Depth is 50 pm measured into the page.
44
This high aspect ratio allows it to be treated as two infinite parallel plates for the purposes of heat transfer calculations. At an aspect ratio greater than 8:1, the Nusselt number of a 3 dimensional
channel becomes very nearly the same as the Nusselt number of two infinite parallel plates. The length of the channel needed to be sufficiently long so that the test section is well beyond both the thermal and hydrodynamic entrance length of the microchannel. With the described dimensions, the rectangular microchannel has a hydraulic diameter of 9.756e-5m. The hydrodynamic entrance length can be described by the equation Lh = 0.05 Re Dh, such that the hydrodynamic entrance length for the microchannel is 122 im. The thermal entrance length can be calculated by L, = 0.033 Re Pr Dh, putting the thermal entrance length at 563 pm. Given these entrance lengths, it is clear that even a channel of a few millimeters in length would be enough to obtain a meaningful test section. At this point, the determination of the length of the channel became a decision based on the dimensions of the thermometers and ease of wiring. Based on dimensional and geometric placement of thermometers, the overall channel length was
determined to be 3.5 cm. This length provides sufficient length between thermometers to allow easy wiring and help to mitigate thermal saturation of the channel by conduction axially through the silicon. At either end of the channel is a 1 cm by 1 cm reservoir at the same depth as the microchannel. This allows fluid from the inlet sufficient time to settle before entering the
channel. In terms of heating the channel, the design condition was to provide sufficient power to raise the temperature of pure water 10K between the inlet and the outlet. This would ensure sufficient power to melt the PCM within the confines of the test section. Given this requirement, and a Reynolds number of 25, the heat input requirement can be calculated. Assuming that the heat generator can be approximated as a source of constant heat flux along the entire floor of the
channel, the needed heat can be calculated using P = m c, AT. The mass flow rate can be determined from the Reynolds number of 25 and the properties of water at 323K, which is approximately the proposed operational temperature of the channel. Relating the mass flow rate to the Reynolds number gives a value of 1.40e-5 kg/s. This corresponds to a volume flow rate of
0.85 mL/min, which would allow for a test of many minutes with only a small batch of
nanofluid. Given the mass flow rate, the input power required to heat the fluid becomes 0.586 W. Heat will be provided to the microchannel by a patterned aluminum heater on the back side of the device. The aluminum heater is designed to provide a 1.2 W of heat in order to guarantee that the microchannel has the necessary power to heat the fluid in the channel. Due to contact lithography limitations, the maximum thickness of Al that can be patterned onto the silicon wafer is 1 pm. Based on observations from other heaters used for similar applications, the heater is a series of 50 pm wide Al lines running back and forth along the length of the channel, with a spacing of 50 pm between each of the lines. The first Al line begins 200 pm outside of the channel to provide the most uniform heat flux possible. A 300 pm gap between lines is placed along the centerline of the channel to allow room for the incorporation of thermometers. These design specifications result in twenty-two 50 pm wide Al lines running the length of the 3.5cm channel for a total resistor length of 0.7718m. The resistivity of Al is 2.7e-8 Q-m for a total resistance of 416.772Q. At this resistance 54 mA of current will be sufficient to supply 1.2 W of power to the device. With such small resistors, it is important to make sure that the
electromigration limit of Al is not exceeded, as this could severely shorten the effective operational life of the heater. Below current densities of le5 A/cm2, the effects of
electromigration in Al are negligible. The current density of the Al heater at the design loading is below this threshold value and electromigration is not expected to be a problem.
![Figure 1. Flat plate solar collector [1], and evacuated tube heat pipe solar collector [2].](https://thumb-eu.123doks.com/thumbv2/123doknet/14686152.560299/13.918.181.799.489.796/figure-flat-plate-solar-collector-evacuated-solar-collector.webp)
![Figure 4. Two tank molten salt storage system [4].](https://thumb-eu.123doks.com/thumbv2/123doknet/14686152.560299/18.918.128.795.570.962/figure-two-tank-molten-salt-storage-system.webp)
![Figure 6. Heat flux curves for pure n-octadecane and prepared nanoencapsulated n-octadecane [7].](https://thumb-eu.123doks.com/thumbv2/123doknet/14686152.560299/24.918.278.660.450.720/figure-heat-flux-curves-octadecane-prepared-nanoencapsulated-octadecane.webp)
![Figure 8. Heat flux curves for pure indium, PAO, and indium in PAO nanofluid [8].](https://thumb-eu.123doks.com/thumbv2/123doknet/14686152.560299/26.918.262.680.247.559/figure-heat-flux-curves-pure-indium-indium-nanofluid.webp)

![Table 6. Candidate Fatty Acids for Use as a Low Temperature Phase Change Material [10] Compound Propyl palmiate Isopropyl palmiate Capric-lauric acid + pentadecane (90:10) Isopropyl stearate Caprylic acid Capric-lauric acid (65 molA-35 mol%](https://thumb-eu.123doks.com/thumbv2/123doknet/14686152.560299/34.918.124.810.130.831/candidate-temperature-material-compound-isopropyl-pentadecane-isopropyl-caprylic.webp)