Unlocking the barley genome by chromosomal and comparative genomics
26
0
0
Texte intégral
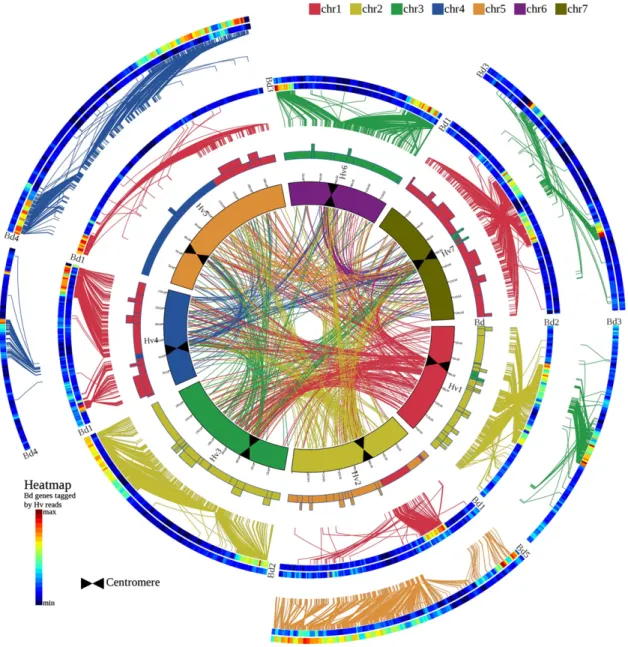
Figure
Documents relatifs
