Publisher’s version / Version de l'éditeur:
Vous avez des questions? Nous pouvons vous aider. Pour communiquer directement avec un auteur, consultez la première page de la revue dans laquelle son article a été publié afin de trouver ses coordonnées. Si vous n’arrivez pas à les repérer, communiquez avec nous à [email protected].
Questions? Contact the NRC Publications Archive team at
[email protected]. If you wish to email the authors directly, please see the first page of the publication for their contact information.
https://publications-cnrc.canada.ca/fra/droits
L’accès à ce site Web et l’utilisation de son contenu sont assujettis aux conditions présentées dans le site LISEZ CES CONDITIONS ATTENTIVEMENT AVANT D’UTILISER CE SITE WEB.
The XXI Congress of the International Society for Photogrammetry and Remote
Sensing (ISPRS 2008) [Proceedings], 2008
READ THESE TERMS AND CONDITIONS CAREFULLY BEFORE USING THIS WEBSITE. https://nrc-publications.canada.ca/eng/copyright
NRC Publications Archive Record / Notice des Archives des publications du CNRC :
https://nrc-publications.canada.ca/eng/view/object/?id=fe50e770-64f6-4214-91a4-9c246b097ab2
https://publications-cnrc.canada.ca/fra/voir/objet/?id=fe50e770-64f6-4214-91a4-9c246b097ab2
NRC Publications Archive
Archives des publications du CNRC
This publication could be one of several versions: author’s original, accepted manuscript or the publisher’s version. / La version de cette publication peut être l’une des suivantes : la version prépublication de l’auteur, la version acceptée du manuscrit ou la version de l’éditeur.
Access and use of this website and the material on it are subject to the Terms and Conditions set forth at
Surface Reconstruction of Large Complex Structures from Mixed
Range Data - The Erechtheion Experience
National Research Council Canada Institute for Information Technology Conseil national de recherches Canada Institut de technologie de l'information
Surface Reconstruction of Large Complex
Structures from Mixed Range Data - The
Erechtheion Experience *
El-Hakim, S., Beraldin, J.-A., Picard, M., and Cournoyer, L.
July 2008
* The XXI Congress of the International Society for Photogrammetry
and Remote Sensing (ISPRS 2008). July 3, 2008.
Copyright 2008 by
National Research Council of Canada
Permission is granted to quote short excerpts and to reproduce figures and tables from this report, provided that the source of such material is fully acknowledged.
SURFACE RECONSTRUCTION OF LARGE COMPLEX STRUCTURES FROM MIXED
RANGE DATA – THE ERECHTHEION EXPERIENCE
S. El-Hakim*, J.-A. Beraldin, M. Picard, L. Cournoyer
Visual Information Technology (VIT), National Research Council (NRC), Ottawa, Canada – (Sabry.El-hakim,
Angelo.Beraldin, Michel.Picard, [email protected])
KEY WORDS: Cultural Heritage, Acquisition, Laser scanning, Modelling, Registration, Multi resolution, Visualisation.
ABSTRACT:
We present the procedure and technologies used to modelling of the Erechtheion at the Acropolis in Athens, a large complex structure with many challenges to data acquisition, processing, and visualisation. We used two scanners, one for medium range high-resolution coverage (1-5 mm lateral data spacing) and one long-range scanner to capture some top sections occluded from the first scanner. We also used high-resolution digital images for image-based reconstruction using Photogrammetric and image matching techniques and for texture mapping. We focus in this paper on the geometric reconstruction from the range sensors. Several issues had to be addressed. Our system must be able to work with data obtained at different resolutions and accuracies and acquired from any viewpoint. The marble surfaces were of different age from one part to another due to decades of restoration. This resulted in different reflectance properties and apparent laser penetration that varied from area to area. Another problem resulted from the huge amount of data. The billions of generated 3D points by all sensors are currently beyond the processing capabilities of commercially available software or hardware. Reducing the data to a manageable size without losing important details had to be addressed.
1. INTRODUCTION 1.1
1.2
Project Outline and the Main Requirements The Erechtheion (figure 1), completed in 406 B.C., is a large
complex monument that consists of several different sections and compartments. It is built on a slope with the south and east sides about 3 meters higher than the north and west sides. The entire structure is made of marble and remains impressive in spite of the fact that it is only a remnant of what it used to be and missing most of its art and decorations. For example, as shown in figure 2, the friezes are missing their triglyphs and metopes, and only very small parts of the pediments remain. The famous porch of the Caryatids (Maidens) has replicas of the original statues while the mouldings on the entablature and the podium are mix of original and replicas.
This work is part of the project “Development of Geographic Information Systems at the Acropolis of Athens“ (Moullou & Mavromati, 2007). The goal of the project is the development of GIS with the associated databases for documentation, restoration management, and presentation of the monuments and surrounding walls and landscape, starting with the Erechtheion, which is so far the only fully restored monument on the Acropolis. This requires the creation of a richly detailed accurate 3D model. The resolution and visual quality of the rendered model should ideally match what is perceptible by the human eyes on a real visit, preferably when at close up range. A movie with photo-realistic colour and lighting is also required. To capture details needed for documentation and restoration, lateral data spacing (spatial resolution) of the 3D model should be about 5 mm in most parts and 1-2 mm on the highly detailed parts. Local depth uncertainty and overall accuracy must be 1 mm and 10 mm, respectively. For interactive visualisation the 3D model must be viewable on a standard workstation. On such large complex structure, it is very challenging to achieve all the requirements throughout the modelling pipeline. The procedure and techniques we adopted will be discussed next.
The Implemented Approach
Range sensors, such as laser scanners, can provide highly detailed accurate representation of most shapes (Blais 2004). Combined with colour information, either from the sensor itself or from a digital camera, a realistic-looking model can be created. On the other hand most scanners can be bulky, which is a disadvantage on difficult terrain. The results are influenced by surface light scattering and absorption properties. Since marbles are made of translucent crystals, they are problematic (Godin et al, 2001). One must also be careful in selecting a range sensor for a project as they are intended for a specific range, thus one designed for close range may not be suitable for medium or Figure 1: The Erechtheion today (late 2007)
Figure 2: Missing architectural elements
longer ranges. Image-based modelling (IBM) techniques can produce accurate and realistic-looking models using low cost portable digital cameras. But they are highly interactive which limit the amount of details a model can have. Fully automated IBM methods are still unproven in real applications and require large number of closely spaced images, which is impractical for large monuments. Also occlusions and lack of textures are persistent problems for 3D from imaging methods. Due to all of the above, we decided to use a combination of technologies in this project:
1. A high accuracy mid-range laser scanner for most parts 2. A long-range laser scanner for sections on top unreachable
by first scanner
3. Image-based methods to fill gaps in hard to access areas 4. Images from a balloon to model the landscape and upper
parts not captured by the above techniques
Figure 3 outlines the data acquisition and 3D reconstruction steps designed for this project. The most time consuming operations for large complex site, are:
1. Deciding on the next best view 2. Registration of the multiple scans
3. Registration of texture images with the geometric model 4. Editing and filling holes to create a watertight model Developing procedures to facilitate or fully automate these operations is a necessity and remains an active research area.
Figure 3: 3D imaging, modelling, and visualisation steps This paper deals with 3D modelling from range sensors only. Image based modelling is covered in Remondino et al., 2008. 1.3
2.1
Previous Work
There is a large body of work on using laser scanners for heritage applications. Here we focus on work related to the Acropolis and similar large-scale monuments. Models of some Acropolis structures have been created in the past few years. A computer animation “The Parthenon” virtually reunited this main Acropolis structure with its sculptures, which have been in various museums for over two centuries (Stumpfel et al., 2003, Debevec, 2005). The models were created using 3D laser scanning, structured light, Photogrammetry, and photometric stereo. The movie also used image-based rendering and inverse global illumination. A project on digitising the Parthenon with a time of flight (TOF) laser scanner at 12mm spatial resolution (Lundgren, 2004) was reported. Managing the resulting huge datasets, starting with about 7 billion raw 3D points, was
attempted by using a volumetric approach that divide the data into voxels of different sizes. The highest-resolution model contained 87 million polygons. Extensive study of changes to the Erechtheion from the 16th century to 2004, including an AutoCAD-based 4D model was carried out (Blomerus & Lesk, 2007). The model was based on paintings, drawings, and photos from those periods. Also pertinent to our project, issues with detailed scanning of large marble statues were addressed (Levoy et al., 2000). Difficulties to digitally reconstruct large complex sites, particularly due to the considerable manual work, were identified (Beraldin et al., 2006). Thus, automating some steps such as registering multiple scans and texture mapping is highly desirable (Allen et al., 2005). Interactive visualisation with huge models remains a very active research area. Luebke et al., 2002 and Dietrich et al., 2007 cover many aspects. Aliaga et al., 1999 presented a system for rendering very complex 3D models at interactive rates. It selects a subset of the model as preferred viewpoints and partition the space into virtual cells. Each cell contains near geometry rendered using LOD and visibility culling, and far geometry rendered as a textured depth mesh. GigaWalk (Baxter et al., 2002) is a system for interactive walkthrough of huge environments. It combines occlusion culling and LOD and uses two graphics pipelines with one or more processors. Geo-morphing of LOD (GoLD) is a view-dependent real-time technique for multi-resolution models (Borgeat et al., 2007). It uses geo-morphing to smoothly interpolate between both geometric and texture patches composing a hierarchical LOD structure to maintain seamless continuity between adjacent patches.
2. THE MAIN CHALLENGES
In this project, several challenges were encountered. Data acquisition, processing, and visualisation, all had problems related to the size, complexity, and material of the monument.
Data Acquisition:
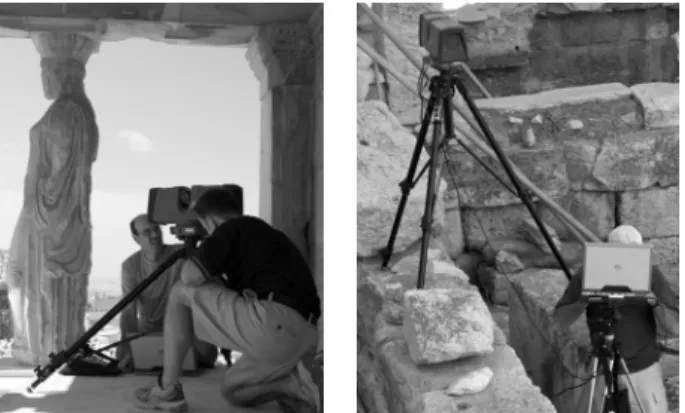
The size, setting, and the monument surface created several problems. The height made coverage from ground level difficult on top parts. Some problems due to obstructions and terrain (figure 4) caused delays and resulted in missed areas. Some parts shape complexity caused self-occlusions, and impediments from plants/trees created holes in the coverage.
Figure 4: Examples of difficult on-site scanner setting Due to many restorations, the monument marbles varied in age and amount of dirt deposits on surface. Laser spot scattering from marble crystals causes increase in noise while apparent penetration causes systematic shift - both vary with marble age, erosion, and surface dirt, but actual values are difficult to
determine due to lack of complete understanding of surface response. Thus it is hard to completely correct this problem. 2.2
2.3
2.4
3.1
Data Processing
The huge data is impossible to process at the acquired high resolution, yet processing at lower resolution affects accuracy of operations such as registration. Reducing data size with simplification technique must ensure no loss of important details. Also combination of data taken by different sensors at different resolution, accuracy, and viewpoints affect the overall model accuracy if the quality of the different data are not properly considered. Despite using several sensors, some gaps and holes remained. This raises an important question: should we fill those with interpolated, but possibly inaccurate, surface patches or leave them out even though they may be visually unpleasant? One solution is to fill the gaps but keep accessible record of those uncertain filled areas.
Realistic Appearance
Photo-realism, defined as having no difference between the view rendered from the model and a photograph taken from the same viewpoint, goes much further than simply draping static imagery over geometry. Due to variations in lighting, surface specularity and camera gain settings, sensed colour and intensity for a segment shown in images taken from separate positions will not match. This is particularly problematic on large open-air site like the Acropolis. Also, measurement of surface reflection properties must be included for proper model lighting. However, the texture images contain whatever illumination existed at imaging time. Ideally this illumination should be removed and replaced by dynamic illumination consistent with the rendering point of view. Another problem is that the range of brightness in the scene cannot be captured in a single exposure by current digital cameras. This causes loss of details in the dark areas (shadows) and saturation in the bright areas (sun) if both coexist in the scene. It is thus important to acquire high dynamic range (HDR) images to recover all scene colours (Reinhard et al, 2005).
Interactive Visualisation
The ability to interact with 3D models is a continuing problem due to the fact that the demand for detailed model is growing at faster rate than computer hardware advances. The rendering algorithm should be capable of delivering images at real-time frame rates of at least 20 frames-per-second even at the full resolution of both geometry and texture. We use the Atelier 3D system, a view-dependent real-time system for multi-resolution models. When at close up the full resolution is shown then it decreases when moving away. It is based on the GoLD system (Borgeat et al., 2007) described in section 1.3 above.
3. MODELLING FROM RANGE SENSORS The steps for creating 3D models from laser scanning are well established (Bernardini and Rushmeier, 2002). Here, we summarise the acquisition, processing, and texture mapping of data from such sensors as implemented in this project.
Field Work and Data Collection
As with this type of project, adequate planning before the actual field work demands a systematic approach to identify the
proper sensor technology, estimate time for different scanning methodologies, define quality parameters, etc. The fieldwork must be completed within a specific time dictated by the availability of equipment and support personnel, allowed access to the site, and project budget. Thus, it is important to assemble an optimum team on the site to handle all operations effectively. Five days with three persons were spent as follow: one person for scanning; one person for initial scan alignment (see section 3.2), data backups, and general guidance; and one person for digital imaging for texture mapping and IBM. To satisfy the project requirement, the Surphaser® 25HSX TOF phase-shift based laser scanner was selected (Figure 5). It can acquire the data at about 5 m range with a noise level of 0.25 mm (standard deviation), and accuracy of less than 1 mm (maximum error). This has been verified with our own tests on and off site in our 3D metrology lab (Beraldin et al., 2007). Figure 6 shows the results of a test with the Surphaser® scanner that confirms its ability to capture sub-millimetre details. Other tested scanners failed to capture those details. However, to achieve this accuracy on marble apparent laser penetration errors (about 5 mm) must be corrected.
Figure 5: The Surphaser® 25HSX laser scanner
Figure 6: Validation test with the Surphaser®
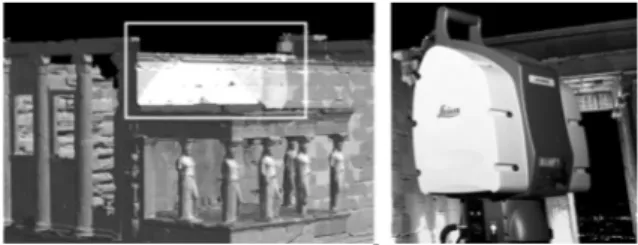
Figure 7: Area captured by Leica® HD3000 laser scanner The Surphaser® data should be acquired from a tripod at a height not exceeding 2.5m due to the windy conditions. This results in the scanning not reaching the top sections. Therefore, a long-range TOF pulsed scanner, Leica HDS3000®, was used to fill-in those gaps on the top of the structure by placing the scanner on higher grounds at 80-100 meters away. Figure 7 shows top of the Caryatids porch which was not visible from the close-range Surphaser® but visible to Leica® scanner.
For texture mapping, HDR images were taken. This requires taking at least 4 images at different shutter speed and combining them to create one HDR image.
3.2
3.3
Range Data Processing
Processing of the data was performed with commercial as well as our own in-house software tools, which were developed to achieve high geometric accuracy and visual quality while increasing the level of automation. However, an amount of user interaction and editing is still unavoidable. The raw scans, which are collections of XYZ points in the scanner coordinate system, contain errors and noise that must be filtered out and holes that should be filled (Weyrich et al., 2004). Next step is the aligning or registration of all the scans in one coordinate system. Due to object size and shape and obstacles, it is necessary to use a large number of scans from different locations and directions to cover every surface at the desired spatial resolution or level of detail. Aligning those scans requires significant effort and affects the final accuracy of the 3D model. It is performed in two steps: (1) initial alignment using positioning device or the data itself by selecting common points between the scans; followed by (2) a more precise
Iterative Closest Point (ICP) technique (Salvi et al., 2007). A
global alignment is done at the end to minimize and distribute remaining errors equally. We perform the first step in the field on a 64-bit notebook PC with 4 Giga Bytes of RAM. As soon as a scan is completed, it is first simplified to 2% of its original size for faster processing then three common points are selected and used for initial alignment with the preceding scan. This is done while the scanner is acquiring a new scan, so it does not consume additional time. We also use this to ensure full coverage before moving the scanner to the next position. Once the scans are aligned, they need to be integrated to remove redundant points in the overlap region followed by the reconstruction of a triangular mesh that closely approximates the surface of the object (Varady et al., 1997).
After the mesh has been reconstructed, some repairing is often needed to fill cracks and holes and fix incorrect triangles and degenerate or non-manifold surface parts (Borodin et al., 2002, Liepa 2003). Such errors result in visible faults, and lighting blemishes due to incorrect surface normals. Another problem is the fact that the object is rarely sampled optimally. Some areas such as edges and high curvature surfaces are usually under-sampled and end up joined by a transitional surface rather than a sharp edge, while flat areas are often over-sampled. For accurate documentation and visual realism, edges and sharp corners must be accurately preserved in the model. Dey et al., 2001 proposed a technique for automatic detection and correction of such sampling problems while Luebke et al., 2002 survey simplification techniques needed to deal with over-sampling. Surface subdivision is another way to improve under-sampled areas (Zorin et al., 1996). The triangles in these areas are subdivided into smaller triangles with points shifted according to pre-set rules. Other methods to sharpen edges in meshes are available (e.g. Lai et al., 2007).
Texture Mapping
Colouring and texturing was captured with the Canon® 5D digital camera, a 12M Pixels full-frame SLR camera. We create HDR images from the captured multi-exposure raw images, as mentioned in section 3.1 above. The images are registered with the geometric model using common points between them and the 3D model. In effect, this is finding the camera pose using the model points as control points. This must be done for every
image unless the camera is fixed to the scanner, then it may only be done once. However, mounting and fixing the camera to the scanner means that the images are taken at the same time and location as scanning. This is not necessary the best for texture images since we need to select the time of day that provides the best lighting, take images in a short period of time to ensure small lighting changes, and select the best distance, viewing angle, and camera setting. Thus, we opted for the taking the texture images independent of the scanner, which necessitated the development of an automated approach that registers and calibrates each image with the 3D geometry. One technique to facilitate this operation registers the texture images together first then use only one of the images to register with the geometry (El-Hakim et al, 2004 and Stamos et al, 2008). For this approach to be accurate, it requires taking images with sufficient overlap and strong configuration, which imposes restrictions in the field. We use this approach only as an initial estimation for a more accurate registration based on matching of features in the texture image and the scanner intensity image. Once the images are registered with the geometric model, several geometric and radiometric processes have to be carried out to ensure seamless transitions and distortion-free texture maps (El-Hakim and Beraldin, 2007).
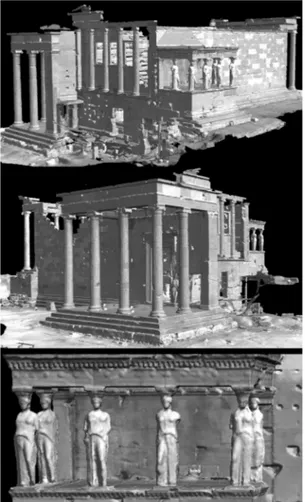
Figure 7: Two snapshots of the compressed 3D model
4. RESULTS AND ACCURACY ANALYSIS 4.1 The First Model
The Project first phase calls for the creation of a lower resolution model (10 million polygons, 15mm lateral spacing and more on flat surfaces) that is complete and interactively
viewable on a high-end PC. The objective is to make sure that all the monument has been covered and that the data can be processed and integrated successfully. Figure 7 shows results of this phase. Notice the lack of fine details on the Caryatids.
Figure 8: High-resolution model of a Caryatid column. Work on the full resolution model is in progress since merging and repairing such huge data sets remains time consuming. Some parts have been completed. Figure 8 shows the full resolution model of one of the Caryatids columns. Although the original points were captured at 1-2 mm lateral spacing, simplifications were necessary to reduce data size. On sharp features, the original data was not reduced, while on flat areas reductions were made without sacrificing details.
4.2 Initial Accuracy Test Results
Regions of the Erechtheion, with variable surface roughness and marble age, were selected for testing the performance of the laser scanners on this material. One test was to estimate the amount of apparent laser penetration on marble. A sheet of paper was placed on a nearly flat wall of the monument, and then scanned along with the surrounding region. A plane is fitted to the paper surface and the normal distance between every scanned point and that plane was computed.
Figure 9: Marble penetration: comparison with paper sheet. Green is zero, red is 7mm positive, and purple is 7mm negative.
As shown in figure 9 the colour-coded depth indicates that the marble surface is about 5mm lower than paper surface, which is not true since the paper was right on the marble surface (paper thickness is about 0.1 mm). This systematic range error may be
attributed to a combination of laser penetration and unusual backscattering properties of the laser light on this type of marble. The spatial and temporal distribution of the laser light collected by the scanner seems to affect adversely the time delay estimate of the modulated signal. One also observes that adhesive lines between the marble blocks look as if they were higher than the marble surface, while in reality they are lower. Both scanners exhibited a similar behaviour, with the Leica® scanner showing less penetration. The above tests prove that there is an apparent significant laser penetration into the marble, however the exact amount of that penetration and how to correct it over marbles of different age are still not entirely solved problems.
5. CONCLUSIONS
The data acquisition, processing, problems encountered, and some results and analysis of the digital reconstruction of the Erechtheion have been presented. Multiple sensors and techniques were employed and some tools had to be adapted for use with large complex monuments. Such tools, along with the gained experience and lessons learned will be valuable for future projects of modelling comparable structures. Full model at compressed resolution (10 million polygons) has been completed, while work on the full resolution model (several billions of polygons) is currently in progress. An effective and precise solution to the problems of laser scanning marble surfaces is being developed. Additional future work includes the integration of 3D data of landscapes and models of missing top parts of the monument produced by the balloon-based aerial images, and the final texturing and lighting of the full model under different times of the day and different seasons. A high quality computer animation of the site is also in production. The incorporation of the 3D model in a GIS database with other information will be the final phase of the project.
6. ACKNOWLEDGEMENTS
This project is financed by the EU and the Government of Greece and supervised by the Acropolis Restoration Service (YSMA), Hellenic Ministry of Culture. Our partners included Elliniki Photogrammetriki Ltd. (Elpho), Athens, Swiss Federal Institute of Technology - ETH-Zurich, and Geotech O.E., Athens. Leica Geosystems, Switzerland and Basis Software Inc., USA, supplied the laser scanners.
7. REFERENCES
Aliaga, D., Cohen, J., Wilson, A., Baker, E., Zhang, H., Erikson, C., Hoff, K., Hudson, T., Stürzlinger, W., Bastos, R., Whitton, M., Brooks, F. Manocha, D., 1999. MMR: An interactive massive model rendering system using geometric and image-based acceleration. In Symposium on Interactive 3D
Graphics, Atlanta, USA, 26 April -2 May, pp. 199-206.
Allen, P., Troccoli, A., Blaer, P., 2005. Automating the 3D Modeling Pipeline, In CREST 3D Modeling Symposium, March 9-11, Tokyo.
Baxter III, W., Sud, A., Govindaraju, N.K., Manocha, D., 2002.
GigaWalk: Interactive walkthrough of complex environments.
Beraldin, J.-A., Blais, F., Cournoyer, L., Picard, M., Gamache, D., Valzano, V., Bandiera, A., and Gorgoglione, M., 2006. Multi-Resolution Digital 3D Imaging System Applied to the Recording of Grotto Sites: The Case of the Grotta dei Cervi. 7th Intern. Symposium on Virtual Reality, Archaeology and Cultural Heritage, VAST, Cyprus. Oct. 30 – Nov. 4.
Beraldin, J.-A., Blais, F., El-Hakim, S.F., Cournoyer, L., Picard, M. 2007. Traceable 3D imaging metrology: evaluation of 3D digitizing techniques in a dedicated metrology laboratory. Optical 3D measurement conference, Zurich, Switzerland, July, pp. 310-318.
Bernardini, F. and Rushmeier, H., 2002. The 3D model acquisition pipeline. Computer Graphics Forum, 21(2), pp. 149-172.
Blais, F., 2004. Review of 20 years of range sensor development. J. Electronic Imaging, 13(1), Jan., pp. 232-240. Blomerus, P., Lesk, A., 2007. Using AutoCAD to construct a 4D block-by-block model of the Erechtheion on the Akropolis at Athens. CSA Newsletter, XX(2), online (accessed: April 2008) [http://csanet.org/newsletter/fall07/nlf0701.html]. Borgeat, L., Godin, G., Massicotte, P., Poirier, G., Blais, F., Beraldin, J.-A. 2007. Visualizing and Analyzing the Mona Lisa,
IEEE Computer Graphics and Applications, 27(6), pp. 60–68.
Borodin, P., Novotni, M. and Klein, R., 2002. Progressive gap closing for mesh repairing. In Advances in Modelling, Animation and Rendering, pp. 201–213.
Debevec, P., 2005. Making "The Parthenon". In 6th International Symposium on Virtual Reality, Archaeology, and Cultural Heritage, VAST, Pisa, Italy.
Dey, T.K., Giesen, J., Goswami, S., Hudson, J., Wenger, R. and Zhao, W., 2001. Undersampling and oversampling in sample based shape modelling. In IEEE Visualization, San Diego, CA, Oct 21-26, pp. 83-90.
Dietrich, A., Gobbetti, E. and Yoon, S.-E., 2007. Massive-model rendering techniques: a tutorial, IEEE Computer
Graphics and Applications, 27(6), pp. 20-34.
El-Hakim, S., and Beraldin, J.-A., 2007, Sensor Integration and Visualization. Chapter 10 of Applications of 3D Measurement
from Images (Fryer, Mitchell & Chandler, eds.), Whittles
Publishing, UK, pp.259-298.
El-Hakim, S.F., Fryer, J., Picard, M. and Whiting, E., 2004. Digital recording of aboriginal rock art. In Int. Conf. Virtual Systems and Multimedia (VSMM’04), Ogaki, Japan, pp. 344-353.
Godin, G., Rioux, M., Beraldin, J.-A., Levoy, M., Cournoyer, L., Blais, F., 2001. An assessment of laser range measurement on marble surfaces, In 5th Conf. Optical 3D Measurement Techniques, 1-4 Oct, Vienna, pp. 49-56.
Lai, Y.-K., Zhou, Q.-Y., Hu, S.M., Wallner, J. and Pottmann, H., 2007. Robust feature classification and editing. IEEE Trans.
Visualization and Computer Graphics, 13(1), pp. 34-45.
Levoy, M. et al., 2000. The Digital Michelangelo Project: 3D scanning of large statues. In SIGGRAPH 2000, New Orleans, 24-28 July, pp. 131-144.
Liepa, P., 2003. Filling holes in meshes. In Eurographics/ACM SIGGRAPH symposium on Geometry processing (SGP), volume 43, pp. 200-207.
Luebke, D., Reddy, M., Cohne, J., Varshney, A., Watson, B. and Huebner, R., 2002. Level of detail for 3D graphics. Morgan-Kaufmann Publishers.
Lundgren, T., 2004. Digitizing the Parthenon using 3D scanning – managing huge datasets. M.Sc. Thesis, Linkoping University, Sweden.
Moullou, D., Mavromati, D., 2007. Topographic and photogrammetric recording of the acropolis of Athens, XXI International CIPA Symposium, 1-6 Oct., Athens, Greece. Reinhard, E., Ward, G., Pattanaik, S., Debevec, P., 2005. High
Dynamic Range Imaging: Acquisition, Display, and Image-Based Lighting, Morgan Kaufmann Publishers, San Francisco.
Remondino, F., Baltsavias, E., El-Hakim, S., 2008. Image-based 3D modelling of the Erechtheion, Acropolis of Athens, ISPRS XXI Congress, 3-11 July, Beijing, China.
Salvi, J, Matabosch, C., Fofi, D, Forest, J., 2007. A review of recent range image registration methods with accuracy evaluation. Image and Vision Computing, 25(5), pp. 578-596. Stamos, I., Liu, L., Chen, C., Wolberg, G., Yu, G., Zokai, S. 2008. Integrating automated range registration with multiview geometry for the photorealistic modelling of large-scale scenes.
International Journal of Computer Vision, 78(2-3), pp.
237-260.
Stumpfel. J., Tchou, C., Yun, N., Martinez, P., Hawkins, T., Jones, A., Emerson B, Debevec, P., 2003. Digital reunification of the Parthenon and its sculptures. In Virtual Reality, Archaeology and Cultural Heritage, VAST 2003, pp. 41-50. Varady, T., Martin, R.R. and Cox, J., 1997. Reverse engineering of geometric models – an introduction. Computer
Aided Design, 29(4), pp. 255-268.
Weyrich, T., Pauly, M., Keiser, R., Heinzle, S., Scandella, S., and Gross, M., 2004. Post-processing of scanned 3D surface data. In Eurographics Symposium on Point-Based Graphics, Zurich, pp. 85-94.
Zorin, D., P. Schröder, and Sweldens, W., 1996. Interpolating subdivision for meshes with arbitrary topology. In SIGGRAPH ’96, pp.189–192.