Apical Sarcomere-like Actomyosin Contracts
Nonmuscle Drosophila Epithelial Cells
The MIT Faculty has made this article openly available.
Please share
how this access benefits you. Your story matters.
Citation
Coravos, Jonathan S., and Adam C. Martin. “Apical
Sarcomere-Like Actomyosin Contracts Nonmuscle Drosophila Epithelial Cells.”
Developmental Cell 39, no. 3 (November 2016): 346–358.
As Published
http://dx.doi.org/10.1016/J.DEVCEL.2016.09.023
Publisher
Elsevier BV
Version
Author's final manuscript
Citable link
http://hdl.handle.net/1721.1/116723
Terms of Use
Creative Commons Attribution-NonCommercial-NoDerivs License
Apical sarcomere-like actomyosin contracts nonmuscle
Drosophila epithelial cells
Jonathan S. Coravos1 and Adam C. Martin1
1 Department of Biology, Massachusetts Institute of Technology, Cambridge, MA 02142, USA
Summary
Actomyosin networks generate contractile force that changes cell and tissue shape. In muscle cells, actin filaments and myosin II appear in a polarized structure called a sarcomere, where myosin II is localized in the center. Nonmuscle cortical actomyosin networks are thought to contract when nonmuscle myosin II (myosin) is activated throughout a mixed-polarity actin network. Here, we identified a mutant version of the myosin-activating kinase, ROCK, that localizes diffusely, rather than centrally, in epithelial cell apices. Surprisingly, this mutant inhibits constriction, suggesting that centrally localized apical ROCK/myosin activity promotes
contraction. We determined actin cytoskeletal polarity by developing a barbed end incorporation assay for Drosophila embryos, which revealed barbed end enrichment at junctions. Our results demonstrate that epithelial cells contract with a spatially organized apical actomyosin cortex, involving a polarized actin cytoskeleton and centrally positioned myosin, with cell-scale order that resembles a muscle sarcomere.
Graphical abstract
Corresponding author & Lead Contact: Adam C. Martin, acmartin@mit.edu, 31 Ames St., Cambridge, MA 02142, USA.
Publisher's Disclaimer: This is a PDF file of an unedited manuscript that has been accepted for publication. As a service to our
customers we are providing this early version of the manuscript. The manuscript will undergo copyediting, typesetting, and review of the resulting proof before it is published in its final citable form. Please note that during the production process errors may be discovered which could affect the content, and all legal disclaimers that apply to the journal pertain.
Author Contributions
J.S.C. and A.C.M. designed and performed experiments, analyzed data, and wrote the manuscript.
HHS Public Access
Author manuscript
Dev Cell. Author manuscript; available in PMC 2017 November 07.
Published in final edited form as:
Dev Cell. 2016 November 7; 39(3): 346–358. doi:10.1016/j.devcel.2016.09.023.
A
uthor Man
uscr
ipt
A
uthor Man
uscr
ipt
A
uthor Man
uscr
ipt
A
uthor Man
uscr
ipt
Keywords
myosin; ROCK; contraction; morphogenesis; sarcomere; actin cortex; epithelia; cell polarity
Introduction
Cell and tissue shape changes emerge from forces generated by myosin II and actin filaments. At the molecular scale, myosin II forms bipolar filaments with motor domains at both ends of a rod, which bind and move towards actin filament barbed ends (Sellers, 1991) (Fig. 1A). In muscle sarcomeres, this molecular apparatus is arranged and repeated at a larger scale, with actin filament barbed ends anchored at the sarcomere edges, and pointed ends oriented inward. Bipolar myosin II filaments overlap with actin filament pointed ends and, when the muscle is stimulated, pull in the actin filament arrays, shortening the sarcomere and contracting the muscle (Huxley and Hanson, 1954).
In cortical nonmuscle contexts, like individual cells (Charras et al., 2006; Flanagan et al., 2001), cell-cell epithelial interfaces (Simoes et al., 2014; Simões et al., 2010), and the apical surface of epithelial cells (Barrett et al., 1997; Clay and Halloran, 2013; Dawes-Hoang et al., 2005; Lee and Harland, 2007; Wójciak-Stothard et al., 2001), the contractile molecular actomyosin apparatus is still responsible for force generation, but actin filament networks are not thought to exhibit well-defined polarity. In these contexts, mixed-polarity actin networks are thought to contract from activation of nonmuscle myosin II (myosin)
throughout the network (Fig. 1A). This myosin activation often occurs downstream of RhoA (Ridley and Hall, 1992) and its effector, the myosin-activating kinase, Rho associated coiled-coil kinase (ROCK, rock) (Amano et al., 1996; Mizuno et al., 1999; Winter et al., 2001). Interestingly, actin networks reconstituted in vitro also begin with a mixed-polarity actin network, but contract into actomyosin asters after global activation of myosin in the network (Backouche et al., 2006; Köster et al., 2016; Murrell and Gardel, 2012; Stachowiak et al.,
A
uthor Man
uscr
ipt
A
uthor Man
uscr
ipt
A
uthor Man
uscr
ipt
A
uthor Man
uscr
ipt
2012). Based on these cases and other work, it has been proposed that nonmuscle cortical actin networks generate and orient forces through intrinsic properties of a uniformly
activated actomyosin network (Murrell et al., 2015; Vignaud et al., 2012), emerging possibly from the asymmetry in actin filament response to tension and compression (Stachowiak et al., 2012) or from actomyosin advection that carries upstream regulators of contractility (Munjal et al., 2015). In epithelia undergoing morphogenesis, the polarity of actin filament networks has not been determined, limiting our understanding of the mechanism of epithelial contractility (Mason et al., 2013; Munjal et al., 2015; Röper, 2012).
We investigated the importance of cell-scale actomyosin polarity in the columnar epithelial cells of the Drosophila ventral furrow. Apical constriction in these cells promotes
invagination of the prospective mesoderm, and leads to the formation of the ventral furrow (Martin et al., 2009; Polyakov et al., 2014; Rauzi et al., 2015). We have previously shown that ROCK is enriched in the center of the apical domain (medioapical), displaying a type of cell polarity we termed radial cell polarity, in which proteins are polarized along the radial axis from the centroid to cell edge (Mason et al., 2013; Vasquez et al., 2014). Mutation or depletion of the ventral furrow transcription factor Twist disrupts medioapical ROCK polarization and disrupts apical constriction (Mason et al., 2013; Xie and Martin, 2015). As a transcription factor, Twist is several steps removed from the mechanism of actomyosin contractility and could have pleiotropic effects. Demonstrating the importance of ROCK localization in apical constriction therefore requires a direct perturbation of ROCK localization.
We identified a ROCK mutant that fails to polarize within the medioapical domain and demonstrated that medioapically polarized ROCK and myosin activity are required for apical constriction and tissue folding. We also determined that the apical actin network exhibits a cell-scale actin filament polarity, with pointed ends in the center of the apex and barbed ends around the apical periphery, suggesting that apical myosin binds and pulls inward on actin filament networks with barbed ends oriented towards the cell junctions. Finally, we show that the actin cytoskeleton is required to polarize ROCK within the apical domain, consistent with the idea that actomyosin feedback reinforces contractility (Munjal et al., 2015; Priya et al., 2015).
Results
Apically diffuse ROCK is insufficient for epithelial folding
To determine the function of medioapical ROCK polarization, we screened a collection of Venus-tagged and UAS-driven ROCK truncation mutants (rockwt =
UASp>Venus::rock1-1391, see Supplementary Experimental Procedures, Fly Stocks) (Simoes et al., 2014) for alleles that failed to localize in a radially polarized focus in the apical domain of ventral furrow cells. Our screen revealed that any construct including the coiled-coil domain was capable of exhibiting a medioapical polarization (Fig. 1B, columns 1-3 and 5). In contrast, deleting a portion of the coiled coil domain resulted in a mutant
(ROCKΔ547-923) that localized across the apex (Fig. 1B, column 6). ROCKΔ547-923 retains the N-terminal kinase domain and a C-terminal RhoA-binding domain, but removes a portion of the Shroom-binding domain, which interacts with the actin-ROCK scaffold
A
uthor Man
uscr
ipt
A
uthor Man
uscr
ipt
A
uthor Man
uscr
ipt
A
uthor Man
uscr
ipt
protein, Shroom (Hildebrand and Soriano, 1999; Mohan et al., 2012; Nishimura and Takeichi, 2008). However, we confirmed previous work showing that shroom knock-down does not disrupt ventral furrow formation or ROCK localization (Fig. S1A,B) (Simoes et al., 2014). This is consistent with the fact that ROCKΔ835-937, which lacks only the Shroom-binding domain, exhibits normal ROCK localization (Fig. 1B, column 5).
We next determined whether the apically enriched but diffuse ROCKΔ547-923 disrupted myosin localization. We expressed Venus-tagged rockwt and rockΔ547-923 in the rock2 null mutant background, with rockΔ547-923 being expressed at a level close to that of wild-type GFP-tagged rock expressed with its endogenous promoter (Fig. S1C). The localization of both proteins in the rock null background recapitulated the localization of the overexpressed proteins in our screen, including ventral-specific apical localization, and the more dispersed apical localization of ROCKΔ547-923 (Fig. 1C,D). In contrast to the rock2 mutant, which lacks apical myosin in the ventral furrow (Dawes-Hoang et al., 2005), both rockwt and rockΔ547-923 result in apical myosin, suggesting that the in vivo ROCK kinase activity of rockΔ547-923 is normal (Fig. 1E). Moreover, the reduction in basal myosin in ventral cells occurred normally in both rockwt and rockΔ547-923 mutants, demonstrating that the rockΔ547-923 mutant does not lead to inappropriate regulation of basal myosin (Fig. 1E). In surface views of ventral cells, myosin localization mirrored that of ROCK, such that in rockΔ547-923, myosin localized across the apical surface instead of concentrating into a medioapically-centered network (Fig. 1F). Thus, the rockΔ547-923 mutant appears to retain in vivo myosin-activating activity, but ROCK and myosin exhibit a more uniform distribution across the apical cortex. Consistent with this interpretation, a recent study showed that the in vitro kinase activity of a rock mutant similar to rockΔ547-923 was identical to that of wild-type ROCK (Truebestein et al., 2015).
Despite exhibiting apical ROCK and myosin localization, the rockΔ547-923 mutant failed to rescue ventral furrow formation in rock2 germline clones (Fig. 1D, Movie S1). The
rockΔ547-923 mutant did cause an initial flattening of the ventral domain, but failed to make a furrow. To determine whether the rockΔ547-923 mutant promoted tissue-level tension, we performed laser cutting experiments in the ventral tissue of rock2 mutants expressing rockwt or rockΔ547-923. To determine recoil velocities, we tracked the displacement of fluorescent ROCK away from the laser cut. We found that both conditions resulted in similar initial recoil velocities, suggesting that both alleles generated epithelial tension (Fig. 1G,H; S1D,E). In wild-type embryos expressing fluorescently-tagged myosin, we measured recoil velocities before and after the accumulation of a myosin network, and we found that rockwt and rockΔ547-923 generate more tension than the ventral epithelium prior to apical
contractility onset, and slightly less than the wild-type myosin network condition (Fig. 1G,H). The ability of rockΔ547-923 to rescue tension argues that the in vivo kinase activity of ROCKΔ547-923 is not affected and that its furrow phenotype resulted from another property of the mutant protein. One possibility is that ROCK needs to be medioapically localized to efficiently contract cells.
A
uthor Man
uscr
ipt
A
uthor Man
uscr
ipt
A
uthor Man
uscr
ipt
A
uthor Man
uscr
ipt
Diffuse apical ROCK kinase activity dominantly inhibits apical constriction
To further investigate the importance of proper ROCK localization, we expressed rockΔ547-923 in the presence of endogenous rock (Fig. S1F). We found that expressing rockΔ547-923, but not rockwt, blocked apical constriction and tissue folding even in the presence of endogenous wild-type ROCK (Fig. 2A-C; Movie S2). If reduced kinase activity or lower expression of ROCKΔ547-923 and thus, loss-of-function, were the reason for the failure of rockΔ547-923 to promote tissue folding, expressing rockΔ547-923 in the presence of endogenous rock would not be expected to cause a folding defect. Because ectopic rockwt was expressed more strongly than rockΔ547-923 and did not perturb apical constriction and folding, increased ROCK protein amount was not the reason for the rockΔ547-923 tissue folding phenotype (Fig. S1F). The differences in expression levels indicate that ROCKΔ547-923 is probably less stable than ROCKwt.
To determine if the dominant negative effect of rockΔ547-923 expression was the result of mislocalized kinase activity, we examined whether a kinase-dead mutation K(116)A suppressed the rockΔ547-923 phenotype (Fig. 2A-C, Movie S2). ROCKK(116)A,Δ547-923 was expressed at a greater level than ROCKΔ547-923 (Fig. S1F), and the K(116)A substitution suppressed the dominant negative ROCKΔ547-923 phenotype, suggesting that rockΔ547-923 inhibited contraction through incorrect kinase localization. By expressing the various rock alleles with labeled membranes, we were also able to quantify the radial distribution of ROCK fluorescence in each case, and found that whereas ROCK expressed via an
endogenous promoter (Fig. S1G) and ectopic ROCKwt are radially polarized around the cell geometric centroid, both ROCKΔ547-923 and ROCKK(116)A,Δ547-923 exhibited a flat
distribution on the radial axis (Fig. 2D). Thus, the dominant effect of rockΔ547-923 requires kinase activity and is associated with a flat distribution of ROCK localization across the apical surface. We propose that inhibition of apical constriction and tissue folding upon ectopic rockΔ547-923 expression is a result of ROCK kinase activity localized across the apical domain. Expressed in the wild-type rock background, rockΔ547-923 also caused myosin to localize more diffusely across the apex, rather than in a polarized manner, as was observed with rockwt overexpression (Fig. 2E). We found similar localization patterns for ROCKwt and ROCKΔ547-923 in the squamous epithelium of the amnioserosa (Fig. S1H), suggesting that medioapical ROCK activity and localization could play a role in concentrating myosin in the apical domain of other nonmuscle epithelial cells.
The apical F-actin cortex is polarized with junctional barbed ends and medial pointed ends
We next wanted to determine why a polarized distribution of ROCK and myosin was important for apical constriction. Because actin filament orientation influences contraction (Murrell et al., 2015; Reymann et al., 2012), we determined whether actin networks are also polarized in the apical cortex. Labeling actin networks with a protein that binds the sides of actin filaments does not detect polarity because the apical actin cortex forms a dense actin network. We therefore analyzed the localization of proteins that bind either the pointed or barbed ends of actin filaments. Surprisingly, we found that different end-binding proteins exhibited distinct localization patterns. Barbed end-binding proteins, such as adducin (Kuhlman et al., 1996; Xu et al., 2013) and capping protein α (Cap-α) (Amândio et al., 2014; Isenberg et al., 1980; Wear et al., 2003), were enriched at the junctional domain (Fig.
A
uthor Man
uscr
ipt
A
uthor Man
uscr
ipt
A
uthor Man
uscr
ipt
A
uthor Man
uscr
ipt
3A). We quantified this enrichment by determining the difference in fluorescence intensity between medioapical and junctional domains and normalizing this value to total
fluorescence intensity. Using this metric, junctional proteins, such as E-cadherin, exhibit a negative value. The intensity distribution of adducin and Cap-α also exhibited strong negative values, demonstrating junctional enrichment (Fig. 3B, S2A). In contrast, we found that the pointed end capping protein, tropomodulin (tmod), was localized in the center of the apical domain (Fowler et al., 1993; Weber et al., 1994), and MBS, a myosin binding protein that localizes to the center of the apical domain (Vasquez et al., 2014), colocalized with tmod (Fig. 3A). We quantified colocalization between tmod and MBS with the Manders Overlap Coefficient, which measures the amount of overlap between two signals in thresholded images, which were generated using the Costes method for rigorous and reproducible thresholding (Costes et al., 2004; Manders et al., 1993). We calculated a Manders Overlap Coefficient of 0.61 indicating that 61% of MBS signal colocalizes with tmod signal, and suggesting that pointed ends are enriched in the zone containing myosin at the apical center. The apical enrichment of tmod is specific to the ventral furrow, and adducin and Cap-α localize to junctions in cells adjacent to the ventral furrow region (Fig. S2B,C). Thus, specifically in contractile ventral furrow cells, barbed and pointed end-binding proteins exhibit distinct distributions, suggesting that actin networks have barbed ends enriched at apical junctions and pointed ends enriched in the apical center with myosin. To independently determine the position of actin filament barbed ends we injected
fluorescently-labeled actin monomers into embryos and fixed the embryos to identify the position of actin incorporation (Symons and Mitchison, 1991; Tang and Brieher, 2012). To ensure actin incorporated only at barbed ends, we injected an equimolar mixture of actin-488 and purified recombinant Drosophila profilin (chickadee) (Fig. S2D,E). Proflin-actin heterodimers can only bind to Proflin-actin filament barbed ends because profilin inhibits spontaneous nucleation and pointed end assembly (Pollard and Cooper, 1984; Schutt et al., 1993), and because profilinactin is recruited to growing barbed-ends by the formin, Dia (Goode and Eck, 2007). We fixed embryos within minutes of injection, and measured the intensity distribution of actin fluorescence incorporation in the apical cortex of ventral furrow cells. Compared to the distribution of total F-actin, labeled barbed ends were enriched at junctions (Fig. 3C,D, S2F), with some observed cases of medioapical
incorporation, which could be the result of de novo assembly by medioapical Dia (Mason et al., 2013). Actin incorporation at junctions was reduced by dia RNAi, suggesting that junctional actin assembly was partially dependent on Dia (Fig. 3D, S2G). This result was consistent with previous reports of actin assembly at epithelial cell junctions (Kobielak et al., 2003; Kovacs et al., 2002; Leerberg et al., 2014; Verma et al., 2012), and confirmed that the apical cortex of ventral furrow cells has a biased polarity with actin filament barbed ends enriched at junctions.
We next examined what happens to apical cortex organization upon treatment with Cytochalasin D (CytoD), which disrupts apical constriction and the attachment of the actin network to the junctions (Mason et al., 2013). Normally, myosin is enriched in the apical center with Cap-α enriched at the junctions. Injecting embryos with CytoD, but not DMSO, caused Cap-α to abnormally colocalize with myosin structures (Fig. 3E,F, S2H).
Quantifying colocalization with the Manders Overlap Coefficient, we found that there is low
A
uthor Man
uscr
ipt
A
uthor Man
uscr
ipt
A
uthor Man
uscr
ipt
A
uthor Man
uscr
ipt
colocalization between myosin and Cap-α in DMSO control injections, indicating Cap-α and myosin localize to distinct structures. In contrast, after CytoD injection, the overlap coefficient was high, indicating that myosin and Cap-α colocalize strongly (Fig. 3F). The change in myosin/Cap-α colocalization indicated that CytoD inverts the cellular actin organization, which is also associated with a lack of force on cell junctions and a failure to apically constrict (Martin et al., 2009; Mason et al., 2013).
ROCK activity continuously sustains apical myosin and constricted cell shape
Given the central position of myosin and the cell-scale polarity of the apical actin cortex, we hypothesized that medioapical ROCK stabilizes myosin in the medioapical domain. In this position, myosin could sustain tension on polarized actin networks emanating from opposite sides of the cell and thus, stabilize cell shape. The requirement of ROCK to sustain a contraction is difficult to test, because rock mutants fail to initiate constriction (Dawes-Hoang et al., 2005). We therefore needed a method to precisely and temporally control ROCK activity, allowing us to inhibit ROCK after the onset of myosin contraction. We accomplished this by developing a technique to image an embryo under confocal microscopy while simultaneously injecting it with a drug or vehicle (Fig. S3A). We first determined that embryos can tolerate being pierced by a needle. Despite leaking some yolk around the embedded needle, embryos proceeded through early gastrulation (Movie S3). When we injected drugs during imaging, we inserted the needle immediately before injection, limiting the damage to the embryo. Myosin accumulation and apical area reduction proceeded normally in pierced, uninjected embryos (Fig. S3B,C).
We used this technique to determine how apical myosin levels and apical area respond to acute inhibition of ROCK with the ROCK inhibitor Y-27632. Injecting embryos with water during ventral furrow formation did not impede either myosin accumulation or apical constriction (Fig. 4A-C). In contrast, within 15 seconds of Y-27632 injection, apical myosin fluorescence faded dramatically, and the apical area relaxed (Fig. 4D-F; Movie S4). The rapid decrease in myosin intensity probably reflects the activity of myosin phosphatase, which opposes the myosin regulatory light chain phosphorylating activity of ROCK (Ito et al., 2004; Piekny and Mains, 2002; Totsukawa et al., 2004; Vasquez et al., 2014). ROCK phosphorylates many substrates, so to determine whether the ROCK inhibitor effect occurred through ROCK phosphorylation of myosin, we asked whether a mutant myosin regulatory light chain (RLCAE) designed to mimic constitutive phosphorylation by ROCK would suppress the ROCK inhibitor effects (Vasquez et al., 2014; Winter et al., 2001). RLCAE partially suppressed both the loss of myosin fluorescence and apical relaxation (Fig. 4G-I), showing that at least part of the ROCK inhibitor effect operates through myosin regulatory light chain phosphorylation. The incomplete suppression might result from improper myosin localization in this mutant (Vasquez et al., 2014), the mutant lacking normal motor activity (Kamisoyama et al., 1994), or a complementary role for ROCK phosphorylation of other substrates. These data show that in ventral furrow cells, ROCK activity is continuously required to maintain apical myosin during apical constriction and that cell shape change (i.e. apical constriction) is reversible by acute ROCK inhibition even after the initial actomyosin network contraction. This result is consistent with the model that polarized ROCK sustains tension across the apical surface by contributing to myosin
A
uthor Man
uscr
ipt
A
uthor Man
uscr
ipt
A
uthor Man
uscr
ipt
A
uthor Man
uscr
ipt
localization in the center of the apex where it can bind and pull on polarized actin networks emanating from opposite sides of the cell.
ROCK localization requires continuous ROCK activity and Dia
Because ROCK polarity is a central feature of establishing this efficient contractile
organization, we next investigated what is responsible for positioning ROCK in the center of the apical cortex. While we speculate that RhoA is important for this process, it is not clear how active RhoA would localize to the middle of the cell apex. Importantly, we found that within a minute of ROCK inhibition, the radial organization of ROCK was disrupted; rather than being polarized, ROCK became distributed into many small puncta spread across the entire apical surface, of which some emerged from the original cluster, and others appeared after inhibition (Fig. 5A-D; Movie S5). On the same time scale, ROCK inhibition caused F-actin networks to redistribute to the apical periphery, and decrease in intensity (Fig. 5E-J). ROCK inhibition also affected E-cadherin localization, causing it to spread across the apical surface but remain apical (Fig. S4A-F). ROCK inhibition did not affect the apical-basal localization of Par3, showing that ROCK regulates the apical cortex, but probably not through Par3 or apical-basal polarity (Fig. S4G). ROCK activity therefore continuously stabilizes the medioapical ROCK polarity, the medioapical F-actin cytoskeleton, and junctional E-cadherin.
Because ROCK affects the actin cytoskeleton (Fig. 5H) and because the apical actin cortex exhibits a polarity, we tested whether actin was important for ROCK localization.
Depolymerizing F-actin with injected Latrunculin B, a G-actin sequestering toxin, caused ROCK foci to disintegrate or migrate to cell junctions (Fig. 6A,B). This effect was associated with the loss of the F-actin cytoskeleton, suggesting that ROCK might be physically linked to F-actin (Fig. 6A,B; lower panels). In addition, dia, which is required for actin cortex polarity (Fig. 3D) and ventral furrow formation (Homem and Peifer, 2008), was also required for ROCK medioapical focus formation. Hypomorphic dia5 mutants failed to polarize ROCK in the apical domain (Fig. 6C), despite ROCK being expressed at a similar level as in wild-type controls (Fig. S5A). These experiments show that ROCK localization depends on its own activity and the actin cytoskeleton, especially dia, and most probably RhoA as well.
Discussion
Here, we demonstrated that the apical actomyosin cortex of constricting ventral furrow cells is polarized, with barbed ends enriched at the periphery and pointed ends enriched in the apical center. We demonstrated this actin polarity in two independent ways: (1) Two barbed end binding proteins are enriched at the junctions, whereas the pointed end binding protein tropomodulin is enriched in the apical center; (2) Incorporation of actin onto actin filament barbed ends is biased to junctions. Interestingly, we also found that a ROCK mutant that localizes apically but is dispersed diffusely across the apex does not effectively constrict cells. This suggests that enrichment of myosin near the center of the apical domain is important for constriction. Finally, the maintenance of apical myosin and cell shape depends on the continuous activity of ROCK, suggesting a model in which myosin in the center of
A
uthor Man
uscr
ipt
A
uthor Man
uscr
ipt
A
uthor Man
uscr
ipt
A
uthor Man
uscr
ipt
the cell apex bridges antiparallel actin networks emanating from opposite sides of the cell to sustain and transmit force across the cell apex (Fig. 7A).
Similarities and Differences with Muscle Sarcomeres
The cortex of ventral furrow cells resembles a sarcomere in two ways: (1) actin filaments are arranged with barbed ends at the edge of the contractile unit and pointed ends in the center, and (2) myosin is localized to the center of the contractile unit where it can bridge and contract actin filaments (Fig. 7A). These results were surprising given the prevailing view that some nonmuscle cells contract through global activation of myosin across a mixed-polarity actin cytoskeleton (Murrell et al., 2015). On the spectrum of actin network order ranging from isotropic/mixed-polarity to muscle sarcomere order, the contractile actomyosin structure in ventral furrow cells is more like a muscle sarcomere than previously appreciated. One reason apically constricting epithelial cells might use sarcomere-like actomyosin to contract is that the contractile network must attach to and sustain tension on intercellular junctions to prevent relaxation of cell shape changes, just as muscle myosin pulls on actin filaments attached to sarcomere boundaries to contract the sarcomere. As in a muscle sarcomere, centrally activated myosin in epithelial cells is positioned, with its barbed end-directed motor activity, to pull on both sides of the cell, and to bridge contractile forces across the apical domain; indeed, when mechanical coupling to one side fails, the central myosin travels away from the center, which suggests that myosin indeed bridges actin networks from opposite sides of a cell (Jodoin et al., 2015). In vitro models of actomyosin contractility lack the boundary condition of a sarcomere Z-band or epithelial cell junction, limiting comparisons of in vitro and in vivo network organization. However, in vitro actomyosin networks contract in a manner that leads to barbed end accumulation at the center of contracted actomyosin foci (Köster et al., 2016). We were able to obtain this inverted, barbed ends-in, orientation of in vitro actomyosin gels by slowing actin
polymerization and decoupling the actomyosin network from the junctions with cytochalasin D. In this case the actomyosin network contracts, but without pulling on the cell junctions, and apical constriction does not happen (Mason et al., 2013). This suggests that the proper orientation of actin filaments is necessary for the transmission of force from the contracting network to the peripheral junctions, and that without this coupling and proper actin filament orientation, contraction of the network proceeds like an in vitro actomyosin network, and without pulling on the apical junctions to contract the apical area.
In addition to differences in the degree of actin filament order, we note several contrasts between muscle sarcomeres and the organization of the apical actin cortex of ventral furrow cells. First, muscle sarcomeres are thought to be stable structures, although there is some evidence that thin filament turnover affects sarcomere length (Bai et al., 2007; Littlefield et al., 2001). In contrast, the actomyosin structure in ventral furrow epithelial cells is highly dynamic, appearing and disappearing over the course of minutes, with myosin, ROCK, and actin pulsing (Martin et al., 2009; Mason et al., 2013; Vasquez et al., 2014) and remodeling (Jodoin et al., 2015). Perhaps related to this dynamic behavior, actin cytoskeletal polarity and medioapical myosin localization are less pronounced in the apical cortex of ventral furrow cells, with cytoskeletal polarity markers showing an enrichment, rather than total exclusion from complementary domains, and with myosin structures sometimes projecting
A
uthor Man
uscr
ipt
A
uthor Man
uscr
ipt
A
uthor Man
uscr
ipt
A
uthor Man
uscr
ipt
to the cell periphery. We speculate that the requirement for medioapical ROCK may reflect a need for rapid assembly of a contractile structure, and to maintain contractile forces during a transient and dynamic contractile process. It may also reflect the ability of ventral furrow epithelial cells to contract ~90% of their apical area (Martin et al., 2009), compared to sarcomeres which contract only ~30% of their length (Huxley and Niedergerke, 1954). In slower nonmuscle contractile processes, order may be capable of emerging spontaneously through self-organization. We note, however, that ROCK localization has not been
determined in smooth muscle where ROCK is known to play a role in calcium sensitization and force maintenance (Lan et al., 2015; Uehata et al., 1997). Our data suggests that ROCK localization could support its function in other contexts.
A second distinction between ventral furrow cells and muscle cells is that muscle myofibrils are comprised of one-dimensional arrays of sarcomere contractile units (Fig. 7B), whereas actomyosin in the ventral furrow is organized in a two-dimensional array. One could therefore think of the ventral furrow as a collection of “radial sarcomeres” linked together in a 2-dimensional grid to contract the epithelial sheet (Fig.7C). We speculate that the
sarcomere-like organization in a two-dimensional contractile tissue is required to allow tension to reduce the apical area of cells and fold the sheet, possibly by reducing compressional and bending stiffness of the apical domain. Interestingly, ROCKwt and ROCKΔ547-923 produce comparable levels of epithelial tension as inferred by tissue recoil following laser cutting, but ROCKΔ547-923 does not invaginate, which could reflect increased stiffness in the epithelium. In addition, the ROCKΔ547-923 mutant flattens the tissue,
suggesting that diffuse apical myosin is able to generate tension that flattens the tissue, but is unable to efficiently contract and fold the tissue. This interpretation agrees with models of ventral furrow formation in which contraction of the apical area propagates changes to the rest of the cell, leading to the acquisition of a wedge-shaped cells and tissue folding (He et al., 2014; Polyakov et al., 2014).
ROCK pattern formation
An important outstanding question is how ROCK becomes polarized in the middle of the apical surface, which is a basis for the formation of this polygonal grid of contractile units. Here, we provide evidence that the coiled-coil domain of ROCK, ROCK kinase activity, the actin cytoskeleton, and Dia are all required for ROCK focus formation. Because Dia is required for robust apical actin network polarity, it is possible that the polarity of the actin network is important to localize ROCK to the apical center. ROCK could be important to localize itself through myosin-induced flows, as suggested in earlier work (Munjal et al., 2015). Future work is needed to establish the link between actin and ROCK polarization and the importance of the coiled-coil domain. Interestingly, ROCK has been shown to interact with stress fibers in other systems (Chen et al., 2002; Katoh et al., 2001; Newell-Litwa et al., 2015), which resemble the fibrous actomyosin cytoskeleton in ventral furrow cells and may represent a conserved role for ROCK localization to polarized actin structures.
A
uthor Man
uscr
ipt
A
uthor Man
uscr
ipt
A
uthor Man
uscr
ipt
A
uthor Man
uscr
ipt
Experimental Procedures
Image Processing and Quantitative Analyses
All images were processed using Fiji (http://fiji.sc/wiki/index.php/Fiji) and MATLAB (The MathWorks). Displayed images were processed with a Gaussian filter (σ = 0.7). All still and movie frames are Z-projections through 2–5 μm of apical depth. For myosin, projections are maximum intensity, and for all other fluorescent proteins, projections are summed intensity. To display differences in ROCK distribution, image display parameters were sometimes (Fig. 1B,C,D; 2A,C,E; Movies S1, S2, S5) optimized for each image to effectively display the distribution of ROCK fluorescence intensity across the apical area. Membrane images are single sections at the bottom of the apical projection. For analyzing myosin intensity, images were background subtracted by determining the mean pixel intensity in a region >5 μm below the apical surface, and subtracting that value from all pixels in the maximum intensity projection. In Figures, asterisks indicate significance threshold α, i.e. * = significant at α = 0.01, ** = significant at α = 0.001, etc.
Expressions for junctional and medioapical intensity were also used for quantifying medioapical polarity, ρ, of actin polarity markers and fluorescent actin incorporation (Fig. 3B,D; S2C). In this case, the peripheral domain was defined as the 0.4 μm outermost shell of the cell apex to reflect junctional rather than peripheral localization. We calculated ρ as the difference between mean medioapical intensity and mean junctional intensity, normalized by the mean total intensity (Vasquez et al., 2014):
In Fig. 3B and Fig. 3D, the medioapical polarity was calculated as above with normalization by mean pixel intensity in the cell in order to ignore differences in the measurement due to overall intensity of the probe. This was important because fluorescence from different reagents and different embryos was being compared, and different reagents and embryos had different mean fluorescent intensity profiles.
Radial intensity profiles (Fig. 2D; S1G; S2F) were calculated by representing a cell apical area in polar coordinates, where the origin of the coordinate plot is the cell geometric centroid, and each pixel occupies a coordinate position defined by its radial distance from the origin, r, and its angular position,Θ. We generated the radial intensity profile by determining the mean pixel intensity as a function r, where Θr is the number of pixels at
radius r:
To analyze embryos injected with fluorescently labeled actin (Fig. 3D), we generated an image mask to select the surface of the embryo for further analysis. In x-z cross-sections of the image volume, we applied a Sobel edge detection algorithm to the summed signal of all
A
uthor Man
uscr
ipt
A
uthor Man
uscr
ipt
A
uthor Man
uscr
ipt
A
uthor Man
uscr
ipt
fluorescent channels to find the surface of the embryo. We dilated this edge ~2 μm into the surface of the tissue. Next, viewing the masked pixels in the x-y plane, we closed the image to eliminate holes in the mask. We projected the brightest 2 pixels in each z dimension from the mask for each channel of the underlying image, and projected the sum of these pixels onto an x-y plane. This approach allowed us to identify the apical 2 μm of tissue across the imaged embryo, regardless of position in z. Code for surface masking is available here:
https://github.com/jcoravos/surface_embryo. For additional information on quantitative image analayses, see Supplemental Experimental Procedures.
Imaging
All imaging was performed with a Zeiss LSM 710 confocal microscope. A 40x/1.2
Apochromat water objective was used for live imaging, and a 63x/1.4 Apochromat was used for fixed imaging (Carl Zeiss). An argon ion, 561nm diode, 594nm HeNe, and 633nm HeNe lasers were used for fluorophore excitation. Pinhole settings ranged from 1-2 airy units. We used the following approximate band pass filters, adjusting to minimize channel bleed through: For Venus: 519-578 nm, for GFP and AF-488: 488-558 nm, for Cherry and AF-568: 580-696 nm, and for AF-647 675-700 nm.
Embryo Injection
Embryos were injected with dsRNA in water, or profilin:actin-488 (10 μM each) in G-Buffer (2mM Tris pH 8, 0.2 mM ATP, 0.5 mM DTT, 0.1 mM CaCl2, 1 mM NaN3), or Y-27632 (50
mM) in water, Latrunculin B (5 mg/mL) in DMSO, or Cytochalasin D (0.25 mg/mL) in DMSO (Enzo Life Sciences, Farmingdale, NY). For all injections, embryos were first dechorionated in 50% bleach and washed with water, and mounted with embryo glue, and desiccated for 5 minutes with Drierite (Drierite Company). Before injection, halocarbon 700 and 27 oil (3:1 ratio) was layered over embryos.
To inject profilin:actin and label actin filament barbed ends (Fig. 3C,D; S2D-G), we purified Drosophila profilin (chickadee) (see Supplemental Experimental Procedures), and verified its activity by determining its effect on actin filament assembly in a pyrene-actin assembly assay. We centrifuged fluorophore-labeled actin to pellet and discard actin filaments, and mixed active profilin with fluorophore-labeled actin monomers to a final concentration of 10 μM each in G buffer (5 mM Tris-HCl pH8, 0.2 mM ATP, 0.5 mM DTT, 0.2 mM CaCl2, and
1 mM NaN3). We let the mixture stand for 10 minutes at 4°C, and proceeded to inject
profilin actin as described below. Embryos injected with profilin:actin-488 were incubated for <1 minute to allow incorporation, but to prevent saturation of the apical actin meshwork with fluorescent actin, and then removed from the embryo glue in a petri dish with heptane and fixed in PFA.
For simultaneous imaging and injection of Y-27632 or Latrunculin B, embryos were mounted on a No. 1 coverslip ventral side down over a window scraped in the embryo glue with a razor blade. The window in the embryo glue allows the embryo to be image with an inverted objective, while still holding the embryo in place as it is pierced with the needle and injected during imaging.
A
uthor Man
uscr
ipt
A
uthor Man
uscr
ipt
A
uthor Man
uscr
ipt
A
uthor Man
uscr
ipt
Laser Cutting and Recoil Analysis
Laser ablations (Fig. 1G,H; S1D,E) were performed using a 2-photon Mai-Tai laser set to 800 nm on a LSM710 confocal microscope (Zeiss) through a 40x/1.2 objective. Laser power set between 25% to produce sufficient power to ablate, rather than bleach, the tissue, but not so much as to boil the embryo. Ablations were performed in a 1-pixel wide and 50-pixel long line (0.08nm × 4μm) parallel to the dorso-ventral axis of the embryo. Recoil distance was measured in FIJI by manually measuring the distance across the opening in the frame before ablation and every time point after ablation (time resolution was 320 ms per frame). In rock mutant embryos, fluorescence from Venus::ROCK was used to determine the opening in the tissue. “Pre-network myosin” and “network myosin” ablations were
performed in y w sqhAX3;P{w+ sqh::GFP}42 embryos, using fluorescence from Sqh::GFP to track recoil distance. Pre-network myosin ablations were performed at the onset of myosin accumulation, but before the appearance of an intercellular connected myosin network. Ablations performed after this network appeared were classified as network myosin ablations.
We determined initial recoil velocity by calculating the displacement of the tissue over the first 320ms time step and dividing by the elapsed time. Recoil distance was plotted by smoothing displacement curves from individual recoil experiments with a kernel of 3 time steps and a loess filter. Recoil distance fitting was performed with a non-linear regression fit to a Kelvin-Voigt model:
where ε is strain, σ0 is initial stress, E is the elastic modulus, and η is the viscous drag
coefficient. We report the fitted value of σ0/E for each curve in Supplemental Fig. 1E. Fitting
parameters are reported in Fig. S1.
Supplementary Material
Refer to Web version on PubMed Central for supplementary material.
Acknowledgments
For flies, antibodies, and plasmids used in this study, we thank J. Zallen, S. Simões, E. Wieschaus, D. St. Johnston, A. Royou, T. Lecuit, Y. Bellaïche, S. Wasserman, C. Tan, D. Kovar, the Bloomington Drosophila Resource Center, the Kyoto Drosophila Genomics and Genetics Resource, and the Developmental Studies Hybridoma Bank. We thank members of the Martin laboratory, I. Cheeseman, V. Fowler, C. Pender, C. Vasquez, D. Cattie, and S. McGeary for helpful comments and discussion on this work. We also thank Y. Li for help conducting experiments using purified profilin. The generation of P{rock-GFP::ROCK} (BAC) by V. Hatini was supported by NIH GM068069. This research was supported by Grant-in-aid 14GRNT18880059 from the American Heart Association and grant 125792-RSG-14-039-01-CSM from the Americal Cancer Socity to A.C.M. This work was supported in part by the NIH PreDoctoral Training Grant T32GM007287.
References
Amano M, Ito M, Kimura K, Fukata Y, Chihara K, Nakano T, Matsuura Y, Kaibuchi K.
Phosphorylation and Activation of Myosin by Rho-associated Kinase (Rho-kinase). Journal of Biological Chemistry. 1996; 271:20246–20249. [PubMed: 8702756]
A
uthor Man
uscr
ipt
A
uthor Man
uscr
ipt
A
uthor Man
uscr
ipt
A
uthor Man
uscr
ipt
Amândio AR, Gaspar P, Whited JL, Janody F. Subunits of the Drosophila Actin-Capping Protein Heterodimer Regulate Each Other at Multiple Levels. PLoS ONE. 2014; 9:e96326. [PubMed: 24788460]
Backouche F, Haviv L, Groswasser D, Bernheim-Groswasser A. Active gels: dynamics of patterning and self-organization. Phys Biol. 2006; 3:264–273. [PubMed: 17200602]
Bai J, Hartwig JH, Perrimon N. SALS, a WH2-domain-containing protein, promotes sarcomeric actin filament elongation from pointed ends during Drosophila muscle growth. Developmental Cell. 2007; 13:828–842. [PubMed: 18061565]
Barrett K, Leptin M, Settleman J. The Rho GTPase and a Putative RhoGEF Mediate a Signaling Pathway for the Cell Shape Changes in Drosophila Gastrulation. Cell. 1997; 91:905–915. [PubMed: 9428514]
Charras GT, Hu C-K, Coughlin M, Mitchison TJ. Reassembly of contractile actin cortex in cell blebs. The Journal of Cell Biology. 2006; 175:477–490. [PubMed: 17088428]
Chen X-Q, Tan I, Ng CH, Hall C, Lim L, Leung T. Characterization of RhoA-binding kinase ROKalpha implication of the pleckstrin homology domain in ROKalpha function using region-specific antibodies. J. Biol. Chem. 2002; 277:12680–12688. [PubMed: 11815607]
Clay MR, Halloran MC. Rho activation is apically restricted by Arhgap1 in neural crest cells and drives epithelial-to-mesenchymal transition. Development. 2013; 140:3198–3209. [PubMed: 23804498]
Costes SV, Daelemans D, Cho EH, Dobbin Z, Pavlakis G, Lockett S. Automatic and quantitative measurement of protein-protein colocalization in live cells. Biophys. J. 2004; 86:3993–4003. [PubMed: 15189895]
Dawes-Hoang RE, Parmar KM, Christiansen AE, Phelps CB, Brand AH, Wieschaus EF. folded gastrulation, cell shape change and the control of myosin localization. Development. 2005; 132:4165–4178. [PubMed: 16123312]
Flanagan LA, Chou J, Falet H, Neujahr R, Hartwig JH, Stossel TP. Filamin A, the Arp2/3 complex, and the morphology and function of cortical actin filaments in human melanoma cells. The Journal of Cell Biology. 2001; 155:511–517. [PubMed: 11706047]
Fowler VM, Sussmann MA, Miller PG, Flucher BE, Daniels MP. Tropomodulin is associated with the free (pointed) ends of the thin filaments in rat skeletal muscle. The Journal of Cell Biology. 1993; 120:411–420. [PubMed: 8421055]
Goode BL, Eck MJ. Mechanism and function of formins in the control of actin assembly. Annu. Rev. Biochem. 2007; 76:593–627. [PubMed: 17373907]
He B, Doubrovinski K, Polyakov O, Wieschaus E. Apical constriction drives tissue-scale
hydrodynamic flow to mediate cell elongation. Nature. 2014; 508:392–396. [PubMed: 24590071] Hildebrand JD, Soriano P. Shroom, a PDZ domain-containing actin-binding protein, is required for
neural tube morphogenesis in mice. Cell. 1999; 99:485–497. [PubMed: 10589677] Homem CCF, Peifer M. Diaphanous regulates myosin and adherens junctions to control cell
contractility and protrusive behavior during morphogenesis. Development. 2008; 135:1005–1018. [PubMed: 18256194]
Huxley AF, Niedergerke R. Structural changes in muscle during contraction; interference microscopy of living muscle fibres. Nature. 1954; 173:971–973. [PubMed: 13165697]
Huxley H, Hanson J. Changes in the Cross-Striations of Muscle during Contraction and Stretch and their Structural Interpretation. Nature. 1954; 173:973–976. [PubMed: 13165698]
Isenberg G, Aebi U, Pollard TD. An actin-binding protein from Acanthamoeba regulates actin filament polymerization and interactions. Nature. 1980; 288:455–459. [PubMed: 6893736]
Ito M, Nakano T, Erdödi F, Hartshorne DJ. Myosin phosphatase: Structure, regulation and function. Mol Cell Biochem. 2004; 259:197–209. [PubMed: 15124925]
Jodoin JN, Coravos JS, Chanet S, Vasquez CG, Tworoger M, Kingston ER, Perkins LA, Perrimon N, Martin AC. Stable Force Balance between Epithelial Cells Arises from F-Actin Turnover. Developmental Cell. 2015; 35:685–697. [PubMed: 26688336]
Kamisoyama H, Araki Y, Ikebe M. Mutagenesis of the phosphorylation site (serine 19) of smooth muscle myosin regulatory light chain and its effects on the properties of myosin. Biochemistry. 1994; 33:840–847. [PubMed: 8292613]
A
uthor Man
uscr
ipt
A
uthor Man
uscr
ipt
A
uthor Man
uscr
ipt
A
uthor Man
uscr
ipt
Katoh K, Kano Y, Amano M, Onishi H, Kaibuchi K, Fujiwara K. Rho-kinase--mediated contraction of isolated stress fibers. The Journal of Cell Biology. 2001; 153:569–584. [PubMed: 11331307] Kobielak A, Pasolli HA, Fuchs E. Mammalian formin-1 participates in adherens junctions and
polymerization of linear actin cables. Nat. Cell Biol. 2003; 6:21–30. [PubMed: 14647292] Kovacs EM, Goodwin M, Ali RG, Paterson AD, Yap AS. Cadherin-directed actin assembly: E-cadherin physically associates with the Arp2/3 complex to direct actin assembly in nascent adhesive contacts. Current Biology. 2002; 12:379–382. [PubMed: 11882288]
Köster DV, Husain K, Iljazi E, Bhat A, Bieling P, Mullins RD, Rao M, Mayor S. Actomyosin dynamics drive local membrane component organization in an in vitro active composite layer. Proc. Natl. Acad. Sci. U.S.a. 2016; 113:E1645–E1654. [PubMed: 26929326]
Kuhlman PA, Hughes CA, Bennett V, Fowler VM. A new function for adducin. Calcium/calmodulin-regulated capping of the barbed ends of actin filaments. J. Biol. Chem. 1996; 271:7986–7991. [PubMed: 8626479]
Lan B, Deng L, Donovan GM, Chin LYM, Syyong HT, Wang L, Zhang J, Pascoe CD, Norris BA, Liu JC-Y, et al. Force maintenance and myosin filament assembly regulated by Rho-kinase in airway smooth muscle. Am. J. Physiol. Lung Cell Mol. Physiol. 2015; 308:L1–L10. [PubMed: 25305246] Lee J-Y, Harland RM. Actomyosin contractility and microtubules drive apical constriction in Xenopus
bottle cells. Developmental Biology. 2007; 311:40–52. [PubMed: 17868669]
Leerberg JM, Gomez GA, Verma S, Moussa EJ, Wu SK, Priya R, Hoffman BD, Grashoff C, Schwartz MA, Yap AS. Tension-sensitive actin assembly supports contractility at the epithelial zonula adherens. Curr. Biol. 2014; 24:1689–1699. [PubMed: 25065757]
Littlefield R, Almenar-Queralt A, Fowler VM, Fowler VM. Actin dynamics at pointed ends regulates thin filament length in striated muscle. Nat. Cell Biol. 2001; 3:544–551. [PubMed: 11389438] Manders E, Verbeek FJ, Aten JA. Measurement of co-localization of objects in dual-colour confocal
images. Journal of Microscopy. 1993; 169:375–382.
Martin AC, Gelbart M, Fernandez-Gonzalez R, Kaschube M, Wieschaus EF. Integration of contractile forces during tissue invagination. The Journal of Cell Biology. 2010; 188:735–749. [PubMed: 20194639]
Martin AC, Kaschube M, Wieschaus EF. Pulsed contractions of an actin myosin network drive apical constriction. Nature. 2009; 457:495–499. [PubMed: 19029882]
Mason FM, Tworoger M, Martin AC. Apical domain polarization localizes actin myosin activity to drive ratchet-like apical constriction. Nat. Cell Biol. 2013; 15:926–936. [PubMed: 23831726] Mizuno T, Amano M, Kaibuchi K, Nishida Y. Identification and characterization of Drosophila
homolog of Rho-kinase. Gene. 1999; 238:437–444. [PubMed: 10570971]
Mohan S, Rizaldy R, Das D, Bauer RJ, Heroux A, Trakselis MA, Hildebrand JD, Vandemark AP. Structure of Shroom domain 2 reveals a three-segmented coiled-coil required for dimerization, Rock binding, and apical constriction. Mol. Biol. Cell. 2012; 23:2131–2142. [PubMed: 22493320] Munjal A, Munjal A, Philippe J-M, Munro E, Lecuit T. A self-organized biomechanical network drives
shape changes during tissue morphogenesis. Nature. 2015; 524:351–355. [PubMed: 26214737] Murrell MP, Gardel ML. F-actin buckling coordinates contractility and severing in a biomimetic
actomyosin cortex. Proc. Natl. Acad. Sci. U.S.a. 2012; 109:20820–20825. [PubMed: 23213249] Murrell M, Murrell M, Oakes PW, Lenz M, Gardel ML. Forcing cells into shape: the mechanics of
actomyosin contractility. Nat. Rev. Mol. Cell Biol. 2015; 16:486–498. [PubMed: 26130009] Newell-Litwa KA, Newell-Litwa KA, Badoual M, Badoual M, Asmussen H, Asmussen H, Patel H,
Patel H, Whitmore L, Whitmore L, et al. ROCK1 and 2 differentially regulate actomyosin organization to drive cell and synaptic polarity. The Journal of Cell Biology. 2015; 210:225–242. [PubMed: 26169356]
Nishimura T, Takeichi M. Shroom3-mediated recruitment of Rho kinases to the apical cell junctions regulates epithelial and neuroepithelial planar remodeling. Development. 2008; 135:1493–1502. [PubMed: 18339671]
Piekny AJ, Mains PE. Rho-binding kinase (LET-502) and myosin phosphatase (MEL-11) regulate cytokinesis in the early Caenorhabditis elegans embryo. J. Cell. Sci. 2002; 115:2271–2282. [PubMed: 12006612]
A
uthor Man
uscr
ipt
A
uthor Man
uscr
ipt
A
uthor Man
uscr
ipt
A
uthor Man
uscr
ipt
Pollard TD, Cooper JA. Quantitative analysis of the effect of Acanthamoeba profilin on actin filament nucleation and elongation. Biochemistry. 1984; 23:6631–6641. [PubMed: 6543322]
Polyakov O, He B, Swan M, Shaevitz JW, Kaschube M, Wieschaus E. Passive mechanical forces control cell-shape change during Drosophila ventral furrow formation. Biophys. J. 2014; 107:998– 1010. [PubMed: 25140436]
Priya R, Gomez GA, Budnar S, Verma S, Cox HL, Hamilton NA, Yap AS. Feedback regulation through myosin II confers robustness on RhoA signalling at E-cadherin junctions. Nat. Cell Biol. 2015; 17:1282–1293. [PubMed: 26368311]
Rauzi M, Krzic U, Saunders TE, Krajnc M, Ziherl P, Hufnagel L, Leptin M. Embryo-scale tissue mechanics during Drosophila gastrulation movements. Nature Communications. 2015; 6:8677. Reymann A-C, Boujemaa-Paterski R, Martiel J-L, Guérin C, Cao W, Chin HF, La Cruz, De EM, Théry
M, Blanchoin L. Actin Network Architecture Can Determine Myosin Motor Activity. Science. 2012; 336:1310–1314. [PubMed: 22679097]
Ridley AJ, Hall A. The small GTP-binding protein rho regulates the assembly of focal adhesions and actin stress fibers in response to growth factors. Cell. 1992; 70:389–399. [PubMed: 1643657] Röper K. Anisotropy of Crumbs and aPKC drives myosin cable assembly during tube formation.
Developmental Cell. 2012; 23:939–953. [PubMed: 23153493]
Schutt CE, Myslik JC, Rozycki MD, Goonesekere NC, Lindberg U. The structure of crystalline profilin-beta-actin. Nature. 1993; 365:810–816. [PubMed: 8413665]
Sellers JR. Regulation of cytoplasmic and smooth muscle myosin. Curr. Opin. Cell Biol. 1991; 3:98– 104. [PubMed: 1854490]
Simoes SDM, Mainieri A, Zallen JA. Rho GTPase and Shroom direct planar polarized actomyosin contractility during convergent extension. The Journal of Cell Biology. 2014; 204:575–589. [PubMed: 24535826]
Simões, S. de M.; Blankenship, JT.; Weitz, O.; Farrell, DL.; Tamada, M.; Fernandez-Gonzalez, R.; Zallen, JA. Rho-Kinase Directs Bazooka/Par-3 Planar Polarity during Drosophila Axis Elongation. Developmental Cell. 2010; 19:377–388. [PubMed: 20833361]
Stachowiak MR, McCall PM, Thoresen T, Balcioglu HE, Kasiewicz L, Gardel ML, O'Shaughnessy B. Self-organization of myosin II in reconstituted actomyosin bundles. Biophys. J. 2012; 103:1265– 1274. [PubMed: 22995499]
Symons MH, Mitchison TJ. Control of actin polymerization in live and permeabilized fibroblasts. The Journal of Cell Biology. 1991; 114:503–513. [PubMed: 1860882]
Tang VW, Brieher WM. α-Actinin-4/FSGS1 is required for Arp2/3-dependent actin assembly at the adherens junction. The Journal of Cell Biology. 2012; 196:115–130. [PubMed: 22232703] Totsukawa G, Wu Y, Sasaki Y, Hartshorne DJ, Yamakita Y, Yamashiro S, Matsumura F. Distinct roles
of MLCK and ROCK in the regulation of membrane protrusions and focal adhesion dynamics during cell migration of fibroblasts. The Journal of Cell Biology. 2004; 164:427–439. [PubMed: 14757754]
Truebestein L, Elsner DJ, Fuchs E, Leonard TA. A molecular ruler regulates cytoskeletal remodelling by the Rho kinases. Nature Communications. 2015; 6:10029.
Uehata M, Narumiya S, Ishizaki T, Satoh H, Ono T, Kawahara T, Morishita T, Tamakawa H, Yamagami K, Inui J, et al. Calcium sensitization of smooth muscle mediated by a Rho-associated protein kinase in hypertension. Nature. 1997; 389:990–994. [PubMed: 9353125]
Vasquez CG, Tworoger M, Martin AC. Dynamic myosin phosphorylation regulates contractile pulses and tissue integrity during epithelial morphogenesis. The Journal of Cell Biology. 2014; 206:435– 450. [PubMed: 25092658]
Verma S, Han SP, Michael M, Gomez GA, Yang Z, Teasdale RD, Ratheesh A, Kovacs EM, Ali RG, Yap AS. A WAVE2-Arp2/3 actin nucleator apparatus supports junctional tension at the epithelial zonula adherens. Mol. Biol. Cell. 2012; 23:4601–4610. [PubMed: 23051739]
Vignaud T, Blanchoin L, Théry M. Directed cytoskeleton self-organization. Trends in Cell Biology. 2012; 22:671–682. [PubMed: 23026031]
Wear MA, Yamashita A, Kim K, Maéda Y, Cooper JA. How capping protein binds the barbed end of the actin filament. Current Biology. 2003; 13:1531–1537. [PubMed: 12956956]
A
uthor Man
uscr
ipt
A
uthor Man
uscr
ipt
A
uthor Man
uscr
ipt
A
uthor Man
uscr
ipt
Weber A, Pennise CR, Babcock GG, Fowler VM. Tropomodulin caps the pointed ends of actin filaments. The Journal of Cell Biology. 1994; 127:1627–1635. [PubMed: 7798317]
Winter CG, Wang B, Ballew A, Royou A, Karess R, Axelrod JD, Luo L. Drosophila Rho-associated kinase (Drok) links Frizzled-mediated planar cell polarity signaling to the actin cytoskeleton. Cell. 2001; 105:81–91. [PubMed: 11301004]
Wójciak-Stothard B, Potempa S, Eichholtz T, Ridley AJ. Rho and Rac but not Cdc42 regulate endothelial cell permeability. J. Cell. Sci. 2001; 114:1343–1355. [PubMed: 11257000] Xie S, Martin AC. Intracellular signalling and intercellular coupling coordinate heterogeneous
contractile events to facilitate tissue folding. Nature Communications. 2015; 6:7161. Xu K, Zhong G, Zhuang X. Actin, spectrin, and associated proteins form a periodic cytoskeletal
structure in axons. Science. 2013; 339:452–456. [PubMed: 23239625]
A
uthor Man
uscr
ipt
A
uthor Man
uscr
ipt
A
uthor Man
uscr
ipt
A
uthor Man
uscr
ipt
Highlights
• Central ROCK in apical actomyosin cortices drives epithelial apical constriction
• Constricting apical actin cortices are polarized with junctional plus ends
• ROCK continuously maintains apical myosin and sustains contraction
• Tissue folding occurs through apical constriction using sarcomere-like actomyosin
A
uthor Man
uscr
ipt
A
uthor Man
uscr
ipt
A
uthor Man
uscr
ipt
A
uthor Man
uscr
ipt
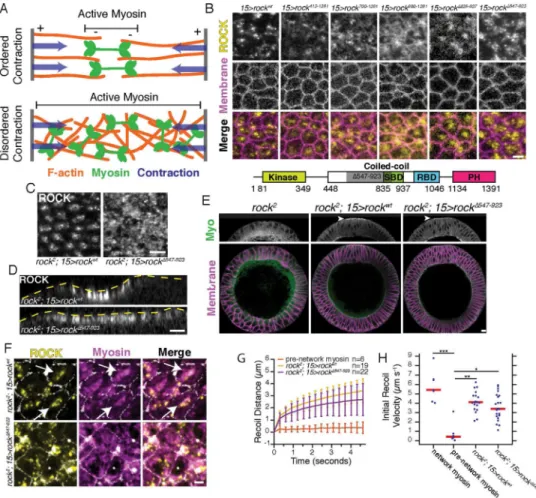
Figure 1. Diffuse apical ROCK is insufficient for tissue folding
(A) Models for actomyosin contraction. (B) Apical surfaces of ventral furrow cells in embryos expressing the indicated Venus-tagged rock transgenes in the presence of endogenous wild-type ROCK. SBD = Shroom-binding domain, RBD = RhoA binding domain, PH = pleckstrin homology. Shaded region indicates deleted region in
ROCKΔ547-923. (C) Apical surfaces of ventral furrow cells with ROCKwt or ROCKΔ547-923 expressed in rock2 null mutant background. (D) Cross-section views of the ventral side of
embryos. Yellow dashed lined represents the embryo surface. Embryos were aligned in time by the onset of ROCK accumulation. The ventral domain appears smaller in rockwt because
cells have contracted their apical area. (E) Cross-sections of fixed embryos stained for myosin heavy chain (Myo) and Neurotactin (Membrane). Genotypes are the rock2 null mutant or the rock2 mutant expressing either rockwt or rockΔ547-923. Arrowheads indicate apical myosin specific for ventral domain. (F) Apical surface views of rockwt or rockΔ547-923 expressed in rock2 null background and immunostaining of myosin heavy chain. Arrows show polarized myosin. (G) Recoil distance of fluorescent ROCK signal away from laser cut in ventral furrow epithelium after laser ablation at t = 0. In the pre-network myosin
condition, the ablation was performed in wild-type embryos expressing RLC::GFP, which was used instead of ROCK fluorescence to track recoil distance. n is cuts per condition, and bars represent ± 1 s.d. (H) Initial recoil velocity following (~ 300 ms) laser ablation in RLC::GFP embryos prior to (pre-network myosin) or after (network myosin) the
establishment of the supracellular myosin network. Initial recoil velocity was also measured
A
uthor Man
uscr
ipt
A
uthor Man
uscr
ipt
A
uthor Man
uscr
ipt
A
uthor Man
uscr
ipt
in rock2 germline clones expressing either rockwt or rockΔ547-923. From left to right, n = 7, 6, 19, 22 cuts. Red bars represent median. Comparisons were performed with the Kruskal-Wallis test. Images B-D were separately contrast adjusted to illustrate intracellular distribution of ROCK. Scale bars = 5 μm (B,C,E,F), 10 μm (D). See also Figure S1.
A
uthor Man
uscr
ipt
A
uthor Man
uscr
ipt
A
uthor Man
uscr
ipt
A
uthor Man
uscr
ipt
Figure 2. Diffuse ROCK dominantly inhibits apical constriction and tissue folding
(A) Apical surfaces of embryos expressing Venus::ROCKwt, Venus::ROCKΔ547-923, or Venus::ROCKK(116)A, Δ547-923 transgenes in wild-type rock background. (B) Quantification of apical area contraction rate in embryos expressing rock variants from (A) with the maternal Gal4 drivers, mat15 or mat67. For each condition, from left to right n = 90, 104, 122 cells and 2 embryos. Red line is median, box represents 25th-75th percentile, and whiskers represent ± 2.7 s.d.. Statistical comparisons were made with the Kruskal-Wallis test. (C) Cross-sections of live embryos with the same genotypes as (A). Dashed yellow line indicates the apical surface of the embryo. Embryos were aligned in time by onset of ROCK accumulation. (D) Quantification of normalized intensity distribution of Venus::ROCKwt, Venus::ROCKΔ547-923, and Venus::ROCKK(116)A, Δ547-923 from cell centroid to the cell junction (radial distance). Solid lines represent mean, and dashed lines represent ± 1 s.d.. Each plot represents cells quantified from one representative embryo. (E) Apical myosin localization (RLC::mCherry) in rock mutants expressed in a wild-type background. ROCK and myosin colocalize in foci for rockwt and rockK(116)A, Δ547-923 (arrowheads). In A,C,E, images were separately contrast adjusted to illustrate intracellular distribution of ROCK, but not myosin. Scale bars = 5μm (A,C,E). See also Figure S1.
A
uthor Man
uscr
ipt
A
uthor Man
uscr
ipt
A
uthor Man
uscr
ipt
A
uthor Man
uscr
ipt
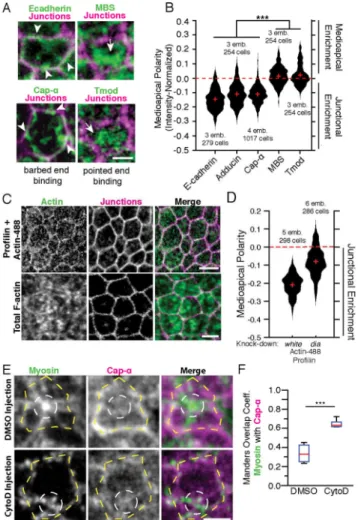
Figure 3. The apical actin cortex in ventral furrow cells is polarized with pointed ends enriched medioapically and barbed ends enriched at junctions
(A) Apical surfaces of fixed embryos stained with antibodies against indicated proteins or a tmod::GFP transgenic line. Arrowheads indicate junctional staining of E-cadherin and
Cap-α structures. Arrows indicate medioapical MBS and tmod. MBS and tmod staining were
performed in the same embryos to determine relative localization. Junctions were identified using subapical E-cadherin or F-actin. (B) Medioapical polarity or mean medioapical intensity minus mean junctional intensity (positive value means medioapical enrichment). Red crosses represent medians, and the dotted red line indicates no enrichment in either the medioapical or junctional domains. Statistical comparisons were made with Kruskal-Wallis. emb. = number of embryos analyzed, and cell = total number of cells analyzed. (C) Apical surface of embryos that were fixed minutes after injection with mixture of actin-488 and profilin. Bottom images show total F-actin (Utr::GFP) for comparison. (D) Medioapical polarity in white-RNAi (control) and dia-RNAi knock-down embryos injected with actin-488 fluorescence. Red crosses indicate median, and emb. = number of embryos analyzed, and cell = total number of cells analyzed. Statistical comparison with Wilcoxon Rank Sum, distributions differ significantly, α = 0.01. (E) RLC::GFP embryos fixed and stained for Cap-α that were injected with DMSO or CytoD (250 μg/mL in DMSO). White dashed circles highlight myosin and yellow dashed lines highlight junctions. (F) Manders overlap coefficient for myosin colocalization with Cap-α after Costes thresholding. Each
A
uthor Man
uscr
ipt
A
uthor Man
uscr
ipt
A
uthor Man
uscr
ipt
A
uthor Man
uscr
ipt
data point corresponds to the ventral domain of 1 embryo. n = 6 embryos for each condition. Red line is median, box represents 25th-75th percentile, and whiskers represent ± 2.7 s.d.. Statistical comparison with Wilcoxon Rank Sum. Scale bars = 2 μm (A,E), 5 μm (C). See also Figure S2.
A
uthor Man
uscr
ipt
A
uthor Man
uscr
ipt
A
uthor Man
uscr
ipt
A
uthor Man
uscr
ipt
Figure 4. ROCK activity continuously stabilizes apical myosin and sustains apical constriction
(A-C) Apical surfaces of cells in a live embryo expressing RLC::GFP (myosin regulatory light chain) and Gap43::mCherry (membranes). Water injection occurs at t = 0. (B) Myosin fluorescence intensity and apical area for the cell marked in (asterisk, A). Blue vertical line indicates the injection time. (C) Mean myosin intensity and apical area (n=164 cells, 3 embryos). Dark lines are means, and shaded areas are ± 1 s.d. (D-F) Same as (A-C) but with ROCK inhibitor (Y-27632, 50 mM). In (F), mean myosin intensity and apical area (n = 259 cells, 3 embryos). (G) Water injection and (H) ROCK inhibitor injection into embryos expressing myosin RLC phosphomutants. RLCTS::GFP and RLCAE::GFP were expressed in a RLC hypomorphic mutant background (sqh1 germline clones). RLCTS is the wild-type protein, and RLCAE is a possible phosphomimetic mutant. (I) Quantification of contraction rate in embryos from the indicated conditions. Red line is median, box represents 25th-75th percentile, and whiskers represent ± 2.7 s.d.. From left to right n = 2 embryos and 188 cells, 3 embryos and 217 cells, 3 embryos and 208 cells, 3 embryos and 195 cells. Statistical comparison calculated with Kruskal-Wallis. Scale bars = 2 μm (A,D,G,H). See also Figure S3.
A
uthor Man
uscr
ipt
A
uthor Man
uscr
ipt
A
uthor Man
uscr
ipt
A
uthor Man
uscr
ipt
Figure 5. ROCK continuously maintains ROCK medioapical polarity and medioapical F-actin
(A) Surface views of ventral cells in embryo expressing GFP::ROCK and Gap43::mCherry injected with water after t = 0. (B) Dark lines represent means, and shaded areas indicate ± 1 s.d. (n = 90 cells, 2 embryos).. (C,D) Same as (A,B) but with ROCK inhibitor (Y-27632, 50 mM solution) injection (n = 177 cells, 3 embryos).) (E) Surface views of ventral furrow cells expressing Utr::GFP (F-actin), and Gap43::mCherry (membranes) injected with water after the t = 0 second frame. (F) Total F-actin intensity and ratio of mean peripheral (1 μm-thick outer shell) to mean medioapical F-actin in asterisk-marked cell from (E). Blue vertical line indicates the time of injection. (G) Mean F-actin intensity and the ratio of peripheral F-actin intensity to medioapical intensity before and after injection (n = 240 cells, 3 embryos). Dark lines represent means, and shaded areas indicate ± 1 s.d. (H-J) Same as (E-G) but with ROCK inhibitor injection. ROCK inhibitor acutely disrupts medioapical F-actin (asterisk, H). In (J), n = 150 cells, 2 embryos. Scale bars = 2 μm (A,C,E,H). See also Figures S3 and S4.
A
uthor Man
uscr
ipt
A
uthor Man
uscr
ipt
A
uthor Man
uscr
ipt
A
uthor Man
uscr
ipt
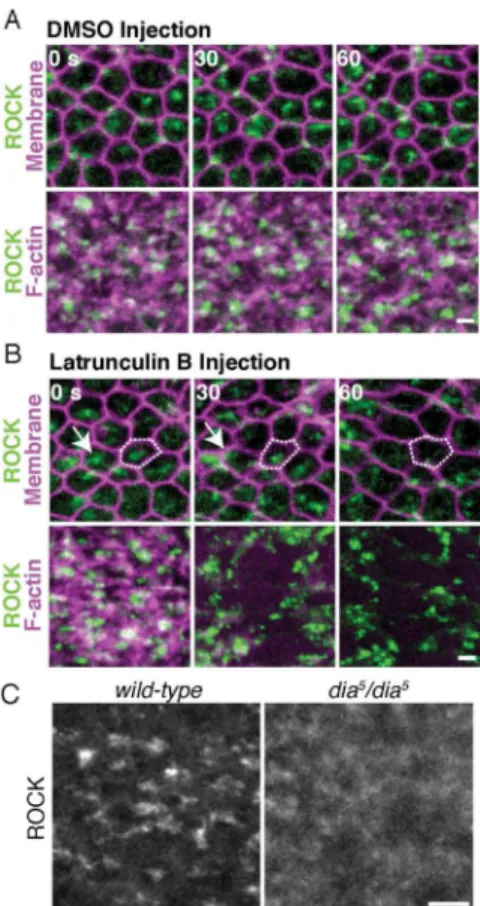
Figure 6. ROCK localization to medioapical foci requires the actin cytoskeleton and Dia
(A) Apical views of ventral furrow cells in embryos expressing ubi-GFP::ROCK, Gap43::mCherry (Membrane) or GFP::ROCK, Utr::mCherry (F-actin) and injected with DMSO after 0 sec time point. (B) Same as (A) but with Latrunculin B injection. Disrupted ROCK polarity (white outline and arrow). (C) Apical ROCK in wild-type and maternal dia5 mutant ventral cells. Scale bars = 2 μm (A,B), 5 μm (C). See also Figure S5.
A
uthor Man
uscr
ipt
A
uthor Man
uscr
ipt
A
uthor Man
uscr
ipt
A
uthor Man
uscr
ipt
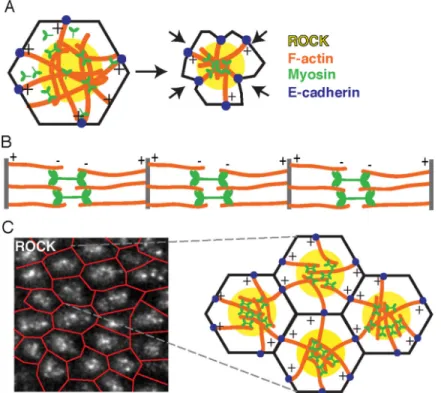
Figure 7. Model of apical constriction mechanism in ventral furrow cells
(A) Illustration of actin filament polarity and ROCK myosin localization during apical constriction. We term this organization a “radial sarcomere”. (B) Illustration of muscle fiber (or myofibril). (C) Illustration of ventral furrow tissue, where contractile units/cells are linked at the junctions (red lines, ROCK image) and operate together to contract and deform the epithelium.