architecting of in-orbit exploration infrastructure
for human exploration beyond Low Earth Orbit
The MIT Faculty has made this article openly available.
Please share
how this access benefits you. Your story matters.
Citation
Aliakbargolkar, Alessandro, and Edward F. Crawley. “A
Delphi-Based Framework for Systems Architecting of in-Orbit Exploration
Infrastructure for Human Exploration Beyond Low Earth Orbit.” Acta
Astronautica 94, no. 1 (January 2014): 17–33.
As Published
http://dx.doi.org/10.1016/j.actaastro.2013.08.004
Publisher
Elsevier B.V.
Version
Author's final manuscript
Citable link
http://hdl.handle.net/1721.1/109346
Terms of Use
Creative Commons Attribution-NonCommercial-NoDerivs License
All rights reserved.
IAC-12.D1.4.6
A DELPHI-BASED FRAMEWORK FOR SYSTEMS ARCHITECTING OF IN-ORBIT EXPLORATION INFRASTRUCTURE FOR
HUMAN EXPLORATION BEYOND LOW EARTH ORBIT
Alessandro Aliakbargolkar*
Massachusetts Institute of Technology, Aero/Astro Department, USA, [email protected]
Alexander Rudat
Massachusetts Institute of Technology, Aero/Astro Department, USA, [email protected]
Prof. Edward F. Crawley
Massachusetts Institute of Technology, Aero/Astro Department, USA, [email protected] The current debate in the U.S. Human Spaceflight Program focuses on the development of the next generation of man-rated heavy lift launch vehicles. While launch vehicle systems are of critical importance for future exploration, a comprehensive analysis of the entire exploration infrastructure is required to avoid costly pitfalls at early stages of the design process. This paper addresses this need by presenting a Delphi-Based Systems Architecting Framework for integrated architectural analysis of future in-orbit infrastructure for human space exploration beyond Low Earth Orbit. The paper is structured in two parts.
The first part consists of an expert elicitation study to identify objectives for the in-space transportation infrastructure. The study was conducted between November 2011 and January 2012 with fifteen senior experts involved with human spaceflight in the United States and Europe. The elicitation study included the formation of three expert panels representing exploration, science, and policy stakeholders to be engaged in a 3-round Delphi study. Rationale behind the Delphi approach, as translated from social science research, is discussed. A novel version of the Delphi method is presented and applied in the context of technical decision-making and systems architecting.
The second part of the paper describes a tradespace exploration study of in-orbit infrastructure coupled with requirements definition analysis informed by expert elicitation. Requirements and stakeholder goal uncertainties are explicitly considered in the analysis. The final result is an integrated view of perceived stakeholder needs within the human spaceflight community. Needs are translated into requirements and coupled to system architectures of interest for further analysis. Results include a correlation analysis between exploration, science, and policy goals. Pareto analysis is used to identify architectures of interest for further consideration by decision-makers.
The paper closes with a summary of insights and develops a strategy for evolutionary development of the exploration infrastructure of the incoming decades.
I. INTRODUCTION
While NASA has already selected the Space Launch System as the new man-rated launch vehicle (Aliakbargolkar, Wicht et al. 2011; Chang 2011), one important question that is still open is the definition of the remaining architectural elements of the transportation infrastructure.
This paper supports the architecting process of the future US human spaceflight program by implementing a Delphi-based Systems Architecting Framework (DB-SAF) (Aliakbargolkar 2012) for comprehensive architecting of the in-orbit transportation infrastructure. DB-SAF supports objective definition by identifying and characterizing ambiguities in value objectives through expert elicitation, allowing experts to negotiate with each other through an anonymous and interactive process, and view the impact of their preferences in the architectural tradespace. The analysis is structured in two parts: first, possible objectives for the infrastructure are explored through an expert elicitation approach, with the goal of identifying objectives and characterizing associated technical, scientifical, and political uncertainties. The study involved experts from NASA, ESA, academia and industry. The second part of the paper performs a tradespace exploration based on value metrics developed through expert elicitation, developing recommendations on the architecting process.
The paper demonstrates how DB-SAF can be used to characterize and mitigate ambiguity in system-level objectives, therefore being an effective decision-making support for system architects of large engineering infrastructures.
The rest of this paper is structured as follows. Section II provides motivations and historical context, framing the study as relevant to the human spaceflight program. Section III describes the objectives of the study. Section IV describes the approach used in this paper, that is the Delphi-Based Systems Architecting Framework (DB-SAF), and describes the results that have been achieved on its implementation to the in-space infrastructure architecting problem. Section V summarizes paper findings for consideration by decision-makers concerned
with the development of the future in-space infrastructure for human exploration.
II. MOTIVATIONS AND CONTEXT
This section provides the framing context that motivated the research, including relevant historic background on the US human spaceflight program. NASA is presently called to charter a path for its future plans for human exploration. In 2004, President Bush started the Constellation Program with the ambitious plan of returning astronauts to the surface of the Moon (NASA 2004). Following six years of development and a cumulative investment of $9B billion USD (Chang 2010), a Presidential panel was chartered with the goal of assessing the status of the US Human Spaceflight Program and provide recommendations to the White House for future development of the American manned spaceflight program (the “Augustine Committee”) (NASA 2009). The Committee found the US human spaceflight program to be “on an unsustainable trajectory <…> perpetuating the perilous practice of pursuing goals that do not match allocated resources”
(NASA 2009). Following this review, the Obama Administration cancelled Constellation and the programs cancelled therein, such as the Ares I and Ares V launch vehicles (Connolly 2006). Eventually, in July 2011 the Space Shuttle completed its last flight and transitioned to its decommissioning phase, marking the end of an era in human spaceflight (Chang 2011).
In September 2011, NASA announced the development of the Space Launch System (SLS) as the next generation launch vehicle for future human exploration (NASA 2011). While most efforts have been focused on the development of the launch system, less effort seems to have been spent upfront on the remaining elements of the exploration infrastructure. This is partly due to political uncertainty on overall program objectives, which make difficult to commit to any hardware development that can constrain destination selection and other program objectives in successive development phases. Stakeholders do not share a unified vision on what constitutes value for the exploration enterprise. They have variegate perspectives on
All rights reserved.
the intrisic value of space exploration. Debates generate ambiguities that must be identified, characterized, and successively mitigated through careful strategy to define a robust transportation architecture.
III. OBJECTIVES
This paper characterizes and identifies ambiguities in system objectives for the in-orbit transportation infrastructure for human space exploration. It provides a characterization of the debate on “what is value” in future human spaceflight programs as perceived by a panel of experts. Based on this analysis, the paper enumerates feasible architecture for the in-space infrastructure, and identifies architectures of interest while developing recommendations for further consideration by decision-makers. Architectures are filtered through proxy metrics for cost, schedule, and risk.
IV. APPROACH AND RESULTS
This section presents the approach that has been used for the analysis of in-orbit infrastructure presented in this paper, and the results that have been obtained by its implementation. The proposed approach is called Delphi-Based Systems Architecting Framework (DB-SAF) (Aliakbargolkar 2012). DB-SAF is an iterative approach integrating expert elicitation and computational systems architecting. DB-SAF supports the definition of system architectures under ambiguous stakeholder objectives, that is when stakeholders have a plurality of contrasting views on what
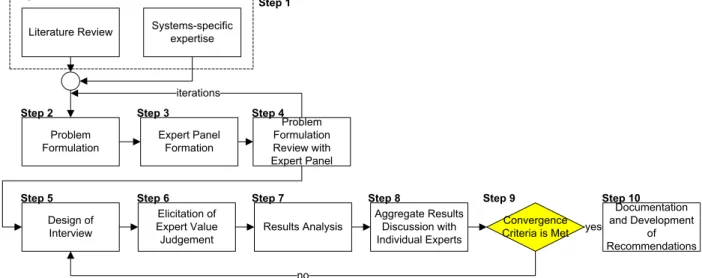
capabilities should be implemented in the system, and what constitutes value for the architecture. DB-SAF is inspired by the Delphi method from social science research (Rowe, Wright et al. 1991; Rowe and Wright 1999), and develops an engineering Delphi approach that is integrated with computational systems architecting techniques developed at MIT in recent years (Koo 2005; Simmons 2008). An overview of the DB-SAF approach is shown in Figure 1. DB-SAF allows experts to be included in the definition of a systems architecting problem, and to interact between each other in anonymous form in negotiating judgements on questions of interest – for instance, on what constitutes value for an exploration infrastructure. This approach is iterative, as experts go through several iteration rounds until convergence criteria are met. An in-depth explanation of the DB-SAF methodology can be found in (Aliakbargolkar 2012). This section of the paper shows how DB-SAF has been implemented for the in-space exploration infrastructure systems architecting problem. In the sub-sections that follow, steps make reference to the step numbering shown in Figure 1.
Step 1 – Literature Review
The first step in DB-SAF is a literature search to inform the architecting study. In particular, the goal is to find evidence on how previous system architectures were evaluated in terms of value judgments: figures of merit, evaluation metrics, and so forth. The literature in human spaceflight mission architectures is very rich, as several Literature Review Systems-specific expertise
Problem Formulation Expert Panel Formation Problem Formulation Review with Expert Panel Design of Interview Elicitation of Expert Value Judgement Results Analysis Aggregate Results Discussion with Individual Experts Convergence Criteria is Met Documentation and Development of Recommendations yes iterations no Step 1
Step 2 Step 3 Step 4
Step 5 Step 6 Step 7 Step 8 Step 9 Step 10
proposals and mission architectures were studied in the last fifty years. The main references considered in the study presented in this paper are the major design efforts in this direction starting from 2000 with particular emphasis on NASA and MIT human spaceflight studies. Among others, this study considered findings from MIT-Draper’s Concept Exploration and Refinement Exploration Systems Architecture Study (MIT and Draper 2005), NASA’s Exploration Systems Architecture Study (ESAS) (NASA 2004; NASA 2005), the Mars Design Reference Architecture 5.0 (Drake 2009), and the NASA architectures for human missions on Near Earth Asteroids (NASA 2010; Culbert 2011).
Step 2 – Problem Formulation Identification of questions of interest
This paper aims to address the following questions of relevance to the systems architecting problem of in-space transportation infrastructure for human exploration beyond Low Earth Orbit:
- What destinations should we consider pursuing for the US human exploration program of the next thirty years?
- What types of mission (orbit / surface / short stay / long stay) should we consider as effective compromise between exploration value, science and policy return?
- What are the main tradeoffs in exploration value, science return and policy return in architecting the in-space transportation infrastructure for human exploration? How do these metrics affect the architecting process as evaluated by performance, cost and risk metrics, and what is the impact of ambiguity in this context?
Goals identification
As the rationale for human space exploration is fairly diverse within stakeholders, there is no crisply defined goal on which stakeholders agree for required in-space infrastructure for manned spaceflight. For the purposes of this paper, we will consider a subset of the main Key Supporting Objectives (KSO) for human space exploration defined by the Global Exploration Roadmap (GER) of the International Space
Exploration Coordination Group (ISECG 2011) relevant to the in-space transportation infrastructure architecture:
- Extend Human Presence [KSO 1] - Develop Exploration Technologies and
Capabilities [KSO 2]
- Perform Science to Support Human
Exploration [KSO 3]
- Stimulate Economic Expansion [KSO 4] - Perform Space, Earth, and Applied Science
[KSO 5] - Engage Public in Exploration [KSO 6] The Global Exploration Roadmap derives objectives from these goals, however, it does not provide rationale on how these objectives are linked to each other and how should they be prioritized in the program. For instance, boil-off control and in-situ resource utilization are both objectives mapped to KSO 2 in GER. This paper addresses these questions concurrently and identifies interactions between technology investments, providing insight for future developments.
Functional decomposition
Functions are form-neutral statements derived from the goals as expressed by stakeholders, also referred to as functional requirements. The in-space transportation infrastructure has been modeled with the following functional decomposition:
- Providing Habitation to astronauts at all phases during the Length of the mission - Transporting People and Cargo from Low
Earth Orbit to the Destination
Two main sources of ambiguity that have been underlined: the length of the mission, which is determined by the chosen mission mode, the time spent at the destination and the choice of the destination itself; and destinations, which choice drives value delivery to exploration, science and policy stakeholders.
Requirements enumeration
Areas of potential ambiguity impacting definition of requirements include the following requirement variables:
All rights reserved.
- The choice of a destination (affecting value delivery to stakeholders in goals KSO 1, KSO 2, KSO 3, KSO 4, KSO 5, KSO 6) - Characteristics associated with NEA
destinations, such as characteristic size and
internal composition (affecting value
delivery to stakeholders in goals KSO 2, KSO 3, KSO 4, KSO 6)
- The number of crew in the mission (affecting value delivery to stakeholders in goals KSO 1, KSO 2, KSO 3, KSO 6) - Exploration time available at the
destination for exploration and science
activities (affecting value delivery to stakeholders in goals KSO 1, KSO 2, KSO 3, KSO 4, KSO 5, KSO 6)
- The time of flight of the mission, as a
proxy measure of health risk to astronauts
due to exposure to the harsh radiation environment beyond Low Earth Orbit (affecting value delivery to stakeholders in goals KSO 1 and KSO 2)
Table 1 shows the requirements morphological matrix that has been formulated to study these ambiguities in more detail, by specific alternative options to be considered for each requirement variable. The size of the unconstrained tradespace of requirements in this formulation is of 21,600 possible requirement sets (unconstrained estimate). To allow
comparison with existing architectural baselines, the analysis is focused on a representative mission portfolio comparable to existing NASA baselines such as the ones defined by HAT for NEAs, ESAS for the Moon, and DRA 5.0 for Mars, as outlined in the literature review in Section I.
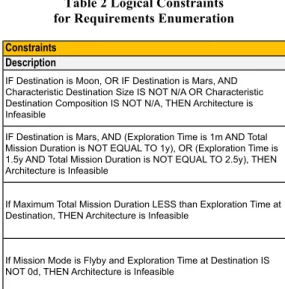
Table 2 shows logical constraints that have been formulated to generate this portfolio of representative missions.
Table 2 Logical Constraints for Requirements Enumeration Constraints
Description
IF Destination is Moon, OR IF Destination is Mars, AND Characteristic Destination Size IS NOT N/A OR Characteristic Destination Composition IS NOT N/A, THEN Architecture is Infeasible
IF Destination is Mars, AND (Exploration Time is 1m AND Total Mission Duration is NOT EQUAL TO 1y), OR (Exploration Time is 1.5y AND Total Mission Duration is NOT EQUAL TO 2.5y), THEN Architecture is Infeasible
If Maximum Total Mission Duration LESS than Exploration Time at Destination, THEN Architecture is Infeasible
If Mission Mode is Flyby and Exploration Time at Destination IS NOT 0d, THEN Architecture is Infeasible
Value associated with requirement sets is defined by a multiplicative multiattribute utility
Requirement Requirement Alternatives No# Alt.
1 2 3 4 5 6
Destination Moon Mars Low Energy NEA
High Energy
NEA
4
Characteristic Destination Size <30m 30m-100m 100m-500m 500m-1km >1km is not NEA)N/A (Dest. 6
Characteristic Destination Composition Carb. Silic. Metallic Other N/A (Dest.
is not NEA) 5
Number of Crew (# crew) 3 4 6 3
Exploration Time at Destination (days) 7d 21d 30d 180d 550d 5
Maximum Total Mission Duration at Full-Scale Capability (years) - Health Risk
Proxy <= 6m 1y 1.5y 2y 2.5y 3y 6 Mission Mode Orbit Surface 2 Tot. Arch. 21600
(MAU) function (Keeney and Raiffa 1976) combining the following property variables: - Total time of flight (as proxy for health risk) - Exploration time at destination
- Delta V capability beyond Escape orbit - Number of crew
- Destinations
- Object size (if destination is NEA) - Object destination (if destination is NEA)
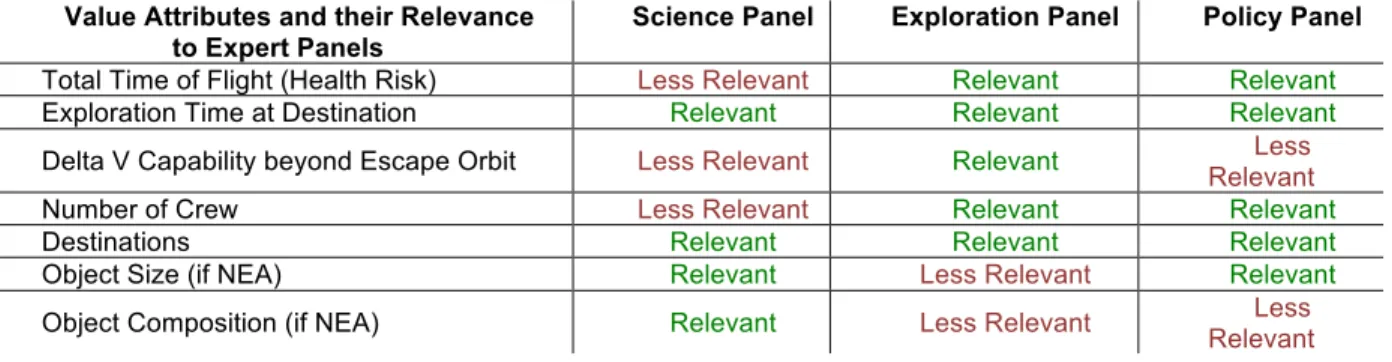
MAU functions are elicited by interviewing expert panels. Property variables are elicited using ordinal scores. Equal complementary MAU weights have been assumed for this analysis. Not all property variables are assumed equally relevant to the three panels. Table 4 shows the assumptions that have been used regarding relevance of each property variable for the science, exploration and policy panels that have been formed. These assumptions have been defined by an iterative verification process involving interviewees of all panels.
Function-form mapping
Functions of the in-space transportation infrastructure architecture are mapped to architectural elements as shown in Figure 2. The architecture is defined by a set of habitat elements and transportation elements. The mapping assumed here is not the only one possible for a transportation architecture. This mapping has been chosen to be compared with existing NASA point designs. Mapping functions to a varying number of elements of form can be modeled as a set partitioning problem (Selva 2012), which is an avenue of interest for future research in this application.
Different technology options for each element of form have been identified and organized in an architecting model, as described in the following discussion.
Architecting model
Architectural decisions and corresponding alternatives for the elements of form is organized in an architectural morphological matrix (Simmons 2008) as shown in Table 3.
Table 3 Architectural Morphological Matrix
Architectural Decision Architectural Alternatives No# Alt.
1 2 3
Cargo Pre-Deployment via SEP Flight Yes No 2
Propellant Boil-off Control Yes No 2
In-Situ Resource Utilization Yes No 2
Aerocapture Yes No 2
Trans-Departure Injection Propellant
Type LOX/LH2 LOX/LCH4 NTR 3
Descent Propellant Type LOX/LH2 LOX/LCH4 2
Ascent Propellant Type LOX/LH2 LOX/LCH4 2
Trans-Earth Injection Propellant Type LOX/LH2 LOX/LCH4 NTR 3
Tot. Arch. 576
Table 4 Value attributes and their assumed relevance to expert panels Value Attributes and their Relevance
to Expert Panels Science Panel Exploration Panel Policy Panel
Total Time of Flight (Health Risk) Less Relevant Relevant Relevant
Exploration Time at Destination Relevant Relevant Relevant
Delta V Capability beyond Escape Orbit Less Relevant Relevant Relevant Less
Number of Crew Less Relevant Relevant Relevant
Destinations Relevant Relevant Relevant
Object Size (if NEA) Relevant Less Relevant Relevant
All rights reserved.
The design space is composed by 576 possible architectures per requirement set (constrained estimate). This results into an (unconstrained) integrated design space size of ~12.4m architectures.
The tradespace was explored with the following metrics:
- Exploration Value - Science Return - Policy Return
- Initial Mass in LEO (IMLEO) - Architecture Risk Ranking (ARR)
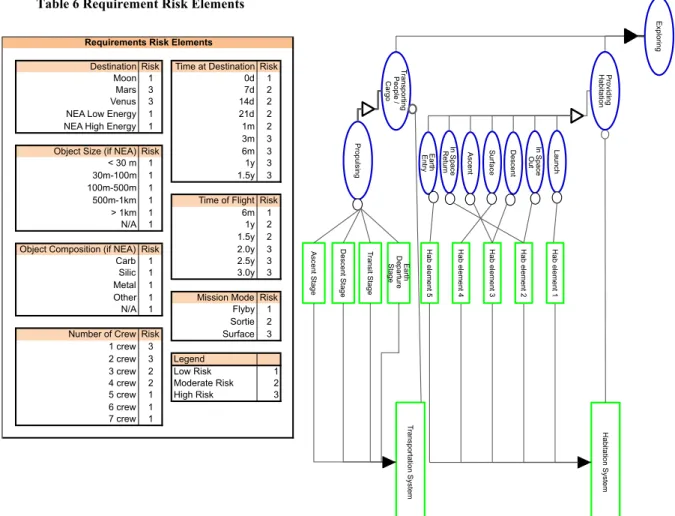
Architecture Risk Ranking (ARR) is
introduced in this paper, and defined as an ordinal metric to rank architectures according to an overall risk assessment based on requirement-related (Table 6) and architectural-requirement-related (Table 5) risks. Risks are ranked with an ordinal scale from 1 (low risk) to 3 (high risk). Architectural risks are further distinguished by past flight heritage, as defined by proxy units of measure (such as landed mass for an aerocapture system). Architecture Risk Ranking is a normalized weighted sum of these two risk types. This discussion presents the analysis assuming equal weights.
Model Validation
The model has been validated by comparison with existing architectural baselines, as shown in Table 7. The validation consisted in evaluating DRA 5.0, Apollo 11, and NASA NEA architectures with the architecting model integrating exploration/science/policy value metrics (which details are defined later in this section), a performance/cost proxy metric (defined by IMLEO), and an ordinal architectural risk metric (the ARR defined in the previous section).
This chapter integrates DB-SAF with the IMLEO estimation model for in-space infrastructured developed by (Rudat, Battat et al. 2012) - who also validated IMLEO numbers using the same reference architectures used in this study - and with the novel ARR model defined in this section.
Step 3/4 – Expert Panel Formation – Problem Formulation Review with Expert Panel
Three expert panels represented Exploration, Science and Policy stakeholders. All panels were composed by senior experts involved in the architecture of the future human spaceflight infrastructure in the United States and in Europe. A total of 15 experts was involved in the study, where each expert has been engaged in a three-round DB-SAF process. Expert contributions are provided in anonymous form. Some experts agreed to be identified as participants of the study; their participation is acknowledged at the end of the paper. In no case contributions are explicitly attributed to any of those experts to protect their anonimity. Table 8 provides a synopsis on the composition of expert panels. As per Step 4, the final problem formulation as presented in this paper has been reviewed and agreed with expert panels as part of the first iteration of the study.
Step 5 – Design of Interview
Interviews asked experts to give ordinal scores to value properties, such as potential exploration destinations, amount of delta V beyond Earth Escape orbit made available by the in-space transportation infrastructure, and so forth.
Step 6 – Elicitation of Expert Value Judgment A total of 45 interviews were conducted to inform this study. Interviews were conducted in person, on VoIP teleconference and over the phone November 2011 and January 2012. Step 7 – Results Analysis
Exploration Panel – Elicitation of Value Functions
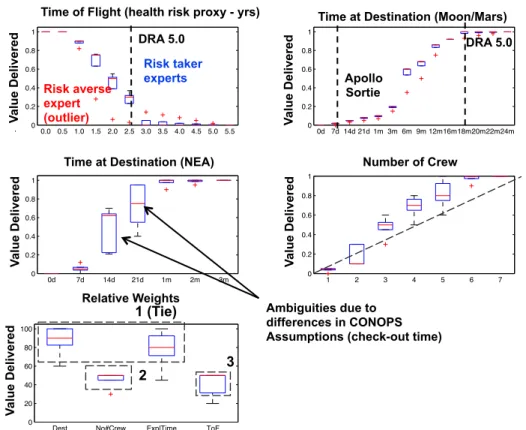
The exploration panel has been called to elicit value judgments on what constitutes exploration value for the in-space exploration infrastructure. Figure 3 and Figure 4 show DB-SAF results of the exploration panel. All DB-SAF plots can be read as follows; the red lines represent median values (50% percentile) of the answers as given by the panel. The lower and upper edges of the blue boxplots represent the 25% and 75% percentile respectively. The black whiskers represent maximum and minimum values given by experts. Red crosses are outliers. These plots were generated at each DB-SAF iteration and
Destination Risk Time at Destination Risk
Moon 1 0d 1
Mars 3 7d 2
Venus 3 14d 2
NEA Low Energy 1 21d 2
NEA High Energy 1 1m 2
3m 3 Object Size (if NEA) Risk 6m 3
< 30 m 1 1y 3
30m-100m 1 1.5y 3
100m-500m 1
500m-1km 1 Time of Flight Risk
> 1km 1 6m 1
N/A 1 1y 2
1.5y 2 Object Composition (if NEA) Risk 2.0y 3
Carb 1 2.5y 3
Silic 1 3.0y 3
Metal 1
Other 1 Mission Mode Risk
N/A 1 Flyby 1
Sortie 2 Number of Crew Risk Surface 3
1 crew 3
2 crew 3 Legend
3 crew 2 Low Risk 1 4 crew 2 Moderate Risk 2 5 crew 1 High Risk 3 6 crew 1
7 crew 1
Requirements Risk Elements
Boiloff Control Proven Heritage No Heritage Ascent Vehicle Propellant Type Proven Heritage No Heritage
Heritage Unit: Not Relevant N.A. N.A. Heritage Unit: Prop. Mass [mt] <= 120mt > 120mt
Yes 2 2 LOX/LH2 1 2
No 1 1 Heritage Unit: Prop. Mass [mt] N.A. All
LOX/LCH4 1 2
ISRU Proven Heritage No Heritage
Heritage Unit: Not Relevant N.A. N.A. Descent Vehicle Propellant Type Proven Heritage No Heritage
Yes 3 3 Heritage Unit: Prop. Mass [mt] <= 120mt > 120mt
No 1 1 LOX/LH2 1 2
Heritage Unit: Prop. Mass [mt] N.A. All
Aerocapture Proven Heritage No Heritage LOX/LCH4 1 2
Heritage Unit: Landed Mass [mt] N.A. N.A.
Yes 2 2 TEI Vehicle Propellant Type Proven Heritage No Heritage
No 1 1 Heritage Unit: Prop. Mass [mt] <= 110mt > 110mt
LOX/LH2 1 2
Transit Vehicle Propellant Type Proven Heritage No Heritage Heritage Unit: Prop. Mass [mt] N.A. All
Heritage Unit: Prop. Mass [mt] <= 120mt > 120mt LOX/LCH4 1 2
LOX/LH2 1 2 Heritage Unit: Prop. Mass [mt] <= 75mt > 75mt
Heritage Unit: Prop. Mass [mt] N.A. All NTR 2 3
LOX/LCH4 1 2
Heritage Unit: Prop. Mass [mt] <= 75mt > 75mt
NTR 2 3
Architectural Risk Elements Table 6 Requirement Risk Elements
H ab ita tio n Syst em Exp lo rin g Pro vi din g Habitation La un ch In Sp ace R etu rn D esce nt Su rf ace Asce nt Ea rt h En try In Sp ace Out T ra nsp ort in g Pe op le / C arg o Pro pu lsi ng Ea rt h D ep art ure St ag e T ra nsi t St ag e D esce nt St ag e Asce nt St ag e Hab e le me nt 1 Hab e le me nt 2 Hab e le me nt 3 Hab e le me nt 4 Hab e le me nt 5 T ra nsp ort ati on Syst em
Figure 2 Function-Form Mapping of the In-space Transportation Infrastructure
All rights reserved.
Destination: NEA Destination: NEA
Characteristic Size: 300m Characteristic Size: 300m
Characteristic Composition: Carbonaceous Characteristic Composition: Carbonaceous
Number of Crew: 4 Number of Crew: 4
Exploration Time at Destination: ~7 days Exploration Time at Destination: ~30 days
Total Mission Duration: ~1 year Total Mission Duration: ~1.5 years
Mission Mode: Surface Mission Mode: Surface
Boiloff Control: No Boiloff Control: No
ISRU: No ISRU: No
Aerocapture: N/A Aerocapture: N/A
Transit Prop. Type: LOX/LH2 Transit Prop. Type: LOX/LH2
Ascent Prop. Type: N/A Ascent Prop. Type: N/A
Descent Prop. Type: N/A Descent Prop. Type: N/A
TEI Prop. Type: NTO/N2O4 (MPCV) TEI Prop. Type: NTO/N2O4 (MPCV) + LOX/LH2
Transit Vehicle Heritage No Heritage Transit Vehicle Heritage No Heritage
Ascent Vehicle Heritage No Heritage Ascent Vehicle Heritage No Heritage
Descent Vehicle Heirtage No Heritage Descent Vehicle Heirtage No Heritage
TEI Vehicle Heirtage No Heritage TEI Vehicle Heirtage No Heritage
Total IMLEO: 2 x 70mt SLS (140mt) Total IMLEO: 3 x 70mt SLS (210mt)
Exploration Value: 0.35 Exploration Value: 0.65
Science Value: 0.5 Science Value: 0.68
Policy Value: 0.33 Policy Value: 0.69
Architectural Risk Ranking: 0.33 Architectural Risk Ranking: 0.33
Low Energy NEA (HAT 2000SG34) High Energy NEA (HAT 2008EV5)
Model-generated Evaluations Model-generated Evaluations
Destination: Mars Destination: Moon
Characteristic Size: N/A Characteristic Size: N/A
Characteristic Composition: N/A Characteristic Composition: N/A
Number of Crew: 6 Number of Crew: 3
Exploration Time at Destination: ~1.5 years Exploration Time at Destination: ~3 days
Total Mission Duration: ~2.5 years Total Mission Duration: ~8 days
Mission Mode: Surface Mission Mode: Surface
Boiloff Control: Yes Boiloff Control: No
ISRU: Yes ISRU: No
Aerocapture: No Aerocapture: N/A
Transit Prop. Type: NTR/LH2 Transit Prop. Type: LOX/LH2
Ascent Prop. Type: LOX/LCH4 Ascent Prop. Type: NTO/N2O4
Descent Prop. Type: LOX/LCH4 Descent Prop. Type: NTO/N2O4
TEI Prop. Type: NTR/LH2 TEI Prop. Type: NTO/N2O4
Transit Vehicle Heritage No Heritage Transit Vehicle Heritage Proven Heritage
Ascent Vehicle Heritage No Heritage Ascent Vehicle Heritage Proven Heritage
Descent Vehicle Heirtage No Heritage Descent Vehicle Heirtage Proven Heritage
TEI Vehicle Heirtage No Heritage TEI Vehicle Heirtage Proven Heritage
Total IMLEO: 848.7mt Total IMLEO: 1 x Saturn V (120mt)
Exploration Value: 1.00 Exploration Value: 0.24
Science Value: 1.00 Science Value: 0.28
Policy Value: 0.81 Policy Value: 0.15
Architectural Risk Ranking: 0.88 Architectural Risk Ranking: 0.21
NASA Design Reference Architecture 5.0 Apollo 11
Model-generated Evaluations Model-generated Evaluations
presented to experts. Experts could see where their answers lied in the distributions, and could change them to either move towards consensus (median value), diverge from consensus, or keep their answers through iterations. In all cases, motivations were asked to justify their positions. By interacting between each other in anonymous form through DB-SAF, experts were able to express their judgments without peer pressure and being able to explain their reasoning clearly, therefore giving the opportunity to document the whole process for analysis. Experts in the exploration panel reached the best consensus among panels. The figure shows six plots, each one representing one value metric. The sixth panel shows weights assigned to value metrics in the aggregate multiplicative (hence nonlinear) MAU formulation. The convention in all value metrics – in this and on science and policy panels as well - is that of value-maximizing
stakeholders.
Time of Flight (as a proxy for health risk):
Time of flight is a proxy of health risk as astronauts are more likely to face adverse
conditions from exposure to the harsh radiation environment beyond the Van Allen Belts. The
shape and gradient on this curve depend on risk
aversion of individual experts in the panel. Risk averse experts argue that safety is a key feature for any future mission of the human spaceflight program Risk taker experts point at an excessive stress to safety as one of the main causes of cost growth and schedule slippage in past exploration programs. They argue that exploration as such is an inherently risky venture. Therefore, risk should be accepted as part of the program to enable sustainable access to new destinations in the Solar System.
Time at destination (Moon/Mars): experts in
Figure 3 Exploration Panel - Round 3
1 Senior Expert (former President of a EU Space Agency) 2 Decision Makers from NASA and ESTEC
1 Senior Advisor from a US Research Institution 1 Professor from Academia (US)
1 Professor from Academia (US) Exploration Panel
Science Panel
Policy Panel
1 Senior Scientist from a US Research Institution 3 Professors from Academia (US)
1 Senior Scientist from a European Industrial Organization 4 Senior Systems Architects & Decision Makers from NASA and ESA
Table 8 Expert Panels Composition
0 0.2 0.4 0.6 0.8 1 0.0 0.5 1.0 1.5 2.0 2.5 3.0 3.5 4.0 4.5 5.0 5.5
Time of Flight [years] (Health Risk) 0 0.2 0.4 0.6 0.8 1 0d 7d 14d 21d 1m 3m 6m 9m 12m16m18m20m22m24m
Time at Destination (Moon/Mars)
0 0.2 0.4 0.6 0.8 1 0d 7d 14d 21d 1m 2m 3m
Time at Destination (NEA)
0 0.2 0.4 0.6 0.8 1 1 2 3 4 5 6 7 Number of Crew 0 20 40 60 80 100
Dest No#Crew ExplTime ToF
Relative Weights DRA 5.0 Risk averse expert (outlier) Risk taker experts Apollo Sortie DRA 5.0 1 (Tie) 2 3 Ambiguities due to differences in CONOPS Assumptions (check-out time)
Time of Flight (health risk proxy - yrs) Time at Destination (Moon/Mars)
Time at Destination (NEA) Number of Crew
Relative Weights Va lu e D el iv er ed Va lu e D el iv er ed Va lu e D el iv er ed Va lu e D el iv er ed Va lu e D el iv er ed
All rights reserved.
the exploration panel were able to reach consensus on value associated to surface stay times on large planetary bodies. The underlying curve is an S-curve, where the shape and the gradient are representative of the marginal value increase or saturation associated with short stay and long stay durations. Experts agree that value associated to surface stay time has increasing marginal returns for short stays, as contribution to exploration value in the first days of exploration is significant, as new areas are explored and new operations initiated on the surface. The right-hand side of the curve shows diminishing marginal returns, meaning that the added value of an additional day on the surface when several months have already been spent there is low. Experts were specifically asked not to include orbital constraints in their assessment. This was motivated by the intent to derive a curve to compare propulsion technologies and mission modes in a second phase of the analysis.
Time at destination (NEA): time at NEA
destinations was measured on a different time scale as agreed with experts. The open debate in this context can be traced to different assumptions by experts on time required for
preparatory and system check-out operations. Such ambiguity could not be reduced in three rounds of iterations among experts, despite sharing expert opinions on those matters. Further discussion and drafting of a specification in this context with particular reference to detailed concepts of operations in the public domain of a NEA mission are advisable to reduce this ambiguity.
Number of crew: experts reached consensus
in that 3 (same crew size as Apollo 11) is the minimum number of crew required for any exploration beyond LEO. Marginal value returns with added crew members is mostly linear as being proportional to the cumulative number of exploration operations that could be conducted on the mission. Diminishing marginal returns at 4 crew. This is in coherence with the current baseline of the Multi-Purpose Crew Exploration Vehicle (MPCV) as developed by NASA (NASA 2012).
Relative weights: experts agree that the
choice of a destination for exploration and time spent at the destination are primary drivers in the evaluation of exploration architecture. Relative ranking between the two is unclear, as the two
Mars
Moon
NEA
Venus
This chart shows an international sampling of current expert opinions on destination selection (as of Q1 2012). Long Stay Long Stay
Flyby Orbit Sortie Flyby Orbit Sortie Flyby Orbit Sortie
Phobos
Deimos SEL2 Flyby Orbit
EML1
Note: Two high-level decision makers confirmed 0 value to NEA / Mars satellite destinations. Va lu e D el iv er ed Destinations
boxplots mostly overlap, signaling a tie in this context. Number of crew is the second most relevant attribute from an exploration perspective. Time of flight is predominantly seen as the last factor of interest in evaluating architectures.
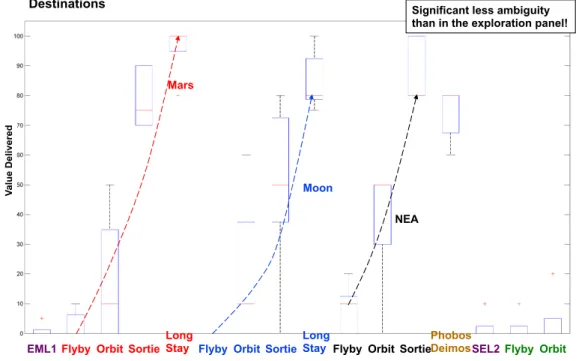
Destinations: the choice of a destination
shows the most irreducible ambiguity in all panels that have been involved in the studyThe debate on destinations is found to be strongly opinionated – while in previous decisions experts were willing to compromise, DB-SAF iterations on destinations showed little room for negotiations. While evolutionary patterns between fly-by, orbit, sortie and long stay mission modes were widely recognized across the panel, the relative ranking between destinations was not. Furthermore, some destinations generated interest only with some experts - such as EML1 or Venus. Notably, NEAs are part of this category. While NASA’s current efforts are focused on the development of a mission to a NEA, not all experts agree on the validity of such destination.
Exploration Panel – Main Highlights
The following points emerge as main highlights from the development of
representative value functions for the exploration panel.
Time at Destination (NEA):
• Exploration value between 14-days and 21-days is an irreducible ambiguity in different assumptions on Concept of Operations (CONOPS) – in particular due to different assumptions on time required for system check-out and testing before commitment to NEA surface operations. • The development of a common and open
standard on a detailed mission CONOPS for NEA missions is recommended.
Destinations:
• Highest degree of irreducible ambiguity. At the same time, the panel ranked destinations as first most important attribute in the evaluation procedure.
• Debate is highly opinionated, impossibility of reaching consensus.
• Open debate on destination selection is highly recommended to reduce associated
0 0.2 0.4 0.6 0.8 1 0d 7d 14d 21d 1m 3m 6m 9m 12m 16m 18m 20m 22m 24m 36m
Time at Destination (Moon/Mars) 0 0.2 0.4 0.6 0.8 1 0d 7d 14d 21d 1m 2m 3m 6m 1y
Time at Destination (NEA)
0 0.2 0.4 0.6 0.8 1 <30m 30m−100m100m−500m500m−1km 1km−5km >5km
Object Size (if NEA)
0 20 40 60 80 100
Carb Silic Metal Other
Object Composition (if NEA)
0 20 40 60 80 100
ExplTime Dest ObjSize ObjComp
Relative Weights
Science return ~ linearly proportional to time at dest.
Most likely max. time
Remote sensing internal tomography
Sample return Field work
>30m, science return insensitive to NEA size.
1 2
3
4
Highly important for astrobiology and planetary formation science questions.
Time at Destination (Moon/Mars) Time at Destination (NEA)
Object Size (NEA)
Relative Weights
Object Composition (NEA)
Va lu e D el iv er ed Va lu e D el iv er ed Va lu e D el iv er ed Va lu e D el iv er ed Va lu e D el iv er ed
All rights reserved.
ambiguity within NASA and with international partners. Of particular interest is reduction of ambiguity on NEA mission architectures, which evaluation in terms of exploration panel appears bimodal, with experts giving high value to NEA missions versus experts giving zero value to NEA missions. Both parties did not agree in modifying their position at any point during the debate due to fundamental different value assumptions.
Science Panel – Elicitation of Value Functions Science experts shared the opinion that science in a human spaceflight program is a complementary objective, certainly important but not primary. DB-SAF results of the science panel are shown in Figure 5 and Figure 6. A discussion on the set of property variables of interest to scientists follows.
Time at destination (Moon/Mars): Science
return is perceived as proportional to exploration time at the destination.
Time at destination (NEA): Value associated
with time on NEAs featured a double plateau, due to different types of science that could be done on that mission. Remote sensing and internal tomography of NEA interiors is possible via orbit operations, therefore representing early value delivering activities such a science program. Additional time spent (associated with NEA surface operations) increases value significantly by enabling sample return and geological field work activities. A maximum time of 3 months is foreseen on the surface for a first NEA mission.
Object size (NEA): for NEAs with a
characteristic size greater than 30m, science value is insensitive to object size.
Object composition (NEA): While all
compositions are of interest to answer questions in planetary science, carbonaceous objects emerge as clear priorities due to their importance in answering relevant questions in astrobiology and planetary formation. Carbonaceous NEAs are samples of thermally unprocessed, pristine material from the origin of the Solar System.
Relative weights: the science panel followed
a value-driven approach, where the choice of a destination was clearly recognized as the first priority in evaluation. Second to it object composition, although this opinion varied according to whether the expert in question was concerned with science related to NEA composition (such as geologists). Time spent at the destination emerged as third priority. Object size and time of flight tied as last priorities, as also shown in the discussion above.
Destinations: Clear evolutionary trends are
found in Mars, Moon and NEA missions. As NEAs are valuable evidence to study planetary formation and the origin of the Solar System, they were retained by the panel of high science value. No or little science value was associated to EML1, SEL2 and Venus manned flyby/orbit missions, as neither of those benefit of humans as enablers of science.
Science Panel – Main Highlights
• Humans are seen as enablers of certain science (such as sample return and geology field work) and evaluations calibrated accordingly.
• Carbonaceous are a privileged NEA category as they are samples of thermally unprocessed, pristine material answering questions on planetary formation and the history of the Solar System.
• Object composition is key for NEA mission selection. NEA size does not matter, unless looking at specific NEA science questions such as rubble pile versus onion shell theories for NEA internal composition, which can also be answered by use of tomography instruments.
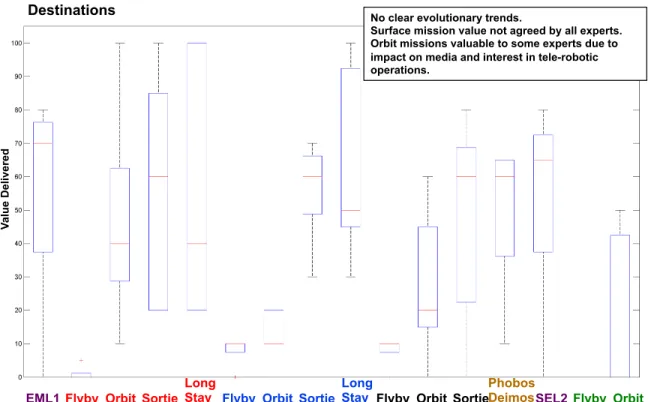
Policy Panel – Elicitation of Value Functions The policy panel followed more qualitative logics in the evaluation than other panels. DB-SAF policy panel results are shown in Figure 7 and Figure 8.
Total time of flight (as proxy for health risk):
time of flight was not seen only in light of technical constraints, but also considering policy constraints such as short-term policy return. Certain policy experts in the panel motivated their answers based on the fact that US Congress
changes in 2 year cycles, and a US President in 4 year (one term) and 8 year (two terms) cycles. Ambiguity on this value function could be effectively reduced in three iterations.
Time at Destination (Moon): the panel
proposed to consider this measure separately for Moon, Mars and NEAs. For the Moon, the maximum was identified in 6 months for a lunar base settlement, in agreement with previous experience with the International Space Station.
The trend over time follows a curve with diminishing marginal returns. Value was estimated as zero for a seven day Moon sortie, as experts stated the desire for new Moon programs to advance from the Apollo era and have an impact on media and the public opinion.
Time at Destination (Mars): a step-wise trend
was identified by the panel, marking the difference between 30 day sortie and 550 sortie mission modes. The DRA 5.0 baseline for
Figure 7 Science Panel - Destination Choice - Round 3
Mars
Moon
NEA
Long
Stay Long Stay
Flyby Orbit Sortie Flyby Orbit Sortie Flyby Orbit Sortie
Phobos
Deimos SEL2 Flyby Orbit EML1
Significant less ambiguity than in the exploration panel!
Va lu e D el iv er ed Destinations Congress 2-year cycle
“have to do better than Apollo”
“have to do better than Apollo” Motivated by impact on media and public
Motivated by impact on media and public
Priorities left unclearly defined
Object composition deemed less relevant.
(except for one expert motivated by the development of a space economy based on asteroid mining)
Time of Flight (health risk proxy) Time at Destination (Moon)
Time at Destination (Mars) Time at Destination (NEA)
Number of Crew
Relative Weights
Object Size (NEA)
Va lu e D el iv er ed Va lu e D el iv er ed Va lu e D el iv er ed Va lu e D el iv er ed Va lu e D el iv er ed Va lu e D el iv er ed Va lu e D el iv er ed
All rights reserved.
surface stay (~18 months) is on the point of diminishing marginal returns of the curve.
Time at Destination (NEA): a clear trend
showing diminishing marginal returns was identified by the panel. Value saturates at 1 month of exploration, with substantial value delivery (> 50%) at 2 weeks of exploration. This was motivated as policy experts believe such a mission would have greater impact on media and the public in the short term rather than in the long term. This conclusion suggests to keep mission duration in the order of one month, in accordance with NASA baseline NEA architectures.
Number of Crew: the panel took the Apollo
program as a reference considering a crew range between 3 and 6 crew members, with a linear increase in value in this range.
Object Size: value increases proportionally to
object size showing diminishing marginal returns. Object size is related to the impact on the media and the public associated with the mission.
Object composition was deemed irrelevant by policy experts. An exception is made by experts advocating for the development of a space economy, who are therefore interested in NEA objects which composition suits the needs
for the development of asteroid mining ventures.
Relative Weights: an unclear priority ranking
was elicited by the panel. High irreducible ambiguity is due to the plurality of non reconcilable intents.
This last result implies the lack of strong leadership driving worldwide policy opinions.
Destinations: No clear evolutionary trends
were identified between missions modes (flyby, orbit, sortie and long stay).. In some cases, orbit missions were deemed more valuable than surface missions as experts believed these alone deliver significant impact to the media and on public opinion, while enabling exploration opportunities provided by tele-robotic exploration on planetary surfaces – therefore mitigating communication lags.
Policy Panel – Main Highlights
• No clear leadership or consensus emerging, which implies the need to bring concepts for further evaluation.
• Time scale arguments were based on impact on media and public opinion, and were based on coherence with possible political changes rather than scientific/engineering
Figure 8 Policy Panel - Destination Choice - Round 3
No clear evolutionary trends.
Surface mission value not agreed by all experts. Orbit missions valuable to some experts due to impact on media and interest in tele-robotic operations.
Long
Stay Long Stay
Flyby Orbit Sortie Flyby Orbit Sortie Flyby Orbit Sortie
Phobos
Deimos SEL2 Flyby Orbit
EML1 Va lu e D el iv er ed Destinations
rationale.
• No evolutionary trends in destination choice was found between mission modes (flyby, orbit, sortie and surface long stay) as perceived by other panels.
• Orbit missions were deemed valuable by some policy experts for their impact on media and public opinion (such as in Apollo 8).
Step 8 – Aggregate Results Discussion
The expert elicitation process described so far represents the first part of the study, where system objectives for the in-space infrastructures have been identified along with their associated uncertainties – or ambiguities. In other words, the study identified how value – or benefits – is measured by stakeholders for a transportation infrastructure. Leveraging on this result, this section shows a first-order benefit-cost analysis of the in-space transportation infrastructure, and performs tradespace exploration to characterize architectural decisions .
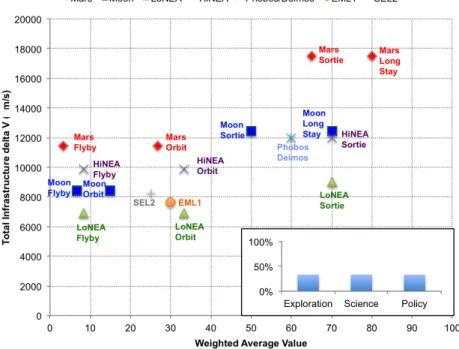
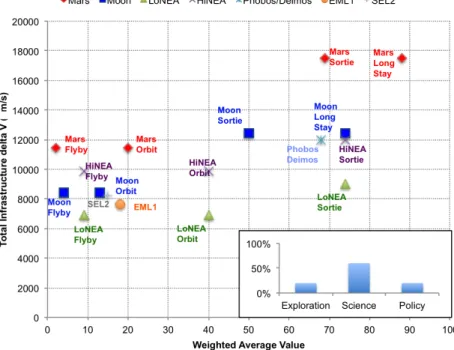
The proxy measure for benefit is defined as the weighted average of median values of value functions derived by the expert panels. Weights represent panel preferences. A proxy for cost is defined as the total delta V that the infrastructure needs to provide for a given destination / mission mode (for instance Moon Sortie, or Mars Long Stay). We neglect Venus in this analysis, as expert elicitation results results have shown this choice was dominated in value in all panels by other destinations.
Sensitivity analysis results to different panel weights are shown in Figure 9, Figure 10, Figure 11, and Figure 12. The following results emerge from the first-order benefit/cost analysis shown in the abovementioned figures:
• NEA destinations are always on the Pareto front. Low-energy NEAs represent efficient benefit/cost tradeoffs being on the kick of the curve. This result is confirmed in all the scenarios considered in the sensitivity analysis. • While high-energy NEAs are always dominated in a Pareto sense, they represent destinations of interest as they require higher capabilities in terms of delta V, better approaching energy requirements of future Mars missions.
• Value associated with mission duration and mission mode (flyby vs orbit vs sortie vs long stay) is moderately panel dependent. Said value is higher for exploration and science biased scenarios, for which longer durations are preferred. Value is lower in the policy-biased scenario, as policy experts showed preference for shorter mission durations for early value return within Presidential and Congressional mandates. • Value associated with EML1 and SEL2 destinations is highly panel dependent. They show high value (close to the Pareto front) in the policy-biased scenario, as these destinations comply with current policy guidance (as of Q1 2012), and represent a gateway for future exploration as discussed previously. An exploration-biased assumption returns moderate value from these destinations, since technology development is enabled by these destinations (while having lower exploration value when compared to other alternatives). Value is low in a science-bias assumption, as EML1 and SEL2 are empty points in deep space, where no human-enabled science (such as sample return) can be performed.
Step 9 – Convergence Criteria
A maximum number of three iterations has been used as termination criteria for DB-SAF. The choice of a convergence criteria resulted from a tradeoff between expert’s time availability and the focus of the architecting study. Convergence has been verified with experts; they confirmed that they were unlikely to change their answers in a fourth round of DB-SAF, therefore the study was called to a close. Step 10 – Recommendations
The following recommendations emerge from the analysis: 1) The choice of a destination is the predominant irreducible ambiguity affecting the architecture of in-space transportation infrastructure, with particular impact on exploration-related and policy-related stakeholders. 2) No clear leadership or consensus emerging among policy makers in setting a direction for human spaceflight, which implies the need for NASA to bring new concepts for further evaluation. 3) In NEA architectures, prefer carbonaceous, large-sized (>100m) NEA destinations to leverage on added value of
All rights reserved.
human presence for enhanced sample return. 4) Develop an open standard on a detailed mission CONOPS for NEA missions to reduce ambiguity on exploration value definition.
V. SUMMARY AND CONCLUSIONS This paper implemented a Delphi-Based Systems Architecting Framework for the architecting problem of in-space transportation infrastructure for human exploration beyond Low Earth Orbit. This study identified the ambiguities in the definition of the functional intent in the infrastructure architecture, with direct impact on value delivery to stakeholder as expressed by goals. The most important result of the analysis is the identification of a critical irreducible ambiguity undermining success in delivering value for the in-space transportation infrastructure of the next three decades: destination choice. While NASA’s program of record at the time of writing of this paper is focused on architecting a human spaceflight mission to a Near Earth Asteroid, consensus on this architecture is far from being reached by the community at large, with particular reference to exploration and policy stakeholders.
The realization of this ambiguity is a call for NASA to promote an open forum on this topic, and to develop a strong case for investments in the human spaceflight industry in the next decades by policy makers. Ambiguity and current lack of consesus in policy leadership, as emerged by this study, are critical items to be addressed in today’s early design stages of the design of in-space systems for successful development, implementation, operations and value delivery of the infrastructure of tomorrow.
VI. ACKNOWLEDGMENTS
This study has been conducted under the NASA-MIT research grant “Comprehensive Analysis and Synthesis of Exploration Architectures” sponsored by NASA HEOMD. The authors would like to extend his sincere gratitude to the following experts who contributed to the study: Robert Braun (Georgia Institute of Technology), Silvano Casini (former Italian Space Agency), Clark Chapman (Southwest Research Institute), Raymond Colladay (NASA Advisory Council), Simonetta Di Pippo (ESA ESTEC), Bret Drake (NASA
JSC), Dave Korsmeyer (NASA ARC), John Logsdon (George Washington University), Franco Ongaro (ESA ESTEC), Ettore Perozzi (Elecnor Deimos), Andy Rivkin (JHU APL), Sara Seager (MIT), and other three anonymous contributors.
Figure 9 Benefit-Cost Analysis Results - Equal Weights (33.33% Exploration, 33.33% Science, 33.33% Policy)
All rights reserved.
Figure 11 Benefit-Cost Analysis Results - Science Bias Scenario (20% Exploration, 60% Science, 20% Policy)
VII. REFERENCES
Aliakbargolkar, A. (2012). A Framework for Space Systems Architecting under Stakeholder Objectives Ambiguity. Ph.D., Massachusetts Institute of Technology.
Aliakbargolkar, A., A. C. Wicht, et al. (2011). Heavy Lift Launch Vehicle Systems Architecting. 62nd International Astronautical Congress, Cape Town, South Africa, International Astronautical Federation.
Chang, K. (2010). Obama Calls for End to NASA's Moon Program. New York Times. New York, The New York Times Company.
Chang, K. (2011). NASA Unveils New Rocket Design. New York Times. New York. Chang, K. (2011). The Shuttle Ends Its Final
Voyage and an Era in Space. The New York Times. New York, The New York Times Company.
Connolly, J. F. (2006). Constellation Program Overview, NASA Presentation.
Culbert, C. (2011). Human Space Flight Architecture Team (HAT) Overview. GER Workshop.
Drake, B. G. (2009). Human Exploration of Mars - Design Reference Architecture 5.0. M. A. S. Group. Washington DC, NASA Headquarters.
ISECG (2011). Global Exploration Roadmap. ISECG.
Keeney, R. and H. Raiffa (1976). Decisions with Multiple Objectives. New York, John Wiley and Sons.
Koo, H. Y. B. (2005). A Meta-language for Systems Architecting. Ph.D., Massachusetts Institute of Technology. MIT and Draper (2005). Concept Exploration
and Refinement - Final Report. Cambridge, MA, Massachusetts Institute of Technology.
NASA (2004). The Vision for Space Exploration. 2010.
NASA (2005). Exploration Systems Architecture Study - Final Report.
NASA (2009). Review of US Human Spaceflight Plans Committee - Final Report.
NASA (2010). Human Exploration Framework
Team (HEFT).
http://www.nasa.gov/pdf/457412main_E
EWS - Intro.pdf.
NASA. (2011). "NASA Announces Design for New Deep Space Exploration System." Retrieved February 16, 2012, 2012, from
http://www.nasa.gov/exploration/system s/sls/sls1.html.
NASA. (2012). "Orion Multi-Purpose Crew Vehicle." Retrieved September, 2012, from http://www.nasa.gov/orion/. Rowe, G. and G. Wright (1999). "The Delphi
technique as a forecasting tool: issues and analysis." International Journal of Forecasting 15(Journal Article): 353-375.
Rowe, G., G. Wright, et al. (1991). "Delphi: A Reevaluation of Research and Theory." Technological Forecasting and Social Change(Journal Article): 235-251. Rudat, A., J. A. Battat, et al. (2012). Tradespace
Exploration Approach for Architectural Definition of In-Space Transportation Infrastructure Systems for Future Human Space Exploration. International Astronautical Congress IAC 2012, Naples, Italy, International Astronautical Federation.
Selva, D. (2012). Rule-based System Architecting of Earth Observation Satellite Systems. Ph.D., Massachusetts Institute of Technology.
Simmons, W. L. (2008). A Framework for Decision Support in Systems Architecting. Ph.D., Massachusetts Institute of Technology.