Assessing the ceRNA Hypothesis with Quantitative
Measurements of miRNA and Target Abundance
The MIT Faculty has made this article openly available.
Please share
how this access benefits you. Your story matters.
Citation
Denzler, Rémy et al. “Assessing the ceRNA Hypothesis with
Quantitative Measurements of miRNA and Target Abundance.”
Molecular Cell 54, 5 (June 2014): 766–776 © 2014 Elsevier Inc
As Published
http://dx.doi.org/10.1016/J.MOLCEL.2014.03.045
Publisher
Elsevier BV
Version
Author's final manuscript
Citable link
http://hdl.handle.net/1721.1/116326
Terms of Use
Creative Commons Attribution-NonCommercial-NoDerivs License
Assessing the ceRNA hypothesis with quantitative
measurements of miRNA and target abundance
Rémy Denzler1,2, Vikram Agarwal3,4,5, Joanna Stefano3,4, David P Bartel3,4,6, and Markus Stoffel1,2,6
1Institute of Molecular Health Sciences, ETH Zurich, Otto-Stern-Weg 7, HPL H36, 8093 Zurich,
Switzerland 2Competence Center of Systems Physiology and Metabolic Disease, ETH Zurich,
Otto-Stern-Weg 7, 8093 Zurich, Switzerland 3Howard Hughes Medical Institute and Whitehead
Institute for Biomedical Research, Cambridge, MA 02142, USA 4Department of Biology,
Massachusetts Institute of Technology, Cambridge, MA 02139, USA 5Computational and
Systems Biology Program, Massachusetts Institute of Technology, Cambridge, MA 02139, USA
SUMMARY
Recent studies have reported that competitive endogenous RNAs (ceRNAs) can act as sponges for a microRNA (miRNA) through their binding sites and that changes in ceRNA abundances from individual genes can modulate the miRNA’s activity. Consideration of this hypothesis would benefit from knowing the quantitative relationship between a miRNA and its endogenous target sites. Here, we altered intracellular target-site abundance through expression of a miR-122 target in hepatocytes and livers, and analyzed the effects on miR-122 target genes. Target repression was released in a threshold-like manner at high target-site abundance (≥1.5×10⁵ added target sites per cell), and this threshold was insensitive to the effective levels of the miRNA. Furthermore, in response to extreme metabolic liver disease models, global target-site abundance of hepatocytes did not change sufficiently to affect miRNA-mediated repression. Thus, modulation of miRNA target abundance is unlikely to cause significant effects on gene expression and metabolism through a ceRNA effect.
© 2014 Elsevier Inc. All rights reserved.
6Correspondence should be addressed to: DPB and MS, [email protected] and [email protected].
ACCESSION NUMBERS
The data discussed in this publication have been deposited in NCBI’s Gene Expression Omnibus and are accessible through GEO Series accession number GSE52801.
SUPPLEMENTAL INFORMATION
Supplemental Information includes Extended Experimental Procedures, four figures, and three tables and can be found with this article online at (Reference).
Publisher's Disclaimer: This is a PDF file of an unedited manuscript that has been accepted for publication. As a service to our
customers we are providing this early version of the manuscript. The manuscript will undergo copyediting, typesetting, and review of
NIH Public Access
Author Manuscript
Mol Cell. Author manuscript; available in PMC 2015 June 05. Published in final edited form as:
Mol Cell. 2014 June 5; 54(5): 766–776. doi:10.1016/j.molcel.2014.03.045.
NIH-PA Author Manuscript
NIH-PA Author Manuscript
INTRODUCTION
MicroRNAs (miRNAs) are an abundant class of small, non-coding RNAs that regulate gene expression at the levels of mRNA stability and translation (Pillai et al., 2005; Eulalio et al., 2008; Guo et al., 2010). They pair to target sites (referred to as miRNA response elements, or MREs) within mRNAs to direct the post-transcriptional downregulation of these mRNA targets. The human genome has more than 500 miRNA genes, with miRNAs from
individual gene families able to target hundreds of different messenger RNAs (Baek et al., 2008; Friedman et al., 2009). With more than half of all human mRNAs estimated to be conserved miRNA targets, miRNAs are thought to have widespread effects on gene regulation (Friedman et al., 2009). Even though many miRNA knock-out models show no apparent defect under normal conditions, they frequently exhibit miRNA-dependent phenotypes when specific stresses are applied (Li et al., 2009; Brenner et al., 2010). miRNAs are therefore proposed to be critical regulators in stress signal mediation and modulation, where inadequate miRNA levels and responses can cause or exacerbate disease (Mendell and Olson, 2012).
Highly expressed, site-containing RNAs, either found naturally or delivered as research reagents, can act as “sponges” to titrate miRNAs away from other normal targets (Ebert et al., 2007; Franco-Zorrilla et al., 2007; Mukherji et al., 2011; Hansen et al., 2013; Memczak et al., 2013). Theoretical and experimental reports have claimed that crosstalk between site-containing RNAs extends far beyond a few highly expressed sponges. Analyses of high-throughput datasets indicate that the activity of a miRNA is not just dependent on its levels, but also its relative target-site abundance, defined as the relative number of sites within the transcriptome for that miRNA (Arvey et al., 2010; Garcia et al., 2011). One hypothesis suggests that this crosstalk has a widespread regulatory function, with the act of titrating miRNAs away from their other targets somehow explaining why so many target sites have been conserved in evolution (Seitz, 2009). This idea is extended to the notion that many miRNA targets act as competitive endogenous RNAs (ceRNAs) that modulate the repression of other targets as their expression increases or decreases (Salmena et al., 2011; Tay et al., 2011). Experimental evidence for such a ceRNA crosstalk was initially described for the tumor-suppressor gene PTEN, which appears to be regulated by the abundance of its pseudogene (PTENP1) in a DICER-dependent manner (Poliseno et al., 2010). Recent studies have reported the potential physiological relevance of other ceRNAs, including a long non-coding RNA (lncRNA) regulating muscle differentiation (Cesana et al., 2011), an overexpressed 3′ untranslated region (3′UTR) inducing cancer in transgenic mice (Fang et al., 2013), and a circular RNA regulating miR-7 activity in the central nervous system (Hansen et al., 2013; Memczak et al., 2013). However, such studies have used cancer cell lines with abnormal miRNA and ceRNA expression (Poliseno et al., 2010; Karreth et al., 2011), leaving their physiological relevance in primary cells unclear.
The ceRNA hypothesis is controversial because it is difficult to imagine how the change in expression of individual miRNA targets, which each typically contribute a miniscule fraction of the cellular target-site abundance, could possibly influence enough miRNA molecules to affect regulation of other targets. Consideration of the ceRNA hypothesis would clearly benefit from quantitative knowledge of the intracellular relationship of
NIH-PA Author Manuscript
NIH-PA Author Manuscript
miRNAs and their corresponding target sites. Although some attempts have been undertaken to evaluate this relationship, the data were typically acquired either in silico (Ala et al., 2013; Figliuzzi et al., 2013), in vitro using purified components (Wee et al., 2012), or in experimental setups in which rapidly dividing cells were transfected with synthetic
miRNAs, which complicate any interpretations more quantitative than relative comparisons (Arvey et al., 2010; Garcia et al., 2011; Tay et al., 2011). A more recent study not subject to these limitations reported that miRNA efficacy tended to be higher for miRNAs with lower predicted-target: miRNA ratios, but did not address the question of how much change in ceRNA might be required to detectably influence miRNA efficacy (Mullokandov et al., 2012).
In this study we analyzed the stoichiometric relationship of miR-122 and its target sites by manipulating target-site abundance through controlled expression of a validated target of miR-122 in primary hepatocytes and livers. miR-122 has been linked to important human diseases such as hepatitis C, liver cancer, and hypercholesterolemia, and its target genes have been well characterized (Jopling et al., 2005; Krutzfeldt et al., 2005; Esau et al., 2006; Tsai et al., 2009). Our absolute quantification of relevant entities in primary cells and disease states provided insights on the relationship between miR-122 target-site abundance and miR-122 activity. These results will facilitate future studies predicting the biologically relevant range of target-site abundances of other miRNAs and the magnitude of change in target abundance required to influence gene expression through a ceRNA mechanism.
RESULTS
miRNA target derepression is detected at a high threshold of added MREs
To assess the relationship between a miRNA and its MREs, and the effect of this
relationship on target gene regulation, we chose the highly expressed, liver-specific miR-122 as a model system. We manipulated endogenous MREs in a controlled manner by
overexpressing a full-length AldolaseA (AldoA) mRNA, a strong and validated target of miR-122 (Krutzfeldt et al., 2005), using recombinant adenoviruses (Ad-AldoA) carrying either a mutated (Mut), one (1s), or three (3s) miR-122 binding site(s) (Figures 1A and S1A). To eliminate potential off-target effects mediated by the AldoA protein, we
introduced a premature stop codon that prevented translation of AldoA protein (Figure S1B). To assess the stoichiometric relationship of miR-122 and the added MREs in primary hepatocytes, we measured the absolute number of these entities per cell. Quantitative RT-PCR measurements, calibrated using an internal standard curve of synthetic miRNA, revealed that miR-122 was expressed at 1.2 × 10⁵ molecules per cell (Figure 1B), comparable to levels previously reported (Bissels et al., 2009). As expected, miR-16 and miR-33 were each expressed at fewer copies per cell (1.1 × 10⁴ and 1.2 × 10³, respectively). We next measured the increased miR-122 target abundance after infecting hepatocytes with Ad-AldoA at three different multiplicities of infection (MOI 2, 20, and 200), using our constructs that introduced zero, one, or three miR-122 MREs per AldoA transcript. Adenovirus constructs showed very high transduction efficiencies (Figure S2A), with a linear correlation observed between viral dose and green fluorescent protein (GFP) mRNA, which was expressed from an independent promoter in the Ad-AldoA vector (Figure 1C).
NIH-PA Author Manuscript
NIH-PA Author Manuscript
Similar results were observed when monitoring GFP protein levels (Figures S2B and S2C). At MOI 200, AldoA transcripts increased from 3.3 × 10³ (endogenous levels) to 0.8–1.1 × 10⁶ molecules per cell (Figure 1D), introducing up to 2.6 × 10⁶ AldoA MREs per cell
(Figure 1E). The ratio of AldoA to GFP mRNA showed that the AldoA transcripts were repressed in an MRE-dependent manner at MOI 2 and 20, which confirmed that miR-122 was functionally engaging the MREs within these transcripts (Figure 1F). This regulation disappeared at MOI 200, suggesting that at this very high multiplicity of infection AldoA transcript overwhelmed the regulatory capacity of miR-122 (Figure 1F). Quantification of miR-122 confirmed that the loss of regulation was not due to a loss in miR-122; even the very high levels Ad-AldoA did not influence the levels of either miR-122 or two control miRNAs, although it did reduce miR-33 by 2-fold (Figure 1G).
Having observed a loss in AldoA repression at high multiplicity of infection, we reasoned that high levels of AldoA transcript could act as a sponge to also derepress cellular miR-122 targets. Indeed, known miR-122 targets, but not a control transcript ApoM, increased at high multiplicity of infection (Figures 1H and S2D). Interestingly, this derepression was
confidently detected only when AldoA MREs exceeded 1.5–2.7 × 10⁵ per cell. This
threshold corresponded to 1.25–2.25 MREs per miR-122 molecule. Once this threshold was exceeded, additional AldoA MREs led to greater miR-122 target derepression, with a magnitude correlated with the number of miR-122 sites introduced by AldoA transcripts. Together, these data demonstrate that derepression mediated through increased expression of a miR-122 target can occur but can be detected only after exceeding a high threshold of added MREs.
The high threshold persists after lowering miR-122 activity
Two scenarios might explain the high threshold of added MREs required to observe endogenous target derepression. The “excess miRNA” scenario posits that very abundant miRNAs are present in excess over their targets, and thus competing MREs would need to titrate this excess binding capacity before they could exert an observable effect on
endogenous target repression. Our case of miR-122 in hepatocytes would be one of the more attractive candidates for this scenario, as miR-122 is the most abundant miRNA in
hepatocytes (Landgraf et al., 2007). Indeed, its abundance of 1.2 × 10⁵ molecules per cell is among the highest reported for a miRNA in any mammalian system. The second scenario is the “high target-site abundance” scenario. In this scenario, the effective number of miRNA-binding sites within cellular transcripts is so high that even highly expressed miRNAs are mostly bound to a site at any moment in time, and thus the number of competing MREs would need to approach this high effective number of sites before the competing MREs could exert an observable impact on endogenous target repression. The idea of many miRNA-binding sites within cellular transcripts is supported by reports that many miRNAs have hundreds of conserved MREs (Friedman et al., 2009), that miRNAs also repress many additional mRNAs with non-conserved MREs (Farh et al., 2005; Krutzfeldt et al., 2005; Giraldez et al., 2006; Baek et al., 2008), and that high-throughput crosslinking identifies many additional binding sites that would not be classified as MREs because they don’t mediate detectable repression (including many sites within open reading frames and marginally effective sites elsewhere) but would nonetheless add to the effective number of
NIH-PA Author Manuscript
NIH-PA Author Manuscript
binding sites (Hafner et al., 2010). These two scenarios predict two very different responses to miRNA reduction. In the excess miRNA scenario, miRNA reduction would lower the excess miRNA capacity and thereby lower the threshold of added MREs required to observe endogenous target derepression. In the high target-site abundance scenario, the effective number of sites already exceeds the miRNA abundance, and more importantly, the threshold relates to the effective number of binding sites and not the number of miRNA molecules. Thus, in this scenario miRNA reduction would lower the degree to which targets are repressed, but it would not lower the threshold of added MREs required to observe derepression.
By analyzing whether a change in miRNA levels influences the threshold for the number of added AldoA MREs needed for derepression, we sought to experimentally evaluate which scenario applies. We injected three different amounts (low, intermediate, and high) of Antagomir-122 (Ant-122) into mice and found that miR-122 levels detected in the primary hepatocytes were reduced to 0.3, 0.08, and 0.01 of that observed in hepatocytes from mice injected with the mismatch Antagomir-122 control (Ant-122mm) (Krutzfeldt et al., 2005) (Figure 2A). Target-gene derepression correlated with decreased miR-122 levels, which confirmed that our miR-122 quantification reflected miR-122 activity (Figure 2B). We next studied the effect of controlled overexpression of AldoA MRE on target-gene derepression in hepatocytes with a modest 3-fold decrease in miR-122 levels. Interestingly, derepression was detected only when exceeding the threshold of 2 × 10⁵ AldoA MREs per cell (Figure 2C). This threshold was comparable to that observed in cells without reduced miR-122 levels, which indicated that the reason for the threshold was not excess miR-122 binding capacity. Instead, high target-site abundance is the more likely reason that the amount of added MREs must exceed a very high level before exerting an observable effect.
Some studies claiming ceRNA-mediated gene regulation focus on the number of sites to miRNA families that are shared between the ceRNAs, without differentiating between those miRNAs that are expressed at a level sufficient to repress target genes and those that are not (Jeyapalan et al., 2011; Fang et al., 2013). To demonstrate that derepression can only occur in conditions in which target-gene repression is happening, we infected hepatocytes harboring different miR-122 levels with Ad-AldoA at MOI 200 and measured target derepression. Levels of AldoA and respective AldoA MRE copy numbers per cell were comparable in all Antagomir-treated samples (Figures 2D and 2E). miR-122 target gene derepression was between 1.5 and 2.5-fold in hepatocytes with high miR-122 levels, and below 1.5-fold in cells with intermediate miR-122 activity (Figure 2F). No target gene derepression was observed in hepatocytes with the lowest miR-122 levels. Together, these data demonstrate that miRNAs need to exceed an expression level sufficient to repress their targets in order for targets to be derepressed in a ceRNA-dependent manner.
The magnitude of derepression correlates with predicted site efficacy and number of added AldoA MREs
Previous ceRNA studies have focused on only one or a few targets of a miRNA even though a ceRNA change that influences miRNA activity would be expected to affect more than a few targets. Since any perturbation of a cell might result in spurious expression changes in a
NIH-PA Author Manuscript
NIH-PA Author Manuscript
few predicted targets, a transcriptome-wide analysis examining the preferential effect on predicted targets would more confidently detect the influence of a competing RNA. We therefore extended our quantitative analysis to the transcriptome and performed RNA sequencing (RNA-seq) on primary hepatocytes infected with different Ad-AldoA constructs at MOI 2, 20, and 200. We then analyzed the relationship between the derepression of predicted targets and their site number, site type (6-, 7-, and 8-nt sites), site position, and other determinants used by TargetScan to calculate total context+ scores of predicted miRNA targets (Lewis et al., 2005; Grimson et al., 2007; Garcia et al., 2011). When predicted targets of miR-122, miR-33, miR-16, or abundant miRNA families in liver (either let-7, miR-192, or a combination of the next four most abundant families) were distributed into ten context+ score bins and plotted against their median fold change, the effect of target derepression was evident for predicted targets of miR-122 but not for those of any of the other miRNA families (Figures 3A, S3A, S3B, and Table S1). As expected, the extent of target derepression correlated with the magnitude of the context+ score as well as with the number of added AldoA MREs. These correlations were also observed in the fold-change distributions of miR-122 predicted targets (Figure 3B), with analogous results obtained when stratifying predicted targets by site type (Figure S3C). Regardless of how we grouped the predicted targets, the same threshold of ≥1.5 × 10⁵ added MREs per cell was required to
observe miR-122 derepression. We also studied target gene derepression in primary hepatocytes treated with Ant-122 or the mismatch control, Ant-122mm and found that the strongest predicted targets (e.g., those with a context+ scores below −0.2) were significantly derepressed in the Ant-122-treated conditions (Figures S3D–G, and Table S1).
Modest changes in target abundance are induced by metabolic stress and disease We next sought to investigate the quantitative relationship between MREs added upon Ad-AldoA infection and those normally contributed by mRNAs of primary hepatocytes. We first tested how transcript abundances, measured by RNA-seq in FPKM (fragments per kilobase of transcript per million fragments mapped), correlated with the absolute copy numbers determined by quantitative PCR. To this end, we compared the expression levels of four genes that are differentially expressed in primary hepatocyte and liver samples, and found a linear relationship between FPKM and absolute copy numbers over several orders of magnitude (Figure 4A), which allowed us to transform RNA-seq data to absolute mRNA copies per cell. We then compared how AldoA transcript abundance corresponded to genome mRNA abundance at different MOIs of Ad-AldoA-infected hepatocytes. The AldoA
contribution ranged from 0.3–0.8% at MOI 2, 6–12% at MOI 20, and >50% of all mRNA at MOI 200 (Figure 4B). In contrast, the largest endogenous contributor to the transcriptome of primary hepatocytes was Transferrin (Trf), which made up only 1.6% of the mRNA (30,000 molecules per cell). Thus the level of AldoA at the MOIs for which derepression was observed (MOIs 20 and 200), was substantially higher than that of transcripts from any single cellular gene.
We also attempted to place the AldoA abundance within the context of the miR-122 site abundance within the hepatocyte transcriptome. A previous estimate of miRNA target-site abundance (TA) considers all of the 7- and 8-nt target-sites for that miRNA within expressed 3′UTRs (Garcia et al., 2011). This TA might over- or under-estimate the effective number of
NIH-PA Author Manuscript
NIH-PA Author Manuscript
binding sites of the transcriptome, depending on the extent to which some of these sites are inaccessible (e.g., because they are occluded by mRNA secondary structure or RNA-binding proteins) and the extent to which intracellular binding capacity is augmented by additional sites (e.g., 6-nt sites, other marginal sites and nonconventional sites, as well as sites in ORFs, 5′UTRs, or non-coding RNAs), many of which might add to the effective number of binding sites without mediating repression. Despite these uncertainties, relative TA estimates for different miRNAs provide a useful basis for distinguishing the more effective miRNAs from the less effective ones (Garcia et al., 2011).
Our conclusion that competing MREs begin to exert their effects as they approach the miRNA-binding capacity of the transcriptome provided the means to evaluate the relationship between the previous TA estimate and the apparent number of binding sites. When calculated as before (summing 7- and 8-nt sites in transcriptome 3′UTRs), the miR-122 TA in hepatocytes at Ad-AldoA MOI 2 was 1.8 × 10⁵ sites per cell, which essentially matched the threshold of added MREs required to begin to observe derepression. Addition of 6-nt sites in the analysis increased the number to 4.4 × 10⁵ miR-122 sites per cell. As this was still below the number of added MREs required to observe half-maximal de-repression, for all further analyses we considered this revised TA estimate (all 6-, 7-, and 8-nt sites within the transcriptome 3′UTRs), which we define as the apparent target-site abundance (or TAapp), as a conservative estimate of the effective number of miRNA sites.
We next calculated how AldoA MREs influenced the miR-122 TAapp (Figure 4C) and what
fraction of the TAapp AldoA MREs contributed (Figure 4D). Because only very highly expressed genes could reach the levels required to affect target-site abundance, we searched for endogenous transcripts that quantitatively contributed the largest percentage to
transcriptome TAapp. Actinb (Actb), which contributed 5.5% of the TAapp, was the largest
potential contributor to miR-122 site abundance in primary hepatocytes (Figure 4E), although this contribution was less than the 30% contribution required for AldoA to detectably modulate miR-122 repression (Figure 4D). When using the same approach to estimate TAapp for let-7, miR-16, miR-33, miR-192, or each of the next four most abundant
miRNA families, the transcript with the largest contribution to any TAapp was Albumin
(Alb), which contributed ~3% of the miR-103 TAapp (Figure 4E).
As a major metabolic integrator of physiological processes, the liver exhibits profound changes of gene regulation in response to insulin signaling and cholesterol metabolism. To examine if these changes might affect miRNA TAapp, we analyzed two models with severe
pathological changes in cholesterol metabolism (LDLR-deficient mice, Ldlr−/−) (Ishibashi et al., 1993) and hepatic steatosis (high-fat diet mice, HFD) (Channon and Wilkinson, 1936) (Figures 4F, S4A, and Table S2). We also examined livers that were perfused in the absence and presence of insulin, representing fasted and fed states, respectively (Figure S4B, and Table S2). In all livers studied, Alb and Transthyretin (Ttr) contributed ~10–20% to TAapp.
The only strong contributor that was differentially regulated in any model was major urinary protein 7 (Mup7), which essentially disappeared in livers of HFD mice, causing its
contribution to TAapp to decrease from 11.6% in normal livers to 0.01% in HFD livers. Alb,
the most highly expressed mRNA and the largest potential contributor of sites for the miR-103 family, had the potential to reduce TAapp by a maximum of only 20% when fully
NIH-PA Author Manuscript
NIH-PA Author Manuscript
silenced. Conversely, a 30% increase in target abundance would require the most abundant liver transcript to increase ~2.5-fold.
Because none of the small number of genes that alone could alter TAapp in a consequential
way appeared to do so, we tested if a substantial change could be achieved through collective changes of all mRNAs. Evaluation of TAapp changes for miR-122, the next ten
most-abundant miRNA families in liver, miR-33, and miR-16 revealed that TAapp values for
these miRNAs were not altered more than 25% in any physiological or disease model, and most changes were below 10% (Figure 4G). We also calculated TAapp values for the liver
samples and primary hepatocytes infected with Ad-AldoA at MOI 20, in which derepression was observed. Transcriptome TAapp values ranged between 2.5–7.5 × 10⁵ sites per cell in
liver models, and between 3.6–13 × 105 in primary hepatocytes (Figure S4C). No ceRNA effect is detected in vivo
To examine the influence of AldoA MREs on target-gene derepression and relevant physiological endpoints in vivo, we injected wildtype mice with 3 × 10⁹ plaque-forming
units (PFU) of Ad-AldoA and examined livers five days post-infection. Virally expressed
GFP, and therefore adenovirus expression, was comparable in all conditions (Figure 5A).
Ad-AldoA increased AldoA transcripts from 2.2 × 10² (endogenous levels) to 4.7 × 10³ copies per cell (Figure 5B), introducing between 2.6 × 10³ and 5.1 × 10³ miR-122 MREs per cell, using Ad-AldoA 1s or 3s, respectively (Figure 5C). Overexpression of the Ad-AldoA constructs did not change levels of miR-122 or a control miRNA (Figure 5D). No
derepression of any miR-122 target or control gene (Snrk and Dyrk2) was observed (Figure 5E). Furthermore, we did not detect changes in serum cholesterol levels (Figure 5F), which decrease upon miR-122 inhibition by Ant-122 (Krutzfeldt et al., 2005). As predicted from our studies of primary hepatocytes, these results showed that introduction of 5.1 × 10³ miR-122 MREs per cell was insufficient to induce either target derepression or downstream physiological responses.
DISCUSSION
Our results support a model in which the changes in ceRNAs must begin to approach the miRNA’s TA before they can exert a consequential effect on the repression of targets for that miRNA. For miR-122 in hepatocytes, derepression began to be observed at a threshold of 1.5 × 10⁵ added sites per cell, a value exceeding the physiological levels of any
endogenous target as well as the aggregate change of all predicted targets in different disease states. Together, our data imply that a ceRNA effect mediated through a single miRNA family in a physiological or disease setting of the liver is unlikely. However, we cannot exclude the possibility that unidentified highly abundant and regulated non-coding RNAs (including circRNAs) might substantially contribute to the pool of transcriptome binding sites.
In stating that changes in endogenous targets are unlikely to mediate a ceRNA effect that is detectable, we do not mean to imply that there is absolutely no molecular consequence of changing the level of an endogenous target. Large changes in each of several dozen target genes could alter TA by 1% or sometimes more, which would influence the repression of
NIH-PA Author Manuscript
NIH-PA Author Manuscript
other targets but not to an extent that would be detectable by our methods. For example, an increase in TA by 5% is expected to decrease repression of other targets by approximately 5%, causing a target that was previously repress by 30% to now be repressed by
approximately 28.5%—a change too small to be detected and presumably too small to be of biological consequence.
Studying the stoichiometric relationship of a miRNA and its TA, and assessing the effect of this relationship on target gene regulation has been challenging. Estimates of TA have proven to be particularly difficult, since the extent to which ineffective or marginally effective binding sites contribute to TA has been unclear, and no experimentally determined TA values had been obtained. Our experiments indicate that the TAapp for miR-122 in the
hepatocyte transcriptome is 4.4 × 10⁵ sites per cell. Although this estimate corresponds to the number of ≥6-nt seed-matched sites for miR-122 in the 3′UTRs, we do not presume that all UTR sites mediate repression. Indeed, the TAapp is expected to exceed the number of
miR-122 MREs, as sites that bind the miRNA too transiently to exert repression (including most sites in ORFs) would nonetheless contribute to TAapp.
We qualify our TA estimate as an “apparent TA” for two reasons: First, our miR-122 TAapp
is expected to be a function of the strength of the miR-122 site that was used in its
determination. The AldoA site is relatively strong (context+ score of −0.4, Figure 4E). Had we empirically estimated the TA using a weaker miR-122 site, more of the added sites would have been required to approach half derepression, and thus the TAapp value would have been correspondingly higher. Second, the endogenous sites contribute to TAapp in proportion to their ability to sequester the miRNA, and thus because many weak sites (ranging from those typically classified as non-specific sites to those that might be more specific yet nonetheless ineffective or marginally effective) each make partial contributions to the TAapp, the actual number of sites that contributed is expected to greatly exceed the TAapp. When considering this second point, estimating a TAapp is of greater practical value than knowing the total number of endogenous sites that helped sequester the miRNA. Our miR-122 TAapp was empirically derived based on the premise that using Ad-AldoA to double the effective miR-122 TA and thereby decrease the number of encounters between miR-122 and its endogenous targets by half would lead to a corresponding decrease in endogenous target repression. If the amount of miR-122-mediated repression is not a simple linear function of the number of encounters with its targets, then TAapp, would need to be corrected accordingly. For other miRNAs, TAapp values were estimated starting with the miR-122 TAapp and assuming that relative values for different miRNAs would scale in proportion to their numbers of UTR sites—an assumption supported by studies showing that miRNA efficacy negatively correlates with the relative numbers of UTR sites (Arvey et al., 2010; Garcia et al., 2011; Mullokandov et al., 2012). Despite any uncertainty arising from these simplifying assumptions, our TAapp estimates have the unique benefit of being founded on intracellular experimental observations.
This experimental grounding produced TAapp values much higher than those previously assumed. For example, previous modeling of the quantitative relationships between
miRNAs and their targets assumed that a typical miRNA had ~500 target sites per cell (Wee
NIH-PA Author Manuscript
NIH-PA Author Manuscript
et al., 2012). Modeling based on this low number of targets suggests that for moderately expressed miRNAs, adding only 500 sites through increased ceRNA expression could double the expression of a repressed mRNA, whereas for more highly expressed miRNAs many more sites would be required to exert an effect (Mullokandov et al., 2012; Wee et al., 2012). Our results in hepatocytes indicate that TAapp values for the eleven most abundant
miRNA families ranged from 2.5 × 10⁵ to 7.5 × 10⁵ sites, about 1000 times greater than the value previously assumed. This substantially revised estimate of effective target-site abundance leads to a different and somewhat simplified picture of the potential for regulation through ceRNAs. In our model, miRNA levels matter only in so much as the miRNA must reach a level sufficient to repress a target mRNA. For any miRNA exceeding this level, the potential for ceRNAs to influence repression is simply a matter of whether the ceRNAs add or subtract enough sites to meaningfully influence the TAapp. Because TAapp is
a function of the number of seed-matched sites in the transcriptome and substantially exceeds the level of even the most highly expressed miRNA, the ceRNA difference required to achieve half-maximal effects is independent of the miRNA level. Thus, our insights and results indicate that repression by even moderately expressed miRNAs would be difficult to detectably change through a ceRNA effect.
Under extreme physiological and disease conditions target abundances were not changed more than 10% for most miRNA families. The maximum change of ~25% was observed for the let-7 miRNA family in mice fed a high-fat versus chow diet. Interestingly, in this condition, a single highly expressed gene (Mup7) accounted for ~50% of the total decrease in let-7 target abundance. A recent phase I trial for RNAi therapy of Transthyretin
amyloidosis reduced human TTR levels by >80% (Coelho et al., 2013). Such a strong reduction of the TTR transcript, which contributes ~10% of the miR-192 TAapp in mouse livers, would account for a decrease in miR-192 target abundance analogous to that observed for Mup7 and let-7 in the high-fat versus chow diet, a change not expected to detectably affect miRNA activity.
The conclusion that only large contributors to TAapp can detectably influence the miRNA
activity agrees with our in vivo experiments; in normal liver, AldoA is expressed at ~2.4 × 10² copies per cell and is among the thousand most highly expressed genes. Still, a 9-fold increase in transcript levels following Ad-AldoA 3s infection, which added ~5 × 10³ MREs, increased miR-122 TAapp by only 2% and therefore imparted no detectable influence on
target gene expression. Mup7 and Ttr are among the thirty genes expressed in liver at copy numbers above 104 copies per cell, and therefore approaching within an order of magnitude the estimated miRNA TAapp values. Hence, only these 30 genes have potential on their own
to perceptibly influence a TAapp.
Our study focused on miR-122, an unusually highly expressed miRNA. Nonetheless, the same high threshold for detectable target derepression was observed when miR-122 activity was reduced, which indicated that our conclusions apply also to more moderately expressed miRNAs. A study reporting loss of miR-20 repression when adding high levels of target mRNA also observed a threshold at high target expression (Mukherji et al., 2011). As expected, their threshold disappeared when a miR-20 sponge was used to lower miRNA activity below detection. More interestingly, they found that transfecting a miR-20 mimic
NIH-PA Author Manuscript
NIH-PA Author Manuscript
increased the threshold for derepression. A possible reason that they observed a change in threshold with a change in miRNA, whereas we did not, is that their miR-20 mimic might have added enough miRNA to exceed the miR-20 TAapp of their cells. Another difference
between their experiments and ours is that their target contained bulged sites of a type that can induce miRNA degradation (Ameres et al., 2010), which might produce an apparent shift in the threshold.
Gene expression in the liver is profoundly regulated by circadian, hormonal and nutritional states. Using livers of mice exposed to insulin signaling and to pathological conditions of cholesterol metabolism, we did not observe large changes in target abundance, raising the possibility that our findings can be generalized to other organs and disease states. Nonetheless, during cell differentiation and in the context of malignant transformation, expression of coding and non-coding RNA can change dramatically (Rhodes and
Chinnaiyan, 2005; Lujambio and Lowe, 2012). In such biological settings conditions might arise in which TAapp is lower than in physiological settings and/or a single mRNA
substantially contributes to target abundance. In principle, such alterations could make the system more amenable to ceRNA-mediated gene regulation.
EXPERIMENTAL PROCEDURES
Animal ExperimentsAnimals were maintained on a 12-hour light/dark cycle under a controlled environment in a pathogen-free facility at the Institute for Molecular Systems Biology, ETH Zürich
(Switzerland). Mice were administered adenovirus through a single tail-vein injection of 3 × 10⁹ plaque-forming units in a final volume of 0.2 ml diluted in PBS and killed 5 days post injection. Antagomir was administered through tail-vein injections on three consecutive days, and primary hepatocytes were isolated on day four. For high, intermediate and low miR-122 inhibition mice received 3 × 80 mg/kg, 40 mg/kg and 20 mg/kg Antagomir-122, respectively. Antagomir-122mm (control) was used at the highest concentration. All animal experiments were approved by the ethics committee of the Kantonale Veterinäramt Zürich. Primary Hepatocytes Isolation and Viral Infections
Primary hepatocytes of 8- to 12-week-old male C57BL/6N mice were isolated based on the method described by Zhang et al. (Zhang et al., 2012). Hepatocytes were counted and plated at 300,000 cells/well in DMEM low glucose media, adenoviruses added in Hepatozyme media 4–6 hours after plating and harvested 24 hours post infection. All cells were incubated at 37°C in a humidified atmosphere containing 5% CO2.
Adenoviruses
Recombinant Adenoviruses were generated as described in the extended experimental procedures. All Adenoviruses expressed GFP from an independent promoter. Ad-Ctrl was based on the same vector backbone (including GFP) but lacked the AldoA transgene.
NIH-PA Author Manuscript
NIH-PA Author Manuscript
Gene Expression Analysis
2 ug of total RNA was treated with the DNA-free Kit (Life Technologies) and reverse-transcribed using the High Capacity cDNA Reverse Transcription Kit (Life Technologies). Quantitative PCR reactions were performed with the Light Cycler 480 (Roche) employing KAPA SYBR Fast qPCR Master Mix (2x) for LightCycler 480 (Kapa Biosystems) and gene-specific primer pairs (Table S3). Relative gene expression was calculated using the ddCT method and mouse 36b4 (Rplp0) for normalization.
miRNA Expression Analysis
150 ng of total RNA was reverse-transcribed using the TaqMan MicroRNA Assays and Reverse Transcription Kits (Life Technologies). Quantitative PCR reactions were performed with the Light Cycler 480 (Roche) employing TaqMan Universal PCR Master Mix, No AmpErase UNG (Life Technologies) and TaqMan MicroRNA Assays (Life Technologies). Relative miRNA expression was calculated using the ddCT method and mouse snoRNA202 for normalization.
RNA-seq
For single-end library construction: Total RNA was depleted of rRNA using the Ribo-Zero rRNA Removal Kit (Epicentre). RNA libraries were prepared using the dUTP-based, Illumina-compatible NEXTflex Directional RN-Seq Kit (Bioo Scientific). For paired-end library construction (performed by BGI), total RNA was enriched for poly(A) mRNA with oligo(dT) beads and treated with buffer to yield 200–700 nt fragments. First-strand cDNA was synthesized using random hexamer primers; second-strand cDNA was synthesized using buffer, dNTPs, RNase H, and DNA polymerase I. cDNA was run on an Agarose gel for suitable fragment size selection, followed by a purification, adaptor ligation, and PCR amplification. All libraries (both single-end and paired-end) were sequenced using an Illumina HiSeq 2000 sequencing machine.
Supplementary Material
Refer to Web version on PubMed Central for supplementary material.
Acknowledgments
We would like to thank Meenakshi Ravichandran and Wendy Johnston for technical assistance as well as D. Koppstein, V. Auyeung, M. Latreille, and members of the Bartel and Stoffel labs for critically reviewing this manuscript. This material is based upon work supported under a National Science Foundation Graduate Research Fellowship (VA), an ERC grant ‘Metabolomirs’ and NCCR ‘RNA and Biology’ (MS), and NIH grant GM067031 (DPB). DPB is a Howard Hughes Medical Institute Investigator.
References
Ala U, Karreth FA, Bosia C, Pagnani A, Taulli R, Leopold V, Tay Y, Provero P, Zecchina R, Pandolfi PP. Integrated transcriptional and competitive endogenous RNA networks are cross-regulated in permissive molecular environments. Proc Natl Acad Sci U S A. 2013; 110:7154–7159. [PubMed: 23536298]
NIH-PA Author Manuscript
NIH-PA Author Manuscript
Ameres SL, Horwich MD, Hung JH, Xu J, Ghildiyal M, Weng Z, Zamore PD. Target RNA-directed trimming and tailing of small silencing RNAs. Science. 2010; 328:1534–1539. [PubMed: 20558712]
Arvey A, Larsson E, Sander C, Leslie CS, Marks DS. Target mRNA abundance dilutes microRNA and siRNA activity. Molecular systems biology. 2010; 6:363. [PubMed: 20404830]
Baek D, Villen J, Shin C, Camargo FD, Gygi SP, Bartel DP. The impact of microRNAs on protein output. Nature. 2008; 455:64–71. [PubMed: 18668037]
Bissels U, Wild S, Tomiuk S, Holste A, Hafner M, Tuschl T, Bosio A. Absolute quantification of microRNAs by using a universal reference. Rna. 2009; 15:2375–2384. [PubMed: 19861428] Brenner JL, Jasiewicz KL, Fahley AF, Kemp BJ, Abbott AL. Loss of individual microRNAs causes
mutant phenotypes in sensitized genetic backgrounds in C. elegans. Curr Biol. 2010; 20:1321–1325. [PubMed: 20579881]
Cesana M, Cacchiarelli D, Legnini I, Santini T, Sthandier O, Chinappi M, Tramontano A, Bozzoni I. A long noncoding RNA controls muscle differentiation by functioning as a competing endogenous RNA. Cell. 2011; 147:358–369. [PubMed: 22000014]
Channon HJ, Wilkinson H. The effect of various fats in the production of dietary fatty livers. Biochem J. 1936; 30:1033–1039. [PubMed: 16746115]
Coelho T, Adams D, Silva A, Lozeron P, Hawkins PN, Mant T, Perez J, Chiesa J, Warrington S, Tranter E, et al. Safety and efficacy of RNAi therapy for transthyretin amyloidosis. The New England journal of medicine. 2013; 369:819–829. [PubMed: 23984729]
Ebert MS, Neilson JR, Sharp PA. MicroRNA sponges: competitive inhibitors of small RNAs in mammalian cells. Nat Methods. 2007; 4:721–726. [PubMed: 17694064]
Esau C, Davis S, Murray SF, Yu XX, Pandey SK, Pear M, Watts L, Booten SL, Graham M, McKay R, et al. miR-122 regulation of lipid metabolism revealed by in vivo antisense targeting. Cell Metab. 2006; 3:87–98. [PubMed: 16459310]
Eulalio A, Huntzinger E, Izaurralde E. Getting to the root of miRNA-mediated gene silencing. Cell. 2008; 132:9–14. [PubMed: 18191211]
Fang L, Du WW, Yang X, Chen K, Ghanekar A, Levy G, Yang W, Yee AJ, Lu WY, Xuan JW, et al. Versican 3′-untranslated region (3′-UTR) functions as a ceRNA in inducing the development of hepatocellular carcinoma by regulating miRNA activity. Faseb J. 2013; 27:907–919. [PubMed: 23180826]
Farh KK, Grimson A, Jan C, Lewis BP, Johnston WK, Lim LP, Burge CB, Bartel DP. The widespread impact of mammalian microRNAs on mRNA repression and evolution. Science. 2005; 310:1817– 1821. [PubMed: 16308420]
Figliuzzi M, Marinari E, De Martino A. MicroRNAs as a selective channel of communication between competing RNAs: a steady-state theory. Biophys J. 2013; 104:1203–1213. [PubMed: 23473503] Franco-Zorrilla JM, Valli A, Todesco M, Mateos I, Puga MI, Rubio-Somoza I, Leyva A, Weigel D,
Garcia JA, Paz-Ares J. Target mimicry provides a new mechanism for regulation of microRNA activity. Nat Genet. 2007; 39:1033–1037. [PubMed: 17643101]
Friedman RC, Farh KKH, Burge CB, Bartel DP. Most mammalian mRNAs are conserved targets of microRNAs. Genome Res. 2009; 19:92–105. [PubMed: 18955434]
Garcia DM, Baek D, Shin C, Bell GW, Grimson A, Bartel DP. Weak seed-pairing stability and high target-site abundance decrease the proficiency of lsy-6 and other microRNAs. Nat Struct Mol Biol. 2011; 18:1139–1146. [PubMed: 21909094]
Giraldez AJ, Mishima Y, Rihel J, Grocock RJ, Van Dongen S, Inoue K, Enright AJ, Schier AF. Zebrafish miR-430 promotes deadenylation and clearance of maternal mRNAs. Science. 2006; 312:75–79. [PubMed: 16484454]
Grimson A, Farh KK, Johnston WK, Garrett-Engele P, Lim LP, Bartel DP. MicroRNA targeting specificity in mammals: determinants beyond seed pairing. Mol Cell. 2007; 27:91–105. [PubMed: 17612493]
Guo H, Ingolia NT, Weissman JS, Bartel DP. Mammalian microRNAs predominantly act to decrease target mRNA levels. Nature. 2010; 466:835–840. [PubMed: 20703300]
NIH-PA Author Manuscript
NIH-PA Author Manuscript
Hafner M, Landthaler M, Burger L, Khorshid M, Hausser J, Berninger P, Rothballer A, Ascano M Jr, Jungkamp AC, Munschauer M, et al. Transcriptome-wide identification of RNA-binding protein and microRNA target sites by PAR-CLIP. Cell. 2010; 141:129–141. [PubMed: 20371350] Hansen TB, Jensen TI, Clausen BH, Bramsen JB, Finsen B, Damgaard CK, Kjems J. Natural RNA
circles function as efficient microRNA sponges. Nature. 2013; 495:384–388. [PubMed: 23446346] Ishibashi S, Brown MS, Goldstein JL, Gerard RD, Hammer RE, Herz J. Hypercholesterolemia in low
density lipoprotein receptor knockout mice and its reversal by adenovirus-mediated gene delivery. J Clin Invest. 1993; 92:883–893. [PubMed: 8349823]
Jeyapalan Z, Deng Z, Shatseva T, Fang L, He C, Yang BB. Expression of CD44 3′-untranslated region regulates endogenous microRNA functions in tumorigenesis and angiogenesis. Nucleic Acids Res. 2011; 39:3026–3041. [PubMed: 21149267]
Jopling CL, Yi M, Lancaster AM, Lemon SM, Sarnow P. Modulation of hepatitis C virus RNA abundance by a liver-specific microRNA. Science. 2005; 309:1577–1581. [PubMed: 16141076] Karreth FA, Tay Y, Perna D, Ala U, Tan SM, Rust AG, DeNicola G, Webster KA, Weiss D,
Perez-Mancera PA, et al. In vivo identification of tumor- suppressive PTEN ceRNAs in an oncogenic BRAF-induced mouse model of melanoma. Cell. 2011; 147:382–395. [PubMed: 22000016] Krutzfeldt J, Rajewsky N, Braich R, Rajeev KG, Tuschl T, Manoharan M, Stoffel M. Silencing of
microRNAs in vivo with ‘antagomirs’. Nature. 2005; 438:685–689. [PubMed: 16258535] Landgraf P, Rusu M, Sheridan R, Sewer A, Iovino N, Aravin A, Pfeffer S, Rice A, Kamphorst AO,
Landthaler M, et al. A mammalian microRNA expression atlas based on small RNA library sequencing. Cell. 2007; 129:1401–1414. [PubMed: 17604727]
Lewis BP, Burge CB, Bartel DP. Conserved seed pairing, often flanked by adenosines, indicates that thousands of human genes are microRNA targets. Cell. 2005; 120:15–20. [PubMed: 15652477] Li X, Cassidy JJ, Reinke CA, Fischboeck S, Carthew RW. A microRNA imparts robustness against environmental fluctuation during development. Cell. 2009; 137:273–282. [PubMed: 19379693] Lujambio A, Lowe SW. The microcosmos of cancer. Nature. 2012; 482:347–355. [PubMed:
22337054]
Memczak S, Jens M, Elefsinioti A, Torti F, Krueger J, Rybak A, Maier L, Mackowiak SD, Gregersen LH, Munschauer M, et al. Circular RNAs are a large class of animal RNAs with regulatory potency. Nature. 2013; 495:333–338. [PubMed: 23446348]
Mendell JT, Olson EN. MicroRNAs in stress signaling and human disease. Cell. 2012; 148:1172– 1187. [PubMed: 22424228]
Mukherji S, Ebert MS, Zheng GX, Tsang JS, Sharp PA, van Oudenaarden A. MicroRNAs can generate thresholds in target gene expression. Nat Genet. 2011; 43:854–859. [PubMed: 21857679] Mullokandov G, Baccarini A, Ruzo A, Jayaprakash AD, Tung N, Israelow B, Evans MJ,
Sachidanandam R, Brown BD. High-throughput assessment of microRNA activity and function using microRNA sensor and decoy libraries. Nat Methods. 2012; 9:840–846. [PubMed: 22751203] Pillai RS, Bhattacharyya SN, Artus CG, Zoller T, Cougot N, Basyuk E, Bertrand E, Filipowicz W.
Inhibition of translational initiation by Let-7 microRNA in human cells. Science. 2005; 309:1573– 1576. [PubMed: 16081698]
Poliseno L, Salmena L, Zhang J, Carver B, Haveman WJ, Pandolfi PP. A coding-independent function of gene and pseudogene mRNAs regulates tumour biology. Nature. 2010; 465:1033–1038. [PubMed: 20577206]
Rhodes DR, Chinnaiyan AM. Integrative analysis of the cancer transcriptome. Nat Genet. 2005; 37(Suppl):S31–37. [PubMed: 15920528]
Salmena L, Poliseno L, Tay Y, Kats L, Pandolfi PP. A ceRNA hypothesis: the Rosetta Stone of a hidden RNA language? Cell. 2011; 146:353–358. [PubMed: 21802130]
Seitz H. Redefining microRNA targets. Curr Biol. 2009; 19:870–873. [PubMed: 19375315]
Tay Y, Kats L, Salmena L, Weiss D, Tan SM, Ala U, Karreth F, Poliseno L, Provero P, Di Cunto F, et al. Coding-independent regulation of the tumor suppressor PTEN by competing endogenous mRNAs. Cell. 2011; 147:344–357. [PubMed: 22000013]
Tsai WC, Hsu PW, Lai TC, Chau GY, Lin CW, Chen CM, Lin CD, Liao YL, Wang JL, Chau YP, et al. MicroRNA-122, a tumor suppressor microRNA that regulates intrahepatic metastasis of hepatocellular carcinoma. Hepatology. 2009; 49:1571–1582. [PubMed: 19296470]
NIH-PA Author Manuscript
NIH-PA Author Manuscript
Wee LM, Flores-Jasso CF, Salomon WE, Zamore PD. Argonaute divides its RNA guide into domains with distinct functions and RNA-binding properties. Cell. 2012; 151:1055–1067. [PubMed: 23178124]
Zhang W, Sargis RM, Volden PA, Carmean CM, Sun XJ, Brady MJ. PCB 126 and other dioxin-like PCBs specifically suppress hepatic PEPCK expression via the aryl hydrocarbon receptor. PLoS One. 2012; 7:e37103. [PubMed: 22615911]
NIH-PA Author Manuscript
NIH-PA Author Manuscript
HIGHLIGHTS
• Target repression is released only after adding many competing target sites • The number of added sites required for derepression is independent of miRNA
levels
• The apparent abundance of intracellular target sites exceeds that of the miRNAs • Changes in ceRNAs are typically too small to influence miRNA-mediated
repression
NIH-PA Author Manuscript
NIH-PA Author Manuscript
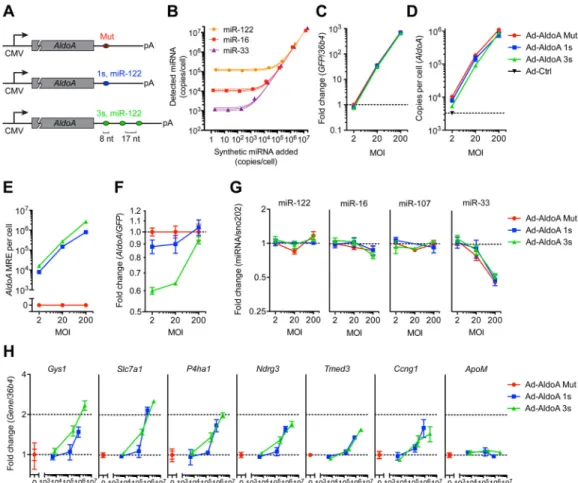
Figure 1. miRNA target derepression is detected at a high threshold of added MREs (A) Schematic overview of the different AldoA-expressing adenovirus constructs (Ad-AldoA) harboring either one (1s, blue) or three (3s, green) miR-122 binding sites, or a mutated site (Mut, red). Ad-AldoA 3s contained three 8-nt seed matches of miR-122 separated by 17-nt spacers. See also Figure S1.
(B) Absolute miRNA quantification of primary hepatocyte cell lysates spiked with different amounts of synthetic miRNA. Solid lines represent linear regression data with respective 95% confidence intervals.
(C H) Primary hepatocytes infected with different multiplicities of infection (MOI) of the Ad-AldoA constructs. Relative gene expression of GFP (C) and AldoA (F), absolute copy numbers per cell of AldoA (D) and AldoA MRE (E). Relative expression of miRNAs (G), or miR-122 target genes and a control non-target gene (ApoM) (H). See also Figure S2.
GFP and miRNA expression are relative to Ad-AldoA Mut at MOI 2; AldoA, miR-122
target genes and the control gene are relative to the respective Ad-AldoA Mut at given MOI. Data represent mean ± SEM (n = 3) for all panels.
NIH-PA Author Manuscript
NIH-PA Author Manuscript
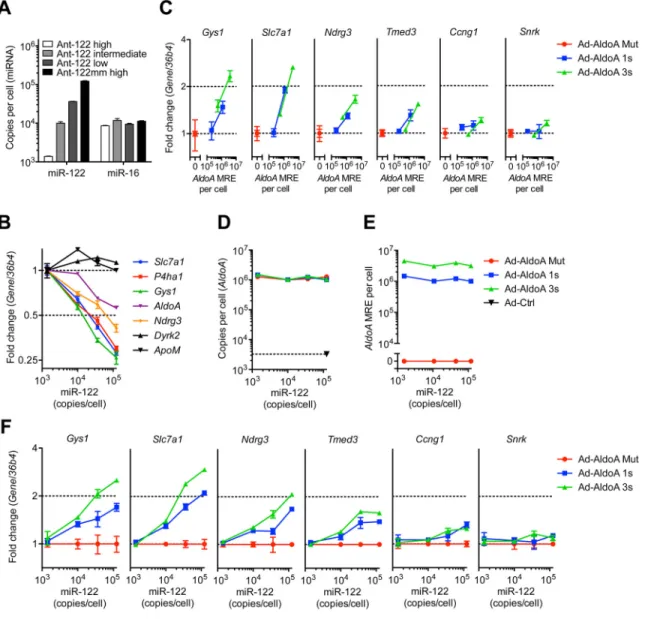
Figure 2. The high threshold persists after lowering miR-122 activity
(A) Absolute miRNA copy numbers per cell, or (B) relative expression of miR-122 target genes and control non-target genes (Dyrk2 and ApoM) in primary hepatocytes from mice treated with Ant-122mm or different concentrations of Ant-122. Values for miR-122 target and control genes are normalized to that of the lowest miR-122 concentration.
(C) Relative expression of miR-122 target genes and a non-target gene (Snrk) in primary hepatocytes with 3-fold decreased miR-122 levels shown in (A), infected with MOI 20 and 200 of Ad-AldoA Mut (red), 1s (blue) or 3s (green).
(D–F) Primary hepatocytes shown in (A) infected with MOI 200 of the three Ad-AldoA constructs. Absolute copy numbers per cell of AldoA (D) and AldoA MRE (E) in relation to miR-122 copy numbers.
(F) Relative expression of miR-122 target genes and control non-target gene (Snrk), normalized to Ad-AldoA Mut of the respective miR-122 condition.
NIH-PA Author Manuscript
NIH-PA Author Manuscript
Absolute miRNA copy numbers were calculated by multiplying relative abundance
(miRNA/snoRNA202) that were normalized to Ant-122mm with the copy number evaluated in Figure 1B. Data represent mean ± SEM (n = 4) for all panels.
NIH-PA Author Manuscript
NIH-PA Author Manuscript
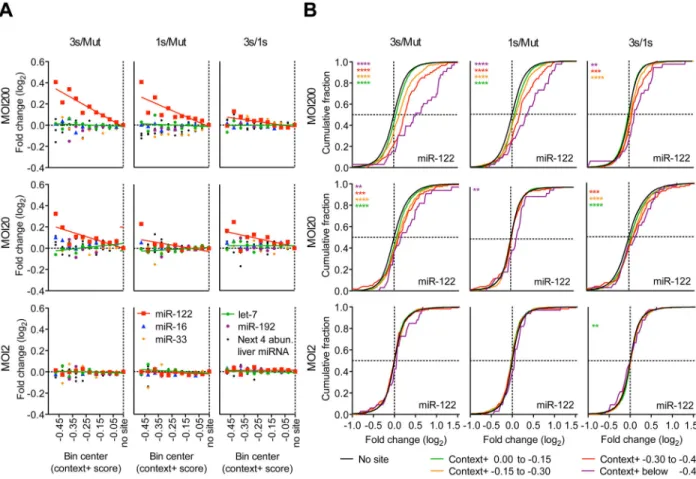
Figure 3. The magnitude of derepression correlates with predicted site efficacy and number of added AldoA MREs
(A–B) RNA-seq results showing derepression of predicted targets from primary hepatocytes infected with MOI 200, 20, and 2 of Ad-AldoA Mut, 1s, or 3s shown in Figure 1C–H. (A) Predicted targets of miR-122 (red), miR-16 (blue), miR-33 (orange), let-7 (green), miR-192 (purple), or a combination of the next four most abundant liver miRNA families (black) were grouped into ten bins based on their context+ scores. For each miRNA family, the median log2-fold change is plotted for the predicted targets in each bin. Medians were
normalized to that of the bin with genes without sites. Bins each had at least 10 genes; see Figure S3B for group sizes. (B) Cumulative distributions of mRNA changes for genes with no miR-122 site (black) or predicted target genes with the indicated context+ score bins (color). Number of genes per bin: black, 6629; green, 1693; orange, 434; red, 120; purple, 33. *P < 0.05, **P < 0.01, ***P < 0.001, ****, P < 0.0001, one-sided Kolmogorov–Smirnov (K–S) test. See also Figure S3 and Table S1.
NIH-PA Author Manuscript
NIH-PA Author Manuscript
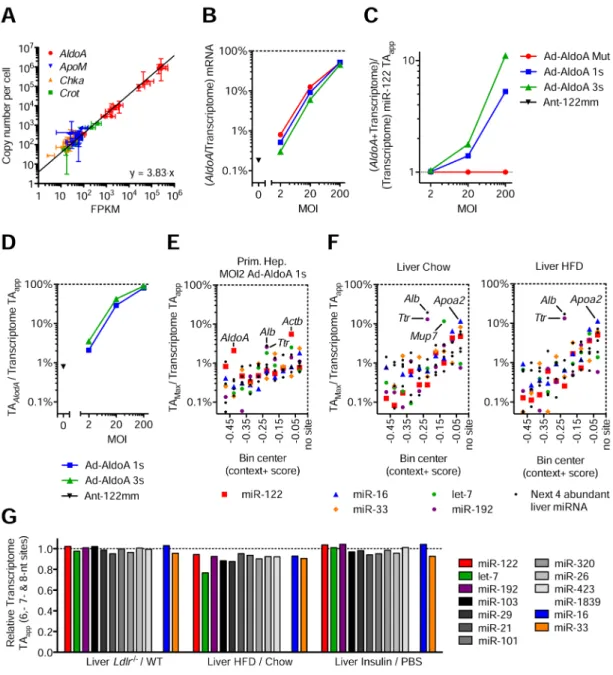
Figure 4. Modest changes in target abundance are induced by metabolic stress and disease (A) Relationship between FPKM from RNA-seq data and absolute quantification using qPCR. Represented are four genes quantified in all 11 primary hepatocyte samples, plus wildtype and Ldlr−/−liver samples. Line represents linear regression of data points. Data represent mean ± 95% confidence intervals.
(B–D) RNA-seq data from primary hepatocytes infected with MOI 200, 20, and 2 of Ad-AldoA Mut, 1s, or 3s shown in Figure 1C–H. Data represent mean ± SEM. (B) Contribution of AldoA mRNA to the sum of genome mRNA. (C) Increase of transcriptome miR-122 TAapp (D) and the respective contribution of AldoA MRE to total transcriptome miR-122
TAapp mediated by the different Ad-AldoA constructs and viral concentrations.
(E–F) Fractional contribution of the largest potential contributors to transcriptome TAapp in
primary hepatocytes infected with MOI 2 of Ad-AldoA 1s (E) or in wildtype livers (F)
NIH-PA Author Manuscript
NIH-PA Author Manuscript
originated from mice either fed normal chow or high-fat diet (HFD). Potential contributors were binned by their context+ score, and the top potential contributors are plotted within each bin. See also Figure S4 and Table S2.
(G) Relative target abundance of livers from models of physiological (Insulin) or disease/ stress states (Ldlr−/−and HFD).
NIH-PA Author Manuscript
NIH-PA Author Manuscript
Figure 5. No ceRNA effect is detected in vivo
(A E) Mice were injected with Ad-AldoA Mut (red, n = 6), 1s (blue, n = 6), or 3s (green, n = 5) and gene expression analysis was performed 5 days post infection. Relative gene
expression of GFP (A), absolute copy numbers per cell of AldoA (B), and added AldoA MREs (C). Relative expression of miRNAs (D) and miR-122 target genes or control non-target genes (Snrk and Dyrk2) (E).
(F) Plasma cholesterol levels of Ad-AldoA-treated mice at day 1, 3, and 5. The Ad-AldoA used in this experiment expressed the full-length protein. Data represent mean ± SEM.