Publisher’s version / Version de l'éditeur:
Cement and Concrete Composites, 32, 5, pp. 339-350, 2010-05-01
READ THESE TERMS AND CONDITIONS CAREFULLY BEFORE USING THIS WEBSITE.
https://nrc-publications.canada.ca/eng/copyright
Vous avez des questions? Nous pouvons vous aider. Pour communiquer directement avec un auteur, consultez la
première page de la revue dans laquelle son article a été publié afin de trouver ses coordonnées. Si vous n’arrivez pas à les repérer, communiquez avec nous à PublicationsArchive-ArchivesPublications@nrc-cnrc.gc.ca.
Questions? Contact the NRC Publications Archive team at
PublicationsArchive-ArchivesPublications@nrc-cnrc.gc.ca. If you wish to email the authors directly, please see the first page of the publication for their contact information.
NRC Publications Archive
Archives des publications du CNRC
This publication could be one of several versions: author’s original, accepted manuscript or the publisher’s version. / La version de cette publication peut être l’une des suivantes : la version prépublication de l’auteur, la version acceptée du manuscrit ou la version de l’éditeur.
For the publisher’s version, please access the DOI link below./ Pour consulter la version de l’éditeur, utilisez le lien DOI ci-dessous.
https://doi.org/10.1016/j.cemconcomp.2010.02.007
Access and use of this website and the material on it are subject to the Terms and Conditions set forth at Benefits of internal curing on service life and life-cycle cost of high-performance concrete bridge decks - a case study
Cusson, D.; Lounis, Z.; Daigle, L.
https://publications-cnrc.canada.ca/fra/droits
L’accès à ce site Web et l’utilisation de son contenu sont assujettis aux conditions présentées dans le site LISEZ CES CONDITIONS ATTENTIVEMENT AVANT D’UTILISER CE SITE WEB.
NRC Publications Record / Notice d'Archives des publications de CNRC: https://nrc-publications.canada.ca/eng/view/object/?id=541f7637-f1bf-425d-ba63-16b35a30ac1b https://publications-cnrc.canada.ca/fra/voir/objet/?id=541f7637-f1bf-425d-ba63-16b35a30ac1b
http://www.nrc-cnrc.gc.ca/irc
Be ne fit s of int e rna l c uring on se rvic e life a nd life -c yc le c ost of high-pe rform a nc e c onc re t e bridge de c k s - a c a se st udy
N R C C - 5 2 6 6 1
C u s s o n , D . ; L o u n i s , Z . ; D a i g l e , L .
J u l y 2 0 1 0
A version of this document is published in / Une version de ce document se trouve dans: Cement and Concrete Composites, 32, (5), pp. 339-350, May 1, 2010, DOI: 10.1016/j.cemconcomp.2010.02.007
The material in this document is covered by the provisions of the Copyright Act, by Canadian laws, policies, regulations and international agreements. Such provisions serve to identify the information source and, in specific instances, to prohibit reproduction of materials without written permission. For more information visit http://laws.justice.gc.ca/en/showtdm/cs/C-42
Les renseignements dans ce document sont protégés par la Loi sur le droit d'auteur, par les lois, les politiques et les règlements du Canada et des accords internationaux. Ces dispositions permettent d'identifier la source de l'information et, dans certains cas, d'interdire la copie de documents sans permission écrite. Pour obtenir de plus amples renseignements : http://lois.justice.gc.ca/fr/showtdm/cs/C-42
Benefits of internal curing on service life and life-cycle cost of
high-performance concrete bridge decks – A case study
D. Cusson1; Z. Lounis; L. Daigle
National Research Council Canada, Institute for Research in Construction, Ottawa, Ontario, Canada, K1A 0R6
Abstract
This paper investigates the impact of internal curing on the service life of high-performance concrete (HPC) bridge decks by using analytical models to predict the times to onset of corrosion, onset of corrosion-induced damage, and failure of decks. Three bridge deck design options were compared: (i) normal concrete deck; (ii) HPC deck with supplementary cementing materials (SCM); and (iii) HPC deck with SCM and internal curing. It was found that the use of internal curing can extend the service life of high-performance concrete bridge decks by more than twenty years, which is mainly due to a significant reduction in the rate of penetration of chlorides in concrete as a result of reduced early-age shrinkage cracking and reduced chloride diffusion. Compared to normal concrete, HPC with SCM and internal curing was predicted to add more than 40 years to the service life of bridge decks in severe environmental conditions. Life-cycle cost reductions of 40% and 63% were estimated when conventional HPC and internally-cured HPC were used in bridge decks instead of normal concrete, respectively, despite the fact that the in-place unit cost of internally-cured HPC can be 4% higher than that of conventionally-cured HPC, which in turn can be up to 33% higher than that of normal concrete. This is due to a longer service life and less frequent maintenance activities offered by low-permeability HPC bridge decks.
Keywords: internal curing; high-performance concrete; bridge deck; service life; life-cycle cost
1 Introduction
Proper curing of concrete structures is important to ensure that they meet their design life requirements and yield low maintenance costs. The selection of a cost-effective design or rehabilitation alternative for a concrete structure requires a reliable estimate of the total cost that will be incurred throughout its life cycle. The evaluation of the life-cycle cost requires a reliable prediction of the service life of the structure for all feasible and competing design and rehabilitation alternatives.
In low permeability concrete, conventional external curing may not be effective in preventing self-desiccation at the centre of thick concrete elements. Internal curing (IC) is a technique that can be used to provide additional moisture inside the concrete for a more effective cement hydration and reduced self-desiccation (RILEM TC-196, 2007). For that purpose, saturated porous lightweight aggregate (LWA) can be mixed into concrete in order to supply an internal source of water, which can replace the mix water consumed by chemical shrinkage during cement hydration (Weber & Reinhardt 1997). As a result, autogenous shrinkage of high-performance concrete (HPC) can be eliminated (Durán-Herrera et al. 2007, Cusson & Hoogeveen 2008).
1
Internal curing with LWA has been successfully used recently in large construction projects of normal density concrete structures. For example, in January 2005, about 190 000 m3 of internally-cured concrete was used in a large paving project in Hutchins, Texas (Villarreal & Crocker 2007). Field observations reported marginal pavement cracking, and tests indicated that 7-day flexural strengths reached 90% to 100% of the required 28-day flexural strength due to an improved cement hydration. They also found that the compressive strengths of air-cured cylinders were similar to those of wet-air-cured cylinders at all ages, suggesting that concrete with internal curing is less sensitive to poor external curing practices or unfavourable ambient conditions.
Although the benefits of internal curing for high-performance concrete structures have been evidenced in the laboratory and some field investigations (such as those previously mentioned), the literature does not provide any significant quantitative information regarding the additional extension of the service life that can be achieved by the use of internal curing in concrete structures. The objectives of this paper are twofold: (i) to present mechanistic models for the service life of concrete structures built in chloride-laden environments that take into account the impact of shrinkage-induced cracks; and (ii) to provide reasonable estimates of the impact of internal curing on the service life and life-cycle cost of typical concrete bridge decks made with and without internally-cured HPC.
2 Effect of internal curing on early-age performance of HPC
2.1 Internal curing water requirement for elimination of self-desiccation
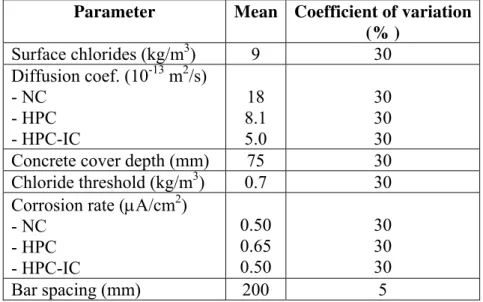
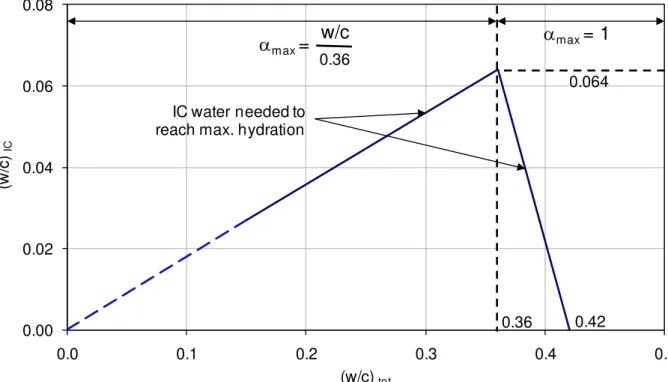
Based on the pioneering work of Powers (1948) on chemical shrinkage of cement pastes, Figure 1 was proposed by Jensen & Hansen (2001) to estimate the amount of internal curing water required in concrete to prevent self-desiccation and the resulting autogenous deformation. The two solid lines represent the minimum quantity of internal curing water required to reach the maximum degree of hydration, which can be 1.0 (i.e. 100%) for water-cement ratios (w/c) above 0.36. Below this value, water-cement hydration can only be partially achieved, and the maximum achievable degree of hydration can be estimated as (w/c)/0.36. Figure 1 also indicates that fully saturated conditions of hydrating cement pastes can be achieved with a quantity of internal curing water of 0.064 kg per kg of cement. The latter value does in fact correspond to the chemical shrinkage typically measured on ordinary Portland cement paste. When using cements with different values of chemical shrinkage, the IC water requirement may vary accordingly. For example, chemical shrinkage of silica fume is typically 0.22 L/kg. Consequently, a blended cement containing 10% silica fume and 90% ordinary Portland cement may experience a chemical shrinkage of 0.08 L/kg.
Knowing the degree of saturation and absorption capacity of the LWA, one can estimate the required mass of LWA to include in concrete in order to provide adequate internal curing. Zhutovsky et al. (2004) and Bentz et al. (2005) suggested similar forms of this equation:
LWA LWA c LWA S CS M M φ α ⋅ ⋅ ⋅ = max with 1 36 . 0 / max = ≤ c w α (1)
where MLWA is the dry mass of LWA per unit volume of concrete (kg/m3); Mc is the mass of
cement in concrete (kg/m3); CS is the chemical shrinkage (kg of water per kg of cement); αmax
is the maximum expected degree of hydration; SLWA is the saturation degree of LWA; φLWA is
water-cement ratio of concrete. For optimum performance, the LWA carrying the internal curing water should possess a high water absorption capacity and high sorption and desorption rates. Its particle size distribution and stiffness should be similar to those of the substituted normal density aggregate (Bentz et al., 2005). If the lightweight aggregate replacement ratio is rather small, these last two requirements may be neglected.
2.2 Effect of internal curing on net shrinkage and strength at early ages
A great concern for design engineers and contractors is whether the concrete will achieve the specified compressive strength and all durability requirements in the structure during service. Cusson & Hoogeveen (2008) demonstrated that internal curing can reduce autogenous shrinkage considerably without affecting the strength and stiffness of high-performance concrete. This was achieved by reducing the amount of mix water in the concrete by an amount equal to that used in the LWA for internal curing, thus reducing the effective water-cement ratio (w/ceff) of the concrete when using higher quantities of pre-soaked LWA. The
reference concrete had a 0.34 water-cement ratio, a cement-sand-coarse aggregate ratio of 1:2:2, and a cement content of 450 kg/m3. Three similar concretes were made with 3 different amounts of LWA sand: 6%, 12% and 20% of the total sand content, for which normal sand was partly replaced with pre-soaked LWA sand (expanded shale) for internal curing. The HPC test specimens had a size of 200 x 200 x 1000 mm, were kept at room temperature and sealed to prevent drying. Figure 2 presents the net shrinkage strain values (defined as the difference between the initial peak expansion strain and the most significant shrinkage strain measured in 7 days) and the 7-day compressive strengths (f’c 7d) obtained for the four concrete
mixes as a function of the sand replacement ratio. It can be seen that an increase in the amount of LWA sand used for internal curing resulted in a considerable reduction in the net autogenous shrinkage strain, where a sand replacement ratio of 22% could be regarded as one that can totally eliminate the net autogenous shrinkage and the resulting tensile stress for this concrete mixture. Figure 2 also shows that an increase in the amount of pre-soaked LWA sand resulted in a small increase in compressive strength, for the quantities of LWA tested in this study (under 180 kg/m3 of dry mass, before saturation). These findings agree very well with those found by Durán-Herrera et al. (2007).
2.3 Effect of internal curing on deformation and stress development
Internal curing of concrete provided by means of pre-saturated structural-grade LWA can significantly enhance the early-age behaviour of concrete structures in terms of shrinkage and creep deformations, and tensile stresses, thus resulting in lower risks of cracking and longer service life. Figure 3 presents the total strains measured in the four unrestrained and sealed large-size specimens tested by Cusson & Hoogeveen (2008). The total strain included autogenous shrinkage and thermal strains only, as the specimens were sealed to prevent external drying shrinkage. It can be readily seen that the addition of pre-soaked LWA for internal curing allowed early-age expansion to occur, which was due to swelling and thermal expansion, with peaks observed between 8 hours and 12 hours of age. The extent of expansion increased with the quantity of pre-soaked LWA used in the concrete mix. Mix-20% (i.e. Mix-20% sand replacement ratio) was the only concrete producing positive values of total strain after the first day until the end of testing.
While the mechanisms of internal curing contributing to a reduction in autogenous shrinkage are relatively well known (RILEM TC-196, 2007), the mechanisms leading to an early-age expansion are not fully understood. Current shrinkage prediction models (ACI 209, 1992;
CEB 1993) do not consider the possibility of early-age expansion in concrete. This expansion may be related to ettringite formation and/or swelling of the gel hydration products, as it has been hypothesized in previous studies (Bentz et al. 2001, 2008). It appears that there may be a competition between the development of expansion and that of autogenous shrinkage. As shown in Figure 3, the expansion clearly dominated autogenous shrinkage in the internally-cured HPC specimens at very early ages (<12 hours), since early-age shrinkage had been significantly reduced by internal curing. After the expansion peak, however, autogenous shrinkage developed faster than autogenous expansion in all mixes.
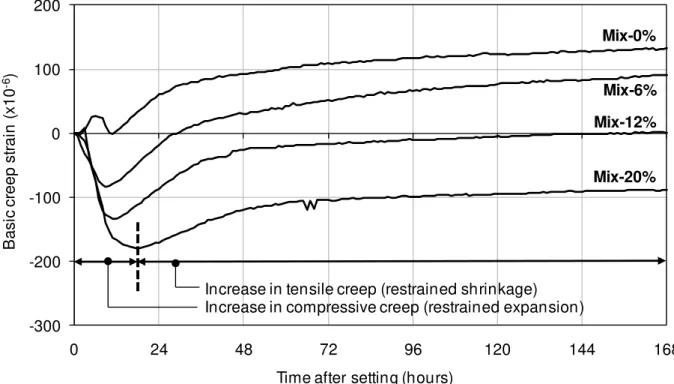
Early-age autogenous expansion can have a significant effect on the size and sign of basic creep strain developing over time in HPC structures. This was demonstrated by Cusson & Hoogeveen (2008) on a series of sealed 200 x 200 x 1000 mm prismatic HPC specimens tested under restrained autogenous shrinkage (and stress relaxation) as shown in Figure 4. For 0% (control), all creep strains were positive (tensile creep). On the opposite, for Mix-20% with a high level of internal curing, all creep strains were negative, with negative increments of creep strain obtained during restrained expansion, and positive increments of creep strain obtained during the following restrained shrinkage mode. For creep modelling and structural analysis purposes, the creep coefficient in this case cannot be determined with conventional methods, which assume either constant stress (CEB 1993; ACI 209, 1992) or restrained shrinkage only (Kovler 1994). Cusson (2008) developed a procedure for determining the creep coefficient from setting time under restrained expansion followed by restrained shrinkage. It was shown that creep coefficients of HPC determined experimentally with his proposed approach were found to be more than 50% smaller than those predicted by existing creep models (ACI 209, 1992; CEB 1993) that are mainly based on compressive creep test results obtained on normal strength concrete specimens.
The main benefit of the initial expansion obtained in Mix-20% due to the use of saturated LWA can be readily observed in Figure 5. Compared to Mix-0% (control), the initial expansion in Mix-20% considerably delayed the onset of tensile stresses in concrete to a time at which the tensile strength was substantially higher, thus providing a lower stress/strength ratio at any given time (i.e. reduced risk of cracking).
In these experiments, the thermal effects originated from the heat of cement hydration and the subsequent cooling producing thermal stresses under restraint. Measurements of temperatures and strains indicated that thermal effects accounted for a large part of the total concrete stresses. In the case of the Mix-20% specimen, most of the stresses were due to thermal effects since autogenous shrinkage strains were very small compared to the thermal strains. Drying shrinkage of HPC is typically lower than that of normal concrete due to the lower permeability provided by the combined use of low water-cement ratio and supplementary cementing materials. Recent work by Cusson & Margeson (2010) indicated that internal curing does not seem to reduce long-term drying shrinkage (e.g. drying started after 28 days of curing and lasted for about one year). With internal curing, the primary goal is to eliminate early-age autogenous shrinkage (due to internal drying) by providing a certain quantity of internal curing water equal to that needed for the compensation of self-desiccation in low water-cement ratio concrete. Since the water supply in the lightweight aggregate is not infinite, internal curing may not be expected to reduce long term drying shrinkage. In light of the above, if thermal effects can be controlled, and drying and autogenous shrinkage prevented by the combined use of conventional curing and internal curing, then the risk of concrete cracking can be effectively reduced, resulting in potentially more durable structures.
2.4 Effect of internal curing on chloride permeability and freeze-thaw resistance Up to recently, only indirect observations of reduced permeability due to internal curing of concrete through improved early-age strengths could be found in the literature (Bentz 2007). Durán-Herrera et al. (2007) tested several 0.35 w/c concrete specimens with and without internal curing, and found very similar and low values of chloride permeability for both types of curing, ranging from 220 to 460 Coulombs. Bentz (2009) demonstrated on 0.4 w/c mortar specimens made with 0.08 units of internal curing water per mass of cement that the chloride diffusion coefficient can be reduced to a value between 55% and 75% of that of the control mortar specimens made without internal curing. This reduction in the chloride diffusion coefficient was attributed to both a significant reduction in the volume fraction of the percolated paste of the interfacial transition zone around the LWA particles, and the enhanced long-term hydration in the mortar with internal curing. Recent work by Cusson & Margeson (2010) demonstrated on 0.35 w/c air-entrained concrete specimens (with 0.075 units of internal curing water per mass of cement) that cement hydration was actually enhanced by internal curing, resulting in 20% higher C-S-H content at 28 days (determined by thermal gravimetric analysis), which lead to about 10% higher compressive strength at 28 days (Table 1). The same study found that water permeability and chloride permeability of high-performance concrete could also be reduced by 20% and 25%, respectively (Table 1), which agreed well with the mortar permeability test results from Bentz (2009).
Freeze-thaw resistance of concrete is also a key property for ensuring long-term durability of concrete structures under severe exposure conditions. The higher relative humidity in concrete due to internal curing raised concerns in the industry regarding potential durability issues under freezing and thawing conditions. The recent study by Cusson & Margeson (2010) found that these concerns were unjustified in air-entrained high-performance concrete. It was found that internally-cured concrete performed better than the reference concrete without IC (Table 1) under 300 rapid cycles of freezing and thawing in water, and 50 slow cycles of freezing and thawing in a solution of de-icing chemicals (4% calcium chloride). This improvement could be attributed to the fact that the internal curing water available in the LWA is rapidly consumed by cement at early ages leaving empty pores in the LWA that could assist the air-entrained pores of the paste by creating additional room in the system for the possible ice formation. Further testing is needed to corroborate this hypothesis.
3 Effect of internal curing on life-cycle performance of HPC structures: Case study – highway bridge deck
To demonstrate the benefits of internal curing in high-performance concrete structures in terms of extended service life and reduced life-cycle cost, a typical concrete bridge deck slab was used for the case study. The bridge element under consideration for this comparative analysis is a 200-mm thick reinforced concrete deck slab (with an effective depth of 160 mm), which is illustrated in Figure 6 with its associated bridge structure. The concrete slab has a steel reinforcement ratio of 0.3% for both top and bottom mats in both transverse and longitudinal directions, including the main reinforcement and reinforcement for shrinkage, temperature and distribution (CSA 2006), and a concrete cover thickness of 75 mm for the top reinforcement. The concrete deck has a width of 13 m and a length of 35 m between expansion joints, and is carried by simply-supported prestressed concrete girders. All the above geometric parameters are taken into account in the analyses of service life performance and life cycle cost.
It should be noted that this comparative analysis focuses on the concrete deck slab, which is the most critical element of the bridge in terms of durability. It is therefore assumed that the bridge superstructure and substructure are identical for all the concrete deck design alternatives compared in this study. For this reason, the possible effects of the bridge superstructure and substructure on the concrete slab are neglected in this analysis.
Table 2 presents three mix design alternatives selected for the concrete decks compared in this case study, including: (i) bridge deck made of normal concrete (NC), with a water-cement ratio of 0.4 and no supplementary water-cementing materials (SCM); (ii) deck made of high-performance concrete (HPC), assuming early-age cracking due to autogenous shrinkage, with a w/c of 0.35, including 25% SCM as partial cement replacement by mass; and (iii) deck made of high-performance concrete with internal curing (HPC-IC), also with a w/c of 0.35 and 25% SCM included in the cement. In this case study, the SCM consisted of 5% silica fume and 20% slag in the cement; and the required mass of LWA was calculated using Eq. 1, assuming a chemical shrinkage value of 0.07 kg of water per kg of cement, and a free water content of 15% in the LWA available for internal curing.
The three concrete mix designs described above were selected to compare a new design alternative (i.e. internally-cured HPC) with two commonly-used designs for concrete bridge deck slabs: normal concrete and high-performance concrete, both using conventional curing. The two main differences between these last two concretes are: (i) lower water-cement ratio used in HPC, which can decrease concrete permeability, improve strength, and increase risk of early-age cracking due to autogenous shrinkage (as explained earlier); and (ii) use of supplementary cementing materials in HPC, which can further decrease concrete permeability and possibly reduce drying shrinkage cracking (Aïtcin 1998). In order to distinguish the benefits of using internal curing, HPC with SCM and conventional curing is compared to HPC with SCM and internal curing. Note that the use of normal concrete with internal curing is not considered in this study, since normal concrete typically has negligible autogenous shrinkage, thus not requiring the use of internal curing.
With respect to exposure conditions, the bridge deck is directly exposed to de-icing salts during winter periods. A surface chloride concentration of 9 kg/m3 is assumed, which is proposed by Weyers (1998) for typical severe conditions found in Canada and Northern USA. Note that this value may still be conservative for eastern Canada, where values up to 17 kg/m3 have been measured on a highway bridge deck (Cusson et al. 2009). A chloride threshold of 0.7 kg/m3 is assumed for the conventional steel reinforcement (ACI 222, 2001), above which corrosion can initiate. Once reinforcement corrosion has started, a moderate corrosion rate of 0.5 μA/cm2 is used (Rodriguez et al. 1994) for the cases of NC deck and HPC-IC deck, for which cases premature cracking is assumed to be negligible. For the case of HPC deck slab, where early-age cracking is assumed to occur, the corrosion rate has been increased by 30%, as found by Cusson & Qian (2009) on a concrete highway bridge deck made of very similar high-performance concrete under similar exposure conditions.
It can be argued that these values may differ from actual values depending on the severity and variability of the local exposure conditions; however, the findings of this case study should be considered with respect to the normal concrete deck (base case), since all deck options are compared using the same sets of initial conditions, being the surface chloride concentration and chloride threshold.
4 Service life of high-performance concrete bridge decks
Figure 7 presents the different stages of corrosion-induced damage developing in a typical reinforced concrete bridge deck built in a corrosive environment, which identifies a three-stage service life model, i.e. (i) early-age cracking three-stage; (ii) corrosion initiation three-stage; and (iii) propagation stage, which is a modified version of Tuutti’s simplified model (1982). With time, each stage develops into higher levels of damage, which include: (i) early-age cracking of concrete due to restrained shrinkage (if any); (ii) initiation of reinforcement corrosion after a relatively long period of chloride diffusion through concrete; (iii) internal cracking around the reinforcing bars due to the build-up of corrosion products; (iv) surface cracking due to further progression of corrosion-induced cracks; (v) delamination or spalling of the concrete cover, depending on the slab reinforcement design; and finally (vi) failure of the concrete deck, depending on the amount of concrete damage that can be tolerated by the bridge owner before deck rehabilitation or replacement is considered.
In this study, most life-cycle performance predictions were made using the deterministic and reliability-based analytical models developed by Lounis et al. (2006), and implemented in NRC’s SLAB-D software (Daigle & Lounis 2006), and will be presented in this section. Furthermore, the effects of early-age cracking and internal curing on chloride penetration were estimated using experimental data and modified models developed by Cusson et al. (2008, 2009 & 2010), and will be discussed in this section.
4.1 Modeling of initial cracking due to restrained shrinkage
Early-age cracking is a common problem on concrete bridge decks (TRB 1996, FHWA 2007) as more than 100,000 bridges in the United States are reported to have developed transverse cracking shortly after construction. This type of through cracking is of great concern to engineers and bridge owners since it is well established from experimental results that cracking accelerates chloride ingress and may lead to premature reinforcement corrosion and concrete deterioration (Shutter 1999; Tsukahara & Uomota 2000; Rodriguez & Hooton 2003). It is generally accepted that in order to model the effect of cracking on chloride ingress, the chloride diffusion coefficient corresponding to uncracked concrete need to be modified into an apparent value that defines the cracked medium (François & Arliguie 1998, 1999; Gérard & Marchand 2000).
Rodriguez & Hooton (2003) studied the influence on chloride penetration of artificially created parallel cracks with widths ranging from 0.08 mm to 0.68 mm. For the crack ranges studied, the parallel-wall cracks were found to behave like a free concrete surface resulting in a case of two-dimensional diffusion that greatly promoted chloride ingress. They concluded that chloride diffusion in concrete was not affected by the width and wall roughness of individual cracks. Tsukahara & Uomota (2000) also proposed a two-dimensional chloride ingress model where the crack plane was considered as an attenuated boundary of which chloride content was a function of surface chloride content, time, and distance from exposed concrete surface. Boulfiza et al. (2003) used a simplified smeared approach (SSA) to estimate the effect of cracks on chloride ingress. It assumes that chloride ingress into cracked concrete can be approximated using Fick’s second law of diffusion, in which an apparent diffusion coefficient (Dapp) is found with this equation:
cr cr cr c app D s w D D = + (2)
where Dc is the chloride diffusion coefficient in uncracked concrete; wcr is the crack width; scr
is the crack spacing; and Dcr is the diffusion coefficient inside the crack, which is assumed to
be 5x10⁻¹⁰ m2/s (Boulfiza et al. 2003). The SSA method was used in the present case study to evaluate the apparent coefficient of diffusion of cracked concrete. The value of wcr/scr was set
to 0.0003, which corresponds to the 7-day value of shrinkage strain measured for a concrete that was very similar to that selected for the HPC deck option (Cusson & Hoogeveen 2008). As a result, an average increase in the chloride diffusion coefficient of approximately 1.5 x 10⁻¹³ m2/s can be expected (which can increase the corrosion rate of the reinforcement as discussed in Section 3). For the decks made with NC and HPC-IC, the effect of cracking on chloride ingress was neglected (i.e. Dapp = Dc), assuming that autogenous shrinkage in these
concretes is not large enough to result in significant concrete cracking.
4.2 Modeling of chloride ingress into concrete and corrosion initiation
In uncracked concrete, the chloride ingress can be determined by using Crank’s solution of Fick’s second law of diffusion (Crank 1975):
⎥ ⎥ ⎦ ⎤ ⎢ ⎢ ⎣ ⎡ ⎟ ⎟ ⎠ ⎞ ⎜ ⎜ ⎝ ⎛ − = t D x erf C t x C s 2 1 ) , ( (3a)
where C(x,t) is the chloride concentration at depth x after exposure time t; Cs is the apparent
surface chloride concentration; and erf is the error function.
The use of the above model assumes that diffusion is the main mechanism of chloride ingress into concrete. In porous solids like concrete, chlorides can penetrate into concrete via different physical mechanisms, such as: diffusion, capillary absorption, electrical migration, and permeation due to hydraulic pressure heads, depending on the exposure condition and moisture content (Kropp 1995). The lack of accuracy of Fick’s model has been recognized for a long time, since it has been used with the so-called “apparent” values of the diffusion coefficient and surface chloride concentration, which are obtained by calibrating the Fickian model with available field data. However, this model has gained wide acceptance due to its simplicity and practicality (Bamforth 1998; Tang & Gulikers 2007).
Equation 3a can be rearranged to predict the time of corrosion initiation (ti) by setting C(x,t)
equal to the chloride threshold (Cth), at which corrosion of the reinforcing steel is expected to
initiate, and x equal to the effective cover depth of the reinforcement (dc), as follows:
2 1 2 1 4 ⎥ ⎦ ⎤ ⎢ ⎣ ⎡ ⎟⎟ ⎠ ⎞ ⎜⎜ ⎝ ⎛ − = − s th c i C C erf D d t (3b)
The chloride diffusion coefficients of the different concretes were estimated based on the water-cement ratios and the types of SCM selected for this case study. The empirical models of Boulfiza et al. (2003) developed from a large set of literature data were used:
0 . 14 ) / ( 2 . 7 ) / ( 9 . 3 2 + − − = w c w c D
7 . 13 ) / ( 4 . 5 ) / ( 0 . 3 2+ − − = w c w c D
Log C (with silica fume & slag) (4b)
where Dc is expressed in units of m2/s. In the case of normal concrete with w/c = 0.40, a
chloride diffusion coefficient of 18 x10-13 m2/s was found with Eq. 4a, and used for the analysis of the NC bridge deck option. In the case of high-performance concrete with SCM and w/c = 0.35, a diffusion coefficient of 6.6 x10⁻¹³ m2/s was determined with Eq. 4b. For the HPC bridge deck alternative with conventional curing, the chloride diffusion coefficient was increased to 8.1 x10⁻¹³ m2/s to account for the adverse effect of early-age cracking based on Eq. 2. For the HPC-IC bridge deck alternative, the diffusion coefficient was reduced by 25% down to 5.0 x10⁻¹³ m2/s to account for the beneficial effect of internal curing based on experimental evidence on mortar specimens (Bentz 2009) and high-performance concrete specimens (Cusson & Margeson 2010).
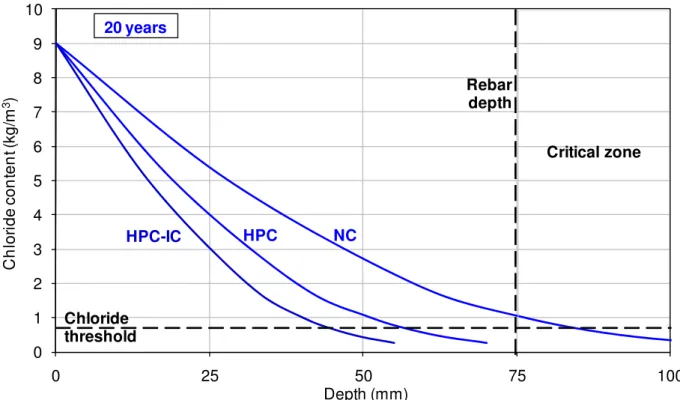
Figure 8a presents the chloride profiles calculated for the three different concrete bridge deck options after a 20-year exposure to de-icing salts. The critical zone corresponds to chloride concentrations at the reinforcement level (or deeper) that are higher than a chloride threshold of 0.7 kg/m3, over which initiation of steel corrosion is likely to occur. It can be seen that after 20 years, the chloride concentration in the normal concrete deck has reached the critical concentration at the 75-mm depth. Figures 8b and 8c present chloride profiles calculated after 40 years and 60 years of exposure to de-icing salts, respectively. As the chlorides progress deeper in the concrete over time, the HPC-IC deck option provided adequate chloride protection to the reinforcement for 60 years, after which corrosion initiation of the 75-mm deep reinforcement is likely to happen. Figure 9 presents the chloride concentrations developing over time for two depths in the concrete, namely 40 mm (rebar depth in many old concrete bridge decks in severe environments) and 75 mm (rebar depth in the present case study). It is clear that increasing the cover depth from 40 mm to 75 mm results in a very large increase in the time required to reach the chloride threshold level of the reinforcement, regardless of the type of concrete used.
Considerable variability and uncertainty are associated with the parameters that govern the above model for the same structure (Lounis & Mirza 2001; Lounis & Amleh 2003). This uncertainty in the above diffusion model will be modeled by using advanced probabilistic models that will provide the service life predictions in terms of time-varying probability of chloride concentration at different depths and time-varying probability of corrosion, which are discussed in Section 4.4.
4.3 Modeling of corrosion-induced damage initiation and damage growth
The accumulation of corrosion products over time generates contact pressure between the rebar and the surrounding concrete, and may initiate cracks if the tensile stress in the concrete reaches the tensile strength (f’t). The concrete cover surrounding the corroding rebar can be
modelled as a thick-wall cylinder subjected to a uniformly distributed internal pressure (pi),
assuming that concrete is a homogeneous elastic material, and that corrosion products are equally distributed around the perimeter of the reinforcing bars (Bažant 1979, Tepfers 1979). The radial stress (σr) and tangential stress (σt) generated in the concrete cover by the internal
pressure (pi) due to the expansion of the corrosion products can be estimated using the
thick-wall cylinder model (Figure 10, Timoshenko 1956). This model allows the determination of the increases in rebar diameter (Δd) related to different stages of corrosion-induced damage by calculating the radial displacement at the inner surface of the cylinder, as follows (assuming that the external pressure induced by external loads on the structure is negligible):
d d d d d E p d c c c i ⎥ ⎦ ⎤ ⎢ ⎣ ⎡ + + + = Δ ) ( 2 1 2 ν (5a) where d is the bar diameter, dc is the concrete cover, ν is Poisson's ratio of concrete, Ec is the
effective elastic modulus of concrete taking into account the effect of creep (Bažant 1979). The corrosion propagation times (tp), corresponding to the onset of internal cracking, surface
cracking, and delamination/spalling, respectively, can be determined as a function of the corresponding increase in rebar diameter as follows:
⎥ ⎦ ⎤ ⎢ ⎣ ⎡ − Δ = s r r p j S d d t ρ α ρ π 1 2 ) ( (5b)
where S is the rebar spacing; jr is the rust production rate per unit area (Bažant 1979); ρr is the
density of corrosion products (assumed at 3600 kg/m3 for Fe(OH)3); ρs is the density of steel
(7860 kg/m3); and α is the molecular weight ratio of metal iron to the corrosion product (assumed at 0.52). The service life (ts) can be defined as the total time to reach a given level,
which is the sum of the early-age cracking time (tcr), the corrosion initiation time (ti) and the
corrosion propagation time (tp) corresponding to that level, as follows: p
i cr
s t t t
t = + + (6)
Work by Allan & Cherry (1992) and Liu & Weyers (1998) showed that there may be a porous zone around the reinforcement at the steel/concrete interface, in which a specific quantity of corrosion products can accumulate before tensile stresses develop in concrete, thus delaying damage initiation of the concrete cover. The thickness of the porous zone depends on factors like: w/c, presence/type of SCM, and hydration, which in turn influence the overall concrete porosity and may be estimated at 12.5 μm (Liu & Weyers 1998).
Internal curing may affect the porous zone in two competing ways: (i) by decreasing the porosity of the cement paste due to an improved cement hydration; and (ii) by increasing the porosity of the porous zone due to the relatively large and empty pores left in the LWA after the internal curing water has migrated into the cement paste. Due to the lack of data in the literature on the effect of internal curing and water-cement ratio on the thickness and porosity of the porous zone, this possible beneficial effect is neglected in this analysis. Preliminary calculations indicate that neglecting the effect of the porous zone would provide a more conservative estimate of service life by at most 2 or 3 years only.
4.4 Modeling of uncertainty in service life model parameters
The variability and uncertainty of the main parameters (e.g. material properties, structure dimensions, reinforcing details, initial conditions, and environment) that govern service life, as well as the uncertainty of the analytical models used in design, are the sources of the observed variable performance of concrete decks in the field, which is better described with a reliability-based approach, in which all governing parameters are modelled as random variables. In general, the time-dependent probability of failure (Pf), reaching limit states such
as critical chloride concentration, onset of corrosion, onset of cracking, spalling or delamination, can be formulated as follows:
(7a) The determination of the time-dependent probability of failure is a very complex problem due to the high level of nonlinearity of the performance functions that describe the above failure modes. In this approach, the advanced first-order reliability method is used to determine the probability of failure for the above described service life performance functions. The determination of the probability of failure can be formulated as a nonlinear optimization problem, in which the solution minimizing the distance from the origin to the failure surface (described by any of the above performance functions) is sought. This minimum distance was defined as a measure of the reliability index by Hasofer & Lind (1974). Once the reliability
ined, the probability of failure can be estimated as follows: index (β) is determ
1 Φ (7b)
where Φ is the well-known cumulative distribution function of the standard normal variable. An iterative numerical algorithm was developed to solve the above nonlinear optimization problem and to determine the reliability index (Lounis & Daigle 2008). If the random variables are not normal, then the above approach provides only estimates of the probability of failure (Madsen et al. 1986).
4.5 Service life of high-performance concrete bridge decks
Several different estimates of the service life can be obtained by using the developed analytical damage initiation and accumulation models presented herein depending on the selected failure criteria. The service life of a concrete highway bridge deck is generally defined as the time to reach critical damage levels, in terms of delamination or spalling (e.g. AASHTO 2002). In this case study, the service life of a bridge deck is defined as the time to onset of delamination or spalling (whichever occurs first, depending on slab geometry and reinforcement details). Figure 11 illustrates the average service life estimated for each concrete deck option, in which the times to reach lower levels of concrete damage are also illustrated. Based on the above hypotheses, the service life of the bridge deck increased due to the use of supplementary cementing materials and lower water-cement ratio (reducing chloride diffusion), in general, and the reduction of early-age cracking due to the use of internal curing and SCM. The calculated service lives were 22 years for the 0.40 w/c NC deck; 40 years for the 0.35 w/c HPC deck; and 63 years for the 0.35 w/c HPC-IC deck. For simplicity, other factors such as live loads, dead loads and thermal effects were not considered in this comparative analysis.
The service life predictions presented in Figure 11 were obtained through a deterministic analysis, i.e. an analysis that does not consider the variability and uncertainty associated with the main parameters governing the different mechanisms of deterioration in reinforced concrete decks. Deterministic analyses are based on mean or characteristic values of the variables and can only predict the times to reach the different stages of corrosion initiation and corrosion-induced damage caused by an average condition.
The three concrete deck options were re-analyzed using the reliability-based method, considering the variability of six key parameters (Table 3) expressed in terms of their mean values and coefficients of variation (COV). Figure 12 presents the results from the reliability analysis for the three deck options, in which the probability of spalling (which was the governing failure mode) increased over time.
It should be pointed out that, if the investigated governing parameters exhibit considerable spatial variability within the deck, the analysis may require the use of random fields instead of random variables for their modeling (Stewart 2003; Lounis et al. 2006). The use of random fields, however, requires more input data such as the correlation function and scale of fluctuation, and adds considerable analytical and computational complexity to the analysis. If the variability of the parameters can be assumed to be completely random, i.e. no systematic variability and no spatial correlation, then the use of random variables for modeling the above parameters is adequate (Lounis et al. 2006). Considering that the bridge deck can be divided into a very large number of small surface areas with same probability (P%) of spalling after a number of years (t), it can be approximated that a certain percentage (P%) of them are spalled after a given time. The 10%, 25% and 50% probabilities of spalling are highlighted in Figure 12. These probabilities can be used to make initial and approximate comparisons to the five condition states defined in the 2002 AASHTO guidelines for the condition assessment of concrete bridge decks (Table 4), which is used in the bridge management systems of several states in USA and some Canadian provinces.
For the normal concrete deck, calculations indicated that the 10%, 25% and 50% probabilities of spalling were reached after 9, 14, and 22 years. For the HPC and HPC-IC decks, these threshold probabilities were reached after 15, 25 and 40 years; and 24, 39, and 63 years, respectively. As the apparent coefficients of diffusion of the three investigated deck options decreased, the times to reach critical condition states increased accordingly.
Depending on the bridge owner policy and the estimated costs and benefits of repairs, the optimum recommended action to take for each deck condition state can be different, ranging from the do-nothing approach, to delamination and spalling repairs, and ultimately to deck replacement. In addition to the extended service life provided by the reduced initial cracking and reduced chloride diffusion coefficient, the reliability-based analysis also demonstrated that the use of lower w/c concretes with internal curing can result in longer periods of time before major repair or rehabilitation activities become necessary, as indicated by the times needed to reach critical condition states (Figure 12).
It is also observed that high-performance concrete decks, even with initial cracking, may achieve longer service lives than normal strength concrete decks, showing that the benefits of using low permeability HPC can outweigh its initial shortcomings. This is due to the significant decrease in the apparent chloride diffusion coefficient by using dense HPC with supplementary cementing materials and low water-cement ratio (Eqs. 4a and 4b). Previous studies have shown that the depth and quality of concrete cover have more influence on corrosion rate than cracking (Tsukahara & Uomota 2000, Cusson & Qian 2009). Also, François & Arliguie (1999) concluded that effect of cracking on long-term corrosion may be negligible.
5 Life-cycle cost of high-performance concrete bridge decks
A life-cycle cost analysis (LCCA) is carried out when there is a need to evaluate and compare the economic performance of competing design and maintenance alternatives. A LCCA was conducted to assess the total life-cycle costs of the three bridge deck alternatives, for which many different types of activities may be scheduled at different points in time, for example: periodic inspections, required maintenance and repairs, as well as deck replacement (Figure 13). This is usually achieved by calculating the present value life-cycle costs (PVLCC) of the alternatives over a given time period (Grant et al. 1990; Hawk 2003):
∑
= + − + + = T t T v t i r R r C C PVLCC 1 0 ) 1 ( ) 1 ( (8)where C0 is the initial construction cost; Ci is the ith expenditure a given time t (years) after
construction; r is the discount rate; T is the analysis period (years); and Rv is the residual
value of the alternative at the end of the analysis period. In this study, the analysis period was set to 60 years for all cases, with an assumed discount rate of 3%. The direct costs incurred by the bridge owner usually include initial construction costs and other costs associated with the maintenance activities. In this case study, the construction costs included the cost of reinforcing steel ($2/kg) and the in-place cost of concrete (Table 2), thus considering formwork installation, detailing of reinforcing steel, placing and surface finishing of concrete, and form stripping. The in-place cost of concrete will depend on many factors, such as the type and quantity of cement, aggregates, supplementary cementing materials and admixtures used in the concrete mix, and their availability. The unit cost of HPC ($600/m3) was estimated to be 33% higher than that of normal concrete ($450/m3), mainly due to the increased quantity of cement in the mix. The unit cost of HPC-IC was set to that of HPC plus a 4% increase to account for the cost difference associated with the purchase and transportation of the lightweight aggregate sand (with a purchase cost of $75/ton) used to substitute a fraction (200 kg/m3) of the normal density fine aggregate (with a purchase cost of $15/ton). Note that this small 4% cost increase could be offset by using slightly less cement in the concrete mix, knowing that the more effective cement hydration due to internal curing would likely achieve similar concrete strength (Villarreal & Crocker 2007).
In this case study, a set of various maintenance activities were assumed to take place on the bridge decks over their life cycles. Figure 14a illustrates those scheduled for the NC deck. For instance, routine inspections were scheduled at two-year intervals, while non-destructive evaluation and protection activities were scheduled to occur every five years.
While it was assumed that autogenous shrinkage cracking could be neglected for normal concrete, protection activities were scheduled to correct other problems such as drying shrinkage, freeze-thaw damage, etc. Major patch repairs (including old concrete removal, surface preparation, patching, and traffic control) were scheduled to take place approximately when 10% and 25% of the deck surface would be spalled (based the reliability analysis results presented in Figure 12). In this study, deck replacement was deemed necessary when 50% of the deck surface would be spalled. After replacement, it was assumed that the bridge deck would be rebuilt with a similar type of deck at a similar initial construction cost.
Figures 14b and 14c show the scheduled activities for the decks using HPC and HPC-IC, respectively. The major difference from the NC deck is that the non-destructive evaluation and protection activities were scheduled to occur every 10 years, since high-performance concrete is expected to perform better than normal concrete, in general. Table 5 presents the agency costs associated with the different maintenance activities. Figure 15 illustrates both the initial construction cost and the present value life-cycle cost incurred by the agency for each deck option.
Over a 60-year analysis period, the PVLCC for the normal concrete deck is the highest at $783/m2, which is mainly due to the shorter service life and the more frequent maintenance and replacement activities. The HPC deck (no internal curing) reduced this cost by 40%,
mainly due to the longer service life. The HPC-IC deck further reduced the PVLCC down to $292/m2, which is 63% less expensive than the NC deck, or 38% less expensive than the HPC deck due to the use of internal curing.
Figure 16 shows the present value cumulative expenditures incurred by the bridge owner over the 60-year analysis period for the three concrete deck alternatives. It is clearly shown that the higher initial investment in the HPC-IC deck, compared to the NC deck, can be offset in only 5 years due to the lower maintenance costs associated with HPC-IC, which represents only 8% of its 63-year service life.
6 Summary and conclusions
The performance of HPC structures can be substantially improved by the use of pre-saturated structural-grade LWA for internal curing that can reduce autogenous shrinkage, tensile stress development, chloride permeability and cracking of concrete. The life-cycle performance of three bridge decks made with different concretes were estimated using analytical predictive models for shrinkage cracking, chloride diffusion, corrosion initiation, and corrosion propagation leading to cracking, delamination, or spalling. The concretes selected for the bridge decks were: (i) normal concrete (w/c=0.40); (ii) HPC (w/c=0.35) with the use of SCM and conventional curing; and (iii) HPC (w/c=0.35) with the use of SCM and internal curing. From this study, these conclusions can be drawn:
• Service lives of 22, 40 and 63 years were estimated for typical bridge decks made of normal concrete (NC), performance concrete (HPC) and internally-cured high-performance concrete (HPC-IC), respectively, which were subjected to severe environmental conditions.
• The use of internal curing can increase the service life of high-performance concrete bridge decks by 23 years, mainly due to the prevention of initial cracking and reduction in chloride diffusion.
• Compared to normal concrete, internally-cured high-performance concrete provided bridge decks with an additional 41 years of service life. This is due to the use of a lower water-cement ratio (increasing strength and decreasing permeability) combined with the use of supplementary cementing materials and internal curing (both reducing permeability and risk of cracking).
• The life-cycle cost of a bridge deck can be considerably reduced when using high-performance concrete over normal concrete, especially with internal curing. This can be attributed to fewer maintenance activities and a longer service life;
• The use of internal curing compared to conventional curing in high-performance concrete decks resulted in a 38% reduction in life-cycle cost, even with a 4% higher in-place unit cost for internally-cured HPC;
• The higher initial investment required for the construction of the HPC-IC deck can be offset in only 5 years when compared to that required for the NC deck. This is due to less frequent maintenance activities and a longer service life.
References
AASHTO, Guide for Commonly Recognized (CoRe) Structural Elements, American Association of State Highway and Transportation Officials, 1998 (Rev. 2002), 54 p.
ACI 209, Prediction of creep, shrinkage, and temperature effects in concrete structures, ACI Report 209R-92, American Concrete Institute Farmington Hills, 1992, 47 p.
ACI 222, Protection of Metals in Concrete Against Corrosion, ACI Report 222R-01, American Concrete Institute, Farmington Hills, 2001, 41 p.
Aïtcin, P.C., High-Performance Concrete, E & FN Spon, New-York, 1998, 591 p.
Allan, M.L. & Cherry, B.W., Factors controlling the amount of corrosion for cracking in reinforced concrete, Journal of Corrosion Engineering, 1992, 426-430.
Bamforth, P.B., Spreadsheet model for reinforcement corrosion in structures exposed to chlorides, in: Concrete under Severe Conditions 2: Environment and Loading, Vol. 1, O.E. Gjørv, K. Sakai & N. Banthia, editors, E & FN Spon, London, 1998, 64-75.
Bažant, Z.P., Physical model for steel corrosion in concrete sea structures – theory. Journal of the
Structural Division, 105(ST6), 1979, 1137-1153.
Bentz, D.P., Internal curing of high-performance blended cement mortars, ACI Materials Journal, 104(4), July-August 2007, 408-414.
Bentz, D.P., Influence of internal curing using lightweight aggregates on interfacial transition zone percolation and chloride ingress in mortars, Cement and Concrete Composites, 31, 2009, 285–289.
Bentz, D.P., Jensen, O.M., Hansen, K.K., Olesen, J.F., Stang, H. & Haecker, C.J., Influence of cement particle-size distribution on early-age autogenous strains and stresses in cement-based materials, Journal of the American Ceramic Society, 84(1), 2001, 129-135.
Bentz, D.P., Lura, P. & Roberts, J.W., Mixture proportioning for internal curing, Concrete
International, February 2005, 1-6.
Bentz, D.P., Sant, G. & Weiss, W.J., Early-Age Properties of Cement-Based Materials: I. Influence of Cement Fineness, ASCE Journal of Materials in Civil Engineering, 20(7), 2008, 502-508.
Boulfiza, M., Sakai, K., Banthia, N. & Yoshida, H., Prediction of chloride ions ingress in uncracked and cracked concrete, ACI Materials Journal, 100(1), Jan.-Feb. 2003, 38-48. CEB, CEB-FIP Model Code 1990, Information Bulletin No. 213/214, Euro-International
Concrete Committee, Lausanne, 1993, 437 p.
Crank, J., The mathematics of diffusion, 2nd ed., Oxford University Press, London, 1975, 414 p. CSA, Canadian Highway Bridge Design Code, CAN/CSA-S6-06, Canadian Standard
Association International, Rexdale, Ontario, 2006.
Cusson, D., Early-age viscoelastic behavior of high-performance concrete with internal curing, 8th International Conference on Creep, Shrinkage and Durability of Concrete and Concrete Structures, Ise-Shima, Japan, Sept. 30–Oct. 2, 2008, 6 p.
Cusson, D., Almansour, H., Lounis, L. & Daigle, L., Monitoring for durability and structural performance of highway bridges, 4th Intl. Conference on Structural Health Monitoring on Intelligent Infrastructure (SHMII-4), July 22-24, 2009, Zurich, Switzerland, 8 p.
Cusson, D. & Hoogeveen T., Internal curing of high-performance concrete with pre-soaked fine lightweight aggregate for prevention of autogenous shrinkage cracking, Cement and
Concrete Research, 38(6), 2008, 757-765.
Cusson, D. & Margeson, J., Development of low-shrinkage high-performance concrete with improved durability, 6th Intl. Conference on Concrete Under Severe Conditions, Environment and Loading (CONSEC’10), Merida, Yucatan, Mexico, June 7-9, 2010, 8 p. Cusson, D. & Qian, S., Ten-year field evaluation of corrosion inhibiting systems in concrete
bridge barrier walls, ACI Materials Journal, 106(3), 2009, 291-300.
Durán-Herrera, A., Aïtcin, P.-C. & Petrov, N., Effect of Saturated Lightweight Sand Substitution on Shrinkage in 0.35 w/b Concrete, ACI Materials Journal, 104(1), Jan.-Feb. 2007, 48-52.
Daigle, L. & Lounis, Z., SLAB-D Version 1.0 User’s Manual (and software) – Service Life Analysis of Bridge Decks, National Research Council Canada, Institute for Research in Construction, 2006, 119 p.
FHWA, 2006 Status of the Nation’s Highways, Bridges, and Transit: Conditions and
Performance Report to Congress, Federal Highway Administration, 2007, 436 p.
François, R. & Arliguie, G., Influence of service cracking on reinforcement steel corrosion,
Journal of Materials in Civil Engineering, 10(1), 1998, 14-20.
Francois, R. & Arliguie, Effect of microcracking and cracking on the development of corrosion in reinforced concrete members, Magazine of Concrete Research, 51 (2), 1999, 143-150. Gérard, B. & Marchand, J., Influence of cracking on the diffusion properties of cement-based
materials: Part I: Influence of continuous cracks on the steady-state regime, Cement and
Concrete Research, 30(1), 2000, 37-43.
Grant, E., Ireson, W. & Leavenworth, R., Principles of Engineering Economy, 8th ed., John Wiley & Son, New-York, 1990.
Hasofer, A.M., and Lind, N.C., Exact and invariant second-moment code format, ASCE Journal of the Engineering Mechanics Division, 100(EM1), 1974, p. 111-121.
Hawk, H, Bridge Life-Cycle Cost analysis, NCHRP Report 483, Transportation Research Board, 2003.
Jensen, O.M. & Hansen, P.F., Water-entrained cement-based materials: 1. Principle and theoretical background, Cement & Concrete Research, 31(4), 2001, 647-654.
Kovler, K., Testing system for determining mechanical behaviour of early-age concrete under restrained & free uniaxial shrinkage, Materials & Structures, 27, 1994, 324-330.
Kropp, J. & Hilsdorf, H.K., Performance Criteria for Concrete Durability, E&FN SPON, London, 1995.
Liu, Y. & Weyers, R.E., Modeling time-to-corrosion cracking in chloride contaminated reinforced concrete structures, ACI Materials Journal, 95(6), 1998, 675-681.
Lounis, Z. & Amleh. L., Reliability-based prediction of chloride ingress and reinforcement corrosion of aging concrete bridge decks, In: Life-cycle performance of deteriorating
structures, Frangopol, D. et al., editors, ASCE Press, 2003, 113-122.
Lounis, Z., Martín-Pérez, B., Daigle, L. & Zhang, J., Decision support tools for service life
prediction and rehabilitation of concrete bridge decks, NRC-IRC Final Client Report No. B5318.2, April 2006, 256 p.
Lounis, Z. & Daigle, L., Reliability-based decision support tool for life-cycle design and maintenance of highway bridge decks, Proceedings of TAC Annual Conference, Toronto, Sept. 2008.
Lounis, Z. & Mirza, M. S., Reliability-based service life prediction of deteriorating concrete structures, Proceedings of the Third International Conference on Concrete Under Severe
Conditions, Vancouver, 2001, 965-972.
Madsen, H.O., Krenk, S & Lind, N.C., Methods of Structural Safety, Prentice-Hall Inc., Englewood Cliffs, NJ, 1986.
Powers, T.C. & Brownyard, T.L., Studies of the physical properties of hardened Portland cement paste, Journal of the American Concrete Institute, 18(3), Nov. 1948, 249-336.
RILEM TC-196, Internal curing of concrete, State-of-the-art Report of RILEM Technical Committee 196-ICC, Edited by K. Kovler & O.M. Jensen, RILEM Publications S.A.R.L., Bagneux, France, 2007, 139 p.
Rodriguez, O.G. & Hooton, R.D., Influence of cracks on chloride ingress into concrete, ACI
Materials Journal, 100(2), March 2003, 120-126.
Rodriguez, J., Ortega, L.M. & Garcia, A.M., Assessment of structural elements with corroded reinforcement, International Conference on Corrosion, Sheffield, U.K., July 1994, 16 p. Schutter, G. D., Quantification of the influence of cracks in concrete structures on carbonation
Stewart, M., Faber, M.H & Gehlen, C., Temporal and spatial aspects of probabilistic corrosion models, FIB-JCSS Workshop on Probabilistic Modeling of Deterioration Processes in
Concrete, Lausanne, Switzerland, 2003, 269-278.
Timoshenko, S.P., Strength of Materials. Part II: Advanced Theory and Problems, Princeton, NJ, 1956.
TRB, Transverse cracking in newly constructed bridge decks, National Co-operative Highway Research Program Report 380, Transportation Research Board, National Academy Press, Washington, 1996, 126 p.
Tang, L. & Gulikers, J., On the mathematics of time-dependent apparent chloride diffusion coefficient in concrete, Cement and Concrete Research, 37(4), 2007, 589-595.
Tepfers, R. (1979), Cracking of concrete cover along anchored deformed reinforcing bars, Magazine of Concrete Research, 31(106), 3-12.
Tuutti. K., Corrosion of Steel in Concrete, Ph.D. Thesis, Swedish Cement and Concrete Research Institute, Stockholm, Sweden, 1982, 469 p.
Tsukahara, E & Uomota T., Corrosion rate of reinforcing steel bars in cracked concrete,
Transaction of the Japan Concrete Institute, 22, 2000, 155-166.
Villarreal, V.H. & Crocker, D.A., Better pavements through internal hydration, Concrete
International, February 2007, 32-36.
Weber, S. & Reinhardt, H.W., New generation of high-performance concrete: concrete with autogenous curing, Advanced Cement Based Materials, 6(2), 1997, 59-68.
Weyers, R.E., Service life model for concrete structure in chloride laden environments, ACI
materials journal, 95(4), July-August 1998, 445-453.
Zhutovsky, S., Kovler, K. & Bentur, A., Influence of cement paste matrix properties on autogenous curing of high-performance concrete, Cement and Concrete Composites, 26, 2004, 499-507.
List of table captions
Table 1. Selected test results on impact of internal curing on properties of HPC (Cusson & Margeson, 2010).
Table 2. Mix designs of selected concrete bridge deck alternatives in case study.
Table 3. Mean values and coefficients of variation of governing parameters of service life model used in case study.
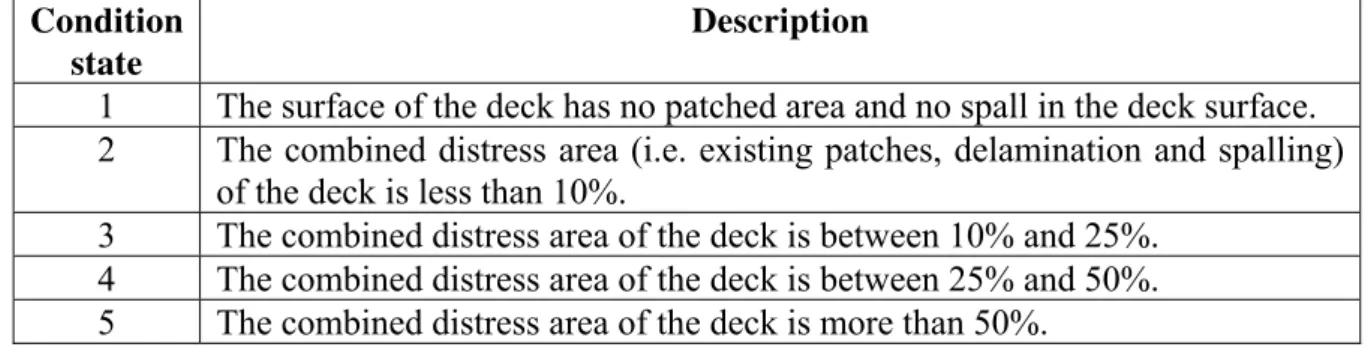
Table 4. AASHTO description of condition states for concrete bridge decks with no surface protection and built with uncoated reinforcement.
List of figure captions
Fig. 1. Minimum amount of internal curing water for maximum hydration and minimum self-desiccation during cement hydration (adapted from RILEM TC-196, 2007).
Fig. 2. Reduction of net shrinkage strain with increased quantity of internal curing water. (adapted from Cusson & Hoogeveen 2008)
Fig. 3. Measured total strains in unrestrained concrete specimens. (Cusson & Hoogeveen 2008)
Fig. 4. Measured basic creep strains in restrained concrete specimens. (adapted from Cusson & Hoogeveen 2008)
Fig. 5. Measured uniaxial stresses in restrained concrete specimens. (adapted from Cusson & Hoogeveen 2008)
Fig. 6. Geometry of bridge deck slab used in the case study, and associated bridge structure. Fig. 7. Schematic description of service life model.
Fig. 8a. Chloride profiles in concrete slab after 20 years. Fig. 8b. Chloride profiles in concrete slab after 40 years. Fig. 8c. Chloride profiles in concrete slab after 60 years.
Fig. 9. Time-variations of chloride concentrations at depths of 40 mm and 75 mm. Fig. 10. Uncracked and cracked thick-wall cylinder models of corroding RC bridges: (a) Tensile stresses developed at crack initiation;
(b) Propagation of internal cracks in thick-wall cylinder; (adapted from Lounis & Daigle 2006).
Fig. 11. Service life predictions from deterministic service life models. Fig. 12. Time-dependent probability of concrete cover spalling.
Fig. 13. Typical expenditures over life cycle of bridge decks (adapted from Daigle & Lounis 2006).
Fig. 14a. Optimised maintenance schedules for normal concrete deck alternative. Fig. 14b. Optimised maintenance schedules for HPC deck alternative.
Fig. 14c. Optimised maintenance schedules for HPC-IC deck alternative.
Fig. 15. Initial construction costs and present value life-cycle costs of deck alternatives. Fig. 16. Present value cumulative expenditures for all bridge deck alternatives.
Table 1. Selected test results on impact of internal curing on properties of HPC (Cusson & Margeson, 2010).
Property Reference concrete (w/c=0.35) Internally-cured concrete (w/c=0.35) Relative improvement w/cic (kg/kg) 0 0.075 C-S-H content at 28d (%) 10.2 12.3 21%
Compressive strength at 7d (MPa) 45 50 11%
Compressive strength at 28d (MPa) 60 65 8%
Water permeability (m/s) 2.1 x 10⁻¹¹ 1.7 x 10⁻¹¹ 19%
Chloride permeability (Coulomb) 553 415 25%
Freeze-thaw resistance, mass loss (%) 0.60 0.26 Salt scaling resistance, mass loss (%) 0.46 0.30
Table 2. Mix designs of selected concrete bridge deck alternatives in case study. Deck option Initial cracking Water (kg/m3) Cement (kg/m3) SCM (%) LWA (kg/m3) In-place concrete unit cost ($/m3) NC No 140 350 0 0 450 HPC Yes 160 450 25 0 600 HPC-IC No 160 450 25 200 625
Table 3. Mean values and coefficients of variation of governing parameters of service life model used in case study.
Parameter Mean Coefficient of variation
(% ) Surface chlorides (kg/m3) 9 30 Diffusion coef. (10-13 m2/s) - NC - HPC - HPC-IC 18 8.1 5.0 30 30 30 Concrete cover depth (mm) 75 30 Chloride threshold (kg/m3) 0.7 30 Corrosion rate (μA/cm2
) - NC - HPC - HPC-IC 0.50 0.65 0.50 30 30 30 Bar spacing (mm) 200 5
Table 4. AASHTO description of condition states for concrete bridge decks with no surface protection and built with uncoated reinforcement. Condition
state
Description
1 The surface of the deck has no patched area and no spall in the deck surface. 2 The combined distress area (i.e. existing patches, delamination and spalling)
of the deck is less than 10%.
3 The combined distress area of the deck is between 10% and 25%. 4 The combined distress area of the deck is between 25% and 50%. 5 The combined distress area of the deck is more than 50%.
Table 5. Costs of maintenance activities used in case study. Activity type Unit cost
($/m2) Routine inspection 2 Non-destructive evaluation 20 Protection 20 Patch repair 200 Replacement
(disposal and reconstruction)
350 + unit cost of reconstruction
Fig. 1. Minimum amount of internal curing water for maximum hydration
and minimum self-desiccation during cement hydration (adapted from RILEM TC-196, 2007).
0.00 0.02 0.04 0.06 0.08 0.0 0.1 0.2 0.3 0.4 0.5 (w /c ) IC (w/c) tot 0.36 0.42 0.064 αmax= 1 IC water needed to reach max. hydration
w/c 0.36 αmax=
Fig. 2. Reduction of net shrinkage strain with increased quantity of internal curing water. (adapted from Cusson & Hoogeveen 2008)
-400 -300 -200 -100 0 0 5 10 15 20 25 N et s h ri n k ag e s tr ai n ( x 1 0 -6)
Sand replacement ratio (%) w/ceff= 0.34 w/cIC= 0.00 f'c7d = 50 MPa w/ceff= 0.32 w/cIC= 0.02 f'c7d = 50 MPa w/ceff= 0.30 w/cIC= 0.04 f'c7d = 54 MPa w/ceff= 0.28 w/cIC= 0.06 f'c7d = 57 MPa Mix-0% Mix-6% Mix-12% Mix-20% w/c tot= 0.34
Fig. 3. Measured total strains in unrestrained concrete specimens. -300 -200 -100 0 100 200 300 0 24 48 72 96 120 144 1 To ta l s tr a in ( x 1 0 -6)
Time after setting (hours)
Mix-0% Mix-6% Mix-12% Mix-20%
Total strain due to autogenous shrinkage and thermal effects
68
Fig. 4. Measured basic creep strains in restrained concrete specimens. -300 -200 -100 0 100 200 0 24 48 72 96 120 144 1 B a s ic cr e e p st ra in ( x 1 0 -6)
Time after setting (hours)
Mix-0%
Mix-6% Mix-12%
Mix-20%
Increase in tensile creep (restrained shrinkage) Increase in compressive creep (restrained expansion)
68
Fig. 5. Measured uniaxial stresses in restrained concrete specimens. -2 -1 0 1 2 3 4 5 0 24 48 72 96 120 144 St re s s ( M Pa )
Time after setting (hours)
Mix-0%
Mix-20%
(almost a third of the stress was due to autogenous shrinkage)
(almost none of the stress was due to autogenous shrinkage) Tensile strength
168 Thermal effects were important
(but similar) in both mixes
Cross-section of bridge
Elevation view of bridge
Cross-section of bridge slab
(reinforcement ratio = 0.3% each way, each mat)
Length = 35 m
Width = 13 m
200 mm
75 mm
200
Pier Girder Slab30 mm
D am age l ev el Time Early-age cracking Rebar corrosion Internal cracking Surface cracking Delamination or spalling Failure Service life
Corrosion initiation stage Propagation stage
E ar ly-age c rac k in g st age Cl-Cl- Cl- Cl -Cl -Shrinkage cracking Corrosion and
stress generation Concretedamage
Chloride diffusion
Fig. 8a. Chloride profiles in concrete slab after 20 years. 0 1 2 3 4 5 6 7 8 9 10 0 25 50 75 C h lo ri de c on ten t ( k g/ m 3) Depth (mm) Rebar depth Chloride threshold 100 NC HPC HPC-IC Critical zone 20 years
Fig. 8b. Chloride profiles in concrete slab after 40 years. 0 1 2 3 4 5 6 7 8 9 10 0 25 50 75 C h lo ri de c on ten t ( k g/ m 3) Depth (mm) Rebar depth Chloride threshold 100 NC HPC HPC-IC Critical zone 40 years
Fig. 8c. Chloride profiles in concrete slab after 60 years. 0 1 2 3 4 5 6 7 8 9 10 0 25 50 75 C h lo ri de c on ten t ( k g/ m 3) Depth (mm) Rebar depth Chloride threshold 100 NC HPC HPC-IC Critical zone 60 years