Publisher’s version / Version de l'éditeur:
Vous avez des questions? Nous pouvons vous aider. Pour communiquer directement avec un auteur, consultez la première page de la revue dans laquelle son article a été publié afin de trouver ses coordonnées. Si vous n’arrivez pas à les repérer, communiquez avec nous à PublicationsArchive-ArchivesPublications@nrc-cnrc.gc.ca.
Questions? Contact the NRC Publications Archive team at
PublicationsArchive-ArchivesPublications@nrc-cnrc.gc.ca. If you wish to email the authors directly, please see the first page of the publication for their contact information.
https://publications-cnrc.canada.ca/fra/droits
L’accès à ce site Web et l’utilisation de son contenu sont assujettis aux conditions présentées dans le site
LISEZ CES CONDITIONS ATTENTIVEMENT AVANT D’UTILISER CE SITE WEB.
Client Report (National Research Council of Canada. Construction), 2015-08-06
READ THESE TERMS AND CONDITIONS CAREFULLY BEFORE USING THIS WEBSITE.
https://nrc-publications.canada.ca/eng/copyright
NRC Publications Archive Record / Notice des Archives des publications du CNRC : https://nrc-publications.canada.ca/eng/view/object/?id=caaa5895-ebf0-4807-a5f9-38684e10de98 https://publications-cnrc.canada.ca/fra/voir/objet/?id=caaa5895-ebf0-4807-a5f9-38684e10de98
Archives des publications du CNRC
For the publisher’s version, please access the DOI link below./ Pour consulter la version de l’éditeur, utilisez le lien DOI ci-dessous.
https://doi.org/10.4224/23002859
Access and use of this website and the material on it are subject to the Terms and Conditions set forth at
Performance evaluation of proprietary drainage components and
sheathing membranes when subjected to climate loads, task 6:
hygrothermal performance of client wall assemblies: results for wall
components having Medium Resistant (MR) Mould Growth Sensitivity
Class
CONSTRUCTION
Performance Evaluation of Proprietary
Drainage Components and Sheathing
Membranes when Subjected to Climate Loads
Task 6
— Hygrothermal Performance of Client Wall
Assemblies: Results for wall components having
Medium Resistant (MR) Mould Growth Sensitivity Class
Hamed H. Saber
Table of Contents
Table of Contents ... i
List of Figures ... iii
List of Tables ... vii
Acknowledgements ... ix
Summary ... xi
1.0 Mould Index Criterion ... 1
2.0 Results Derived from Hygrothermal Simulations ... 3
2.1. Results from Simulation – Client A Drainage System ... 6
2.2. Results from Simulation – Client B Drainage System ... 13
2.3. Results from Simulation – Client C Drainage System ... 16
2.4. Results from Simulation – Client D Drainage System ... 23
2.5. Results from Simulation – Client E Drainage System ... 30
2.6. Results from Simulation – Client F Drainage System ... 37
2.7. Results from Simulation – Client G Drainage System ... 40
2.8. Results from Simulation – Client H Drainage System ... 47
2.9. Results from Simulation – Client I Drainage System ... 50
2.10. Results from Simulation – Client J Drainage System ... 57
2.11. Results from Simulation – Client K Drainage System ... 60
3.0 Conclusions ... 63
List of Figures
Figure 1 - Reference Wall: Response of OSB component (1 mm sliver on exterior OSB surface) to climate loads of: (a) Tofino (BC), (b) Vancouver (BC), and (c) St John’s (NL); response given as the dependence of mould index values on time for sensitivity classes “S” and “MR” 4 Figure 2 - Reference Wall: Response of OSB component (1 mm sliver on exterior OSB surface) to
climate loads of Tofino (BC), Vancouver (BC), and St John’s (NL); response given as average and maximum mould index values for sensitivity classes “S” and “MR” ... 5 Figure 3 - Client A Wall: Response of OSB component to climate loads of Tofino (BC); response given
as mould index value for sensitivity class “MR” ... 7 Figure 4 – Reference and Client A Walls: Response of OSB component (1 mm sliver on exterior OSB
surface) to climate loads of Tofino (BC); response given as mould index value for sensitivity class “MR” ... 8 Figure 5 - Client A Wall: Response of OSB component to climate loads of Vancouver (BC); response
given as mould index value for sensitivity class “MR”... 9 Figure 6 – Reference and Client A Walls: Response of OSB component (1 mm sliver on exterior OSB
surface) to climate loads of Vancouver (BC); response given as mould index value for sensitivity class “MR” ... 10 Figure 7 - Client A Wall: Response of OSB component to climate loads of St John’s (NL); response given
as mould index value for sensitivity class “MR” ... 11 Figure 8 – Reference and Client A Walls: Response of OSB component (1 mm sliver on exterior OSB
surface) to climate loads of St John’s (NL); response given as mould index value for
sensitivity class “MR” ... 12 Figure 9 – Client B Wall: Response of OSB component to climate loads of Tofino, and Vancouver (BC)
and St John’s (NL) response given as mould index value for sensitivity class “MR” ... 14 Figure 10 – Reference and Client B Walls: Response of Gypsum component (1 mm sliver on exterior
Gypsum surface) to climate loads of (from left to right) Tofino and Vancouver (BC) and St John’s NF; response given as MIDX value for sensitivity class “MR” ... 15 Figure 11 - Client C Wall: Response of OSB component to climate loads of Tofino (BC) for Moisture
load applied between Building Paper and Cladding; response given as mould index value for sensitivity class “MR” ... 17 Figure 12 - Client C Wall: Response of OSB component to climate loads of Tofino (BC) for 50% of
Moisture Load applied to sheathing membrane; response given as mould index value for sensitivity class “MR” ... 17 Figure 13 – Client C Wall: Response of OSB component (1 mm sliver on exterior OSB surface) to
climate loads of Tofino (BC); response given as mould index value for sensitivity class “MR” ... 18 Figure 14 - Client C Wall: Response of OSB component to climate loads of Vancouver (BC) for Moisture
load applied between Building Paper and Cladding; response given as mould index value for sensitivity class “MR” ... 19
List of Figures
Figure 15 - Client C Wall: Response of OSB component to climate loads of Vancouver (BC) for 50% of Moisture Load applied to sheathing membrane; response given as mould index value for sensitivity class “MR” ... 19 Figure 16 – Client C Wall: Response of OSB component (1 mm sliver on exterior OSB surface) to
climate loads of Vancouver (BC); response given as mould index value for sensitivity class “MR” ... 20 Figure 17 - Client C Wall: Response of OSB component to climate loads of St John’s (NL) for Moisture
load applied between Building Paper and Cladding; response given as mould index value for sensitivity class “MR” ... 21 Figure 18 - Client C Wall: Response of OSB component to climate loads of St John’s (NL) for 50% of
Moisture Load applied to sheathing membrane; response given as mould index value for sensitivity class “MR” ... 21 Figure 19 – Client C Wall: Response of OSB component (1 mm sliver on exterior OSB surface) to
climate loads of Vancouver (BC); response given as mould index value for sensitivity class “MR” ... 22 Figure 20 - Client D Wall: Response of OSB component to climate loads of Tofino (BC); response given
as mould index value for sensitivity class “MR” ... 24 Figure 21 – Reference and Client D Walls: Response of OSB component (1 mm sliver on exterior OSB
surface) to climate loads of Tofino (BC); response given as mould index value for sensitivity class “MR” ... 25 Figure 22 - Client D Wall: Response of OSB component to climate loads of Vancouver (BC); response
given as mould index value for sensitivity class “MR”... 26 Figure 23 – Reference and Client D Walls: Response of OSB component (1 mm sliver on exterior OSB
surface) to climate loads of Vancouver (BC); response given as mould index value for sensitivity class “MR” ... 27 Figure 24 - Client D Wall: Response of OSB component to climate loads of St John’s (NL); response
given as mould index value for sensitivity class “MR”... 28 Figure 25 – Reference and Client D Walls: Response of OSB component (1 mm sliver on exterior OSB
surface) to climate loads of St John’s (NL); response given as mould index value for
sensitivity class “MR” ... 29 Figure 26 - Client E Wall: Response of OSB component to climate loads of Tofino (BC); response given
as mould index value for sensitivity class “MR” ... 31 Figure 27 – Reference & Client E Walls: Response of OSB to climate loads of Tofino (BC); response
given as mould index value for sensitivity class “MR”... 32 Figure 28 - Client E Wall: Response of OSB component to climate loads of Vancouver (BC); response
given as mould index value for sensitivity class “MR”... 33 Figure 29 – Reference & Client E Walls: Response of OSB to climate loads of Vancouver (BC); response given as mould index value for sensitivity class “MR”... 34 Figure 30 - Client E Wall: Response of OSB component to climate loads of St John’s (NL); response
List of Figures
Figure 31 – Reference & Client E Walls: Response of OSB to climate loads of St John’s (NL); response given as mould index value for sensitivity class “MR”... 36 Figure 32 - Client F Wall: Response of OSB component to climate loads of Tofino, and Vancouver (BC)
and St John’s (NL); response given as mould index value for sensitivity class “MR” ... 38 Figure 33 - Reference and Client F Walls: Response of OSB component (1 mm sliver on exterior OSB
surface) to climate loads of (from left to right) Tofino and Vancouver (BC) and St John’s (NL); response given as mould index value for sensitivity class “MR” ... 39 Figure 34 - Client G Wall: Response of OSB component to climate loads of Tofino (BC); response given
as mould index value for sensitivity class “MR” ... 41 Figure 35 – Reference & Client G Walls: Response of OSB to climate loads of Tofino (BC); response
given as mould index value for sensitivity class “MR”... 42 Figure 36 - Client G Wall: Response of OSB component to climate loads of Vancouver (BC); response
given as mould index value for sensitivity class “MR”... 43 Figure 37 – Reference & Client G Walls: Response of OSB to climate loads of Vancouver (BC); response
given as mould index value for sensitivity class “MR”... 44 Figure 38 - Client G Wall: Response of OSB component to climate loads of St John’s (NL); response
given as mould index value for sensitivity class “MR”... 45 Figure 39 – Reference & Client G Walls: Response of OSB to climate loads of St John’s (NL); response
given as mould index value for sensitivity class “MR”... 46 Figure 40 - Client H Wall: Response of OSB component to climate loads of Tofino, and Vancouver (BC), and St John’s (NL); response given as mould index value for sensitivity class “MR” ... 48 Figure 41 – Reference and Client H Walls: Response of OSB component (1 mm sliver on exterior OSB
surface) to climate loads of (from left to right) Tofino and Vancouver (BC) and St John’s (NL); response given as mould index value for sensitivity class “MR” ... 49 Figure 42 - Client I Wall: Response of OSB component to climate loads of Tofino (BC); response given
as mould index value for sensitivity class “MR” ... 51 Figure 43 – Reference & Client I Walls: Response of OSB to climate loads of Tofino (BC); response
given as mould index value for sensitivity class “MR”... 52 Figure 44 - Client I Wall: Response of OSB component to climate loads of Vancouver (BC); response
given as mould index value for sensitivity class “MR”... 53 Figure 45 – Reference & Client I Walls: Response of OSB to climate loads of Vancouver (BC); response
given as mould index value for sensitivity class “MR”... 54 Figure 46 - Client I Wall: Response of OSB component to climate loads of St John’s (NL); response
given as mould index value for sensitivity class “MR”... 55 Figure 47 – Reference & Client I Walls: Response of OSB to climate loads of St John’s (NL); response
given as mould index value for sensitivity class “MR”... 56 Figure 48 - Client J Wall: Response of OSB component to climate loads of Tofino, and Vancouver (BC)
and St John’s (NL); response given as mould index value for sensitivity class “MR” ... 58 Figure 49 – Reference and Client J Walls: Response of OSB component (1 mm sliver on exterior OSB
surface) to climate loads of (from left to right) Tofino and Vancouver (BC) and St John’s (NL); response given as mould index value for sensitivity class “MR” ... 59
List of Figures
Figure 50 - Client K Wall: Response of OSB component to climate loads of Tofino, and Vancouver (BC) and St John’s (NL); response given as mould index value for sensitivity class “MR” ... 61 Figure 51 – Reference and Client K Walls: Response of OSB component (1 mm sliver on exterior OSB
surface) to climate loads of (from left to right) Tofino and Vancouver (BC) and St John’s (NL); response given as mould index value for sensitivity class “MR” ... 62
List of Tables
Table 1 - Description of Mould Index (M) levels [2, 3, 4] ... 2 Table 2 - Mould growth sensitivity classes and some corresponding materials [2]... 2 Table 3 - Mould growth sensitivity classes for different materials of wall assemblies ... 2 Table 4 – Average & maximum values of MIDX for different locations in Reference (REF) and Client A
Walls, subjected to climate loads of Tofino (BC); Moisture Load placed between the Building paper and: (i) Cladding; (ii) Drainage medium; response given as MIDX value for sensitivity
class “MR” ... 8 Table 5 – Average & maximum values of MIDX for different locations in Reference (REF) and Client A
Walls, subjected to climate loads of Vancouver (BC); Moisture Load placed between the Building paper and: (i) Cladding; (ii) Drainage medium; response given as MIDX value for
sensitivity class “MR” ... 10 Table 6 – Average & maximum values of MIDX for different locations in Reference (REF) and Client A
Walls, subjected to climate loads of St John’s (NL); Moisture Load placed between the Building paper and: (i) Cladding; (ii) Drainage medium; response given as MIDX value for
sensitivity class “MR” ... 12 Table 7 – Response of Reference (REF) and Client B Walls to climate loads Tofino and Vancouver (BC)
and St John’s (NL) Average and maximum values of MIDX for different locations in walls in which Moisture Load was placed between Building paper and cladding; response given as
MIDX value for sensitivity class “MR” ... 15
Table 8 – Client C Wall: Average and maximum values of MIDX for different locations of Client C in which the Moisture Load of Tofino (BC) was placed between the Building paper and: (i) Cladding; (ii) Drainage medium; response given as MIDX value for sensitivity class “MR” ... 18
Table 9 – Client C Wall: Average and maximum values of MIDX for different locations of Client C in which the Moisture Load of Vancouver (BC) was placed between the Building paper and: (i) Cladding; (ii) Drainage medium; response given as MIDX value for sensitivity class “MR” ... 20
Table 10 – Client C Wall: Average and maximum values of MIDX for different locations of Client C in which the Moisture Load of Vancouver (BC) was placed between the Building paper and: (i) Cladding; (ii) Drainage medium; response given as MIDXvalue for sensitivity class “MR” ... 22
Table 11– Average & maximum values of MIDX for different locations in Reference (REF) and Client D walls; Moisture Load of Tofino (BC) placed between Building Paper and: (i) Cladding; (ii) Drainage medium; response given as MIDXvalue for sensitivity class “MR” ... 25
Table 12– Average & maximum values of MIDX for different locations in Reference (REF) and Client D walls; Moisture Load of Vancouver (BC) placed between Building Paper and: (i) Cladding; (ii) Drainage medium; response given as MIDXvalue for sensitivity class “MR” ... 27
Table 13– Average & maximum values of MIDX for different locations in Reference (REF) and Client D walls; Moisture Load of St John’s (NL) placed between Building Paper and: (i) Cladding; (ii) Drainage medium; response given as MIDX value for sensitivity class “MR” ... 29
Table 14 – Response of Reference & Client E Walls to climate loads of Tofino (BC); Average &
maximum values of MIDX for wall locations where: (i) ML* placed between building paper & Cladding; (ii) 50 % ML on building paper; system vented; (iii) 50 % ML on building paper; system ventilated ... 32 Table 15 – Response of Reference & Client E Walls to climate loads of Vancouver (BC); Average &
maximum values of MIDX for wall locations where: (i) ML* placed between building paper & Cladding; (ii) 50 % ML on building paper; system vented; (iii) 50 % ML on building paper; system ventilated ... 34
List of Tables
Table 16 – Response of Reference & Client E Walls to climate loads of St John’s (NL); Average & maximum values of MIDX for wall locations where: (i) ML* placed between building paper & Cladding; (ii) 50 % ML on building paper; system vented; (iii) 50 % ML on building paper; system ventilated ... 36 Table 17 – Response of Reference (REF) and Client F Walls to climate loads Tofino and Vancouver (BC)
and St John’s (NL) Average and maximum values of MIDX for different locations in walls in which Moisture Load was placed between Building paper and cladding ... 39 Table 18 – Response of Reference & Client G Walls to climate loads of Tofino (BC); Average &
maximum values of MIDX for wall locations where: (i) ML* placed between PP fabric & Cladding; (ii) 50 % ML on building paper; system vented; (iii) 50 % ML on building paper; system ventilated ... 42 Table 19 – Response of Reference & Client G Walls to climate loads of Vancouver (BC); Average &
maximum values of MIDX for wall locations where: (i) ML* placed between PP fabric & Cladding; (ii) 50 % ML on building paper; system vented; (iii) 50 % ML on building paper; system ventilated ... 44 Table 20 – Response of Reference & Client G Walls to climate loads of St John’s (NL); Average &
maximum values of MIDX for wall locations where: (i) ML* placed between PP fabric & Cladding; (ii) 50 % ML on building paper; system vented; (iii) 50 % ML on building paper; system ventilated ... 46 Table 21 – Response of Reference (REF) and Client H Walls to climate loads Tofino and Vancouver
(BC) and St John’s (NL) Average and maximum values of MIDX for different locations in walls in which Moisture Load was placed between Building paper and cladding ... 49 Table 22– Response of Reference & Client I Walls to climate loads of Tofino (BC); Average & maximum
values of MIDX for wall locations where: (i) ML* placed between building paper & Cladding; (ii) 50 % ML on building paper; system vented; (iii) 50 % ML on building paper; system ventilated ... 52 Table 23– Response of Reference & Client I Walls to climate loads of Vancouver (BC); Average &
maximum values of MIDX for wall locations where: (i) ML* placed between building paper & Cladding; (ii) 50 % ML on building paper; system vented; (iii) 50 % ML on building paper; system ventilated ... 54 Table 24– Response of Reference & Client I Walls to climate loads of St John’s (NL); Average &
maximum values of MIDX for wall locations where: (i) ML* placed between building paper & Cladding; (ii) 50 % ML on building paper; system vented; (iii) 50 % ML on building paper; system ventilated ... 56 Table 25 – Response of Reference (REF) and Client J Walls to climate loads Tofino and Vancouver (BC) and St John’s (NL) Average and maximum values of MIDX for different locations in walls in which Moisture Load was placed between Building paper and cladding ... 59 Table 26 – Response of Reference (REF) and Client K Walls to climate loads Tofino and Vancouver
(BC) and St John’s (NL) Average and maximum values of MIDX for different locations in walls in which Moisture Load was placed between Building paper and cladding ... 62 Table 27 – Summary of Simulation Results of Reference and Respective Client Wall Assemblies for the
Acknowledgements
The author of this wishes to extend thanks to the Air Barrier Association of American (ABAA) for having managed and arranged support for this project and in particular, to Mr. Laverne Dalgleish for his highly proficient handling of all technical and non-technical issues that arose over the course of the project. As well, acknowledgment is made of project support, technical meeting participation and the many and very useful contributions made by the respective project partners, and that included:
Benjamin Obdyke Incorporated
Canadian Concrete Masonry Producers Association Cosella-Dorken
DuPont Tyvek Weatherization Systems HAL Industries Incorporated
Home Protection Office of British Columbia – HPO Keene Building Products™
GreenGuard® Building Products (formerly Pactiv Building Products) Roxul Incorporated
STO Corporation
TYPAR® Weather Protection System (Polymer Group Incorporated)
Our thanks are also extended to our colleagues within NRC-Construction for their technical support, advice, and feedback during the course of this project and who helped support the work described in this Task report including: K. Abdulghani, M. Armstrong, S. Bundalo-Perc, S. M. Cornick, B. Di Lenardo, G. Ganapathy, W. Maref, P. Mukhopadhyaya, M. Nicholls, H. H. Saber, M.C. Swinton and
Summary
A Reference assembly and a series of 11 client wall assemblies were developed as part of the project “Performance Evaluation of Proprietary Drainage Components and Sheathing Membranes when Subjected to Climate Loads”.
The purpose of this project was to assess the performance of walls with drainage components and sheathing membranes (drainage system) in their ability to provide sufficient drainage and drying in Canadian climates with a moisture index (MI) greater than 0.9 and less than 3400 degree-days, or MI greater than 1.0 and degree days ≥ 3400 (primarily coastal areas). In these regions, the 2010 National Building Code of Canada (NBC) requires a capillary break behind all Part 9 claddings and conforming to the requirements given in § 9.27 (Cladding) of the NBC. Currently, acceptable solutions to the NBC capillary break requirement include:
(a) A drained and vented air space not less than 10 mm deep behind the cladding;
(b) An open drainage material behind the cladding, not less than 10 mm thick and with a cross-sectional area that is not less than 80% open;
(c) A cladding loosely fastened, with an open cross section (i.e. vinyl, aluminum siding);
(d) A masonry cavity wall or masonry veneer constructed according to § 9.20 (i.e. 25 mm vented air space).
In this project, the performance of proposed alternative solutions for the capillary break was compared through laboratory evaluation and modeling activities to the performance of a wall built to minimum NBC requirements (Reference wall assembly). The proposed drainage system would be deemed an alternative solution to the capillary break requirement in the NBC for use with current code compliant Part 9 claddings provided it exhibited better or equal moisture performance as compared to a NBC-compliant Reference wall assembly.
In This Report— Results from simulation of the Client’s and the Reference wall are provided over a two year period to climate conditions of Tofino (BC), Vancouver (BC), and St John’s (NL). For each of these locations, results are provided using the previously described performance criterion “Mould index (MIDX)” when the sheathing panel component (OSB or gypsum – Type X) was considered resistive to mould growth and was categorised as having a mould growth sensitivity class of “Medium Resistant” (MR). The corresponding results derived from simulation for the sheathing panel categorised as a mould growth sensitivity class Sensitive “S”, can be found in the companion Task 6 report [1].
1
Performance Evaluation of Proprietary Drainage Components and
Sheathing Membranes when Subjected to Climate Loads
–
Task 6
– Hygrothermal Performance of Client Wall Assemblies:
Results for wall components having
Medium Resistant (MR) Mould Growth Sensitivity Class
Authored by: Hamed H. Saber
A Report for the
AIR BARRIER ASSOCIATION OF AMERICA (ABAA)
1600 BOSTON-PROVIDENCE Highway
WAYPOLE, MA 02081
USA
ATT: Mr. Laverne Dalgleish
National Research Council Canada Ottawa ON K1A 0R6 Canada
26 August, 2015
This report may not be reproduced in whole or in part without the written consent of both the client and the National Research Council of Canada.
Performance Evaluation of Proprietary Drainage Components and
Sheathing Membranes when Subjected to Climate Loads
–
Task 6
– Hygrothermal Performance of Client Wall Assemblies:
Results for wall components having
Medium Resistant (MR) Mould Growth Sensitivity Class
Final Report Forming Part of Task 6 Hamed H. Saber
1.0 Mould Index Criterion
The development of the mould index has been on-going for several years with the most recent work, as was used in this project, having being provided by Ojanen et al. [2] Hukka & Viitanen [3] and
Viitanen & Ojanen [4].
A description of the mould index levels as relate to growth rates is provided in Table 1, whereas the mould growth sensitivity classes for specified materials and corresponding minimum levels of relative humidity needed for mould growth are provide in Table 2. The mould index levels range in value from 0 to 6, with 0 being equivalent to no growth and 6 indicating 100% coverage of either heavy or tight mould growth. The visual identification of mould growth on surfaces is given an index level value of 3 or above.
The sensitivity of different construction materials to the formation of mould growth, as provided in Table 2, was divided into four (4) classes: Very Sensitive “VS”, Sensitive “S”, Medium Resistant “MR”, and Resistant “R”. The assumed correspondence of sensitivity class for materials located within a wall assembly as modelled in this study is given in Table 3. More specifically, the sensitivity class for the sheathing panel (e.g. OSB) was considered “Sensitive”, whereas the sensitivity class of materials in the cavity insulation (i.e. fiber-based insulation) was considered “Medium Resistant”.
Note that a construction material can be chemically (or by other means) treated to be resistive for the mould growth, resulting in changing the classification of this material from a certain mould class to another. In this project as provided in the previous reports of Task 6 [5; 6], only the “Sensitive” mould
2
Ojanen, T., Viitanen, H.A., Peuhkuri, R, Lähdesmäki, K., Vinha, J., and Salminen, K., "Mold Growth Modeling of Building Structures Using Sensitivity Classes of Materials", 11th Itnl. Conference on Thermal Performance of the Exterior Envelopes of Whole Buildings XI (Clearwater, (FL), USA, December-05-10), 10 p., 2010.
3
Hukka, A., and Viitanen, H. A. (1999), A mathematical model of mould growth on wooden material, Wood Science and Technology, Volume 33, Issue 6, pp 475-485.
4
Viitanen and Ojanen (2007), Improved Model to Predict Mold Growth in Building Materials, Proceedings of the Buildings X International Conference on the Thermal Performance of the Exterior Envelopes of Whole Buildings (December 2-7), Clearwater Beach, Florida, 8 p.
5
Saber, H.H., and Lacasse, M.A., Performance Evaluation of Proprietary Drainage Components and Sheathing Membranes when Subjected to Climate Loads – Task 6 – Hygrothermal Performance of NBC-Compliant Reference Wall; Client Report A1-000030.07; National Research Council Canada; Ottawa, ON; 59 p.
6
Saber, H.H., and Lacasse, M.A., Performance Evaluation of Proprietary Drainage Components and Sheathing Membranes when Subjected to Climate Loads, Task 6 — Hygrothermal Performance of Client Wall Assemblies for Selected Canadian Locations, Client Report A1-000030.08, NRC-Construction, National Research Council of Canada, Ottawa, Canada, August 2015.
growth sensitivity class was considered for the sheathing layer (OSB or gypsum – type X) when comparing the relative performance of the respective wall assemblies. In this report, however,
information has also been provided on the response of the sheathing layers in the wall assembly if these were considered as being of “Medium Resistant” class.
Table 1 - Description of Mould Index (M) levels [2, 3, 4]
M
Mould Index (M) - Description of Growth Rate0
No growth1
Small amounts of mould on surface (microscope), initial stages of local growth2
Several local mould growth colonies on surface (microscope)3
Visual findings of mould on surface, < 10% coverage, or < 50% coverage of mould (microscope)4
Visual findings of mould on surface, 10%–50% coverage, or > 50% coverage of mould (microscope)5
Plenty of growth on surface, > 50% coverage (visual)6
Heavy and tight growth, coverage about 100%Table 2 - Mould growth sensitivity classes and some corresponding materials [2]
Sensitivity Class Materials RHmin (%)*
Very Sensitive Pine sapwood 80
Sensitive Glued wooden boards, PUR with paper surface, spruce 80
Medium Resistant Concrete, aerated and cellular concrete, glass wool, polyester wool 85
Resistant PUR with polished surface 85 * Minimum relative humidity needed for mould growth
Table 3 - Mould growth sensitivity classes for different materials of wall assemblies
Sensitivity Class Layers within Wall Assemblies RHmin (%)*
Very Sensitive “VS” 80
Sensitive “S” Top plate, bottom plate, OSB[7], gypsum – type X [7] 80
Medium Resistant “MR” Mineral or glass fibre, gypsum, membranes 85
Resistant “R” 85
* Minimum relative humidity needed for mould growth
2.0 Results Derived from Hygrothermal Simulations
In the companion Task 6 reports [5, 6], for each of the Client wall assemblies, an overview of the Client’s drainage system was provided to permit assessing the expected response of wall components to moisture loads within the drainage cavity, given the performance attributes of the cavity, that included the size and drainage-retention response of the cavity as well as the type of sheathing membrane used to protect the sheathing layer (OSB or gypsum – type X).
In those reports, the results from simulation of the Client’s and the Reference walls were provided over a two year period, when these walls were subjected to climate loads of Tofino (BC) (MI = 3.36),
Vancouver (BC) (MI = 1.44), and St John’s (NL) (MI = 1.41), for wall components having a mould growth sensitivity class assigned as Sensitive, “S”. The corresponding results for all wall systems investigated in this project and provided in this report are for wall components having a mould growth sensitivity class assigned as Medium Resistant, “MR”.
Examples of simulation results and showing values of the mould index of a 1 mm thick “sliver” located on the exterior surface of the OSB sheathing panel and for which the wall components were assigned mould growth sensitivity classes of “S” and “MR” are shown in Figure 1 for the reference wall that was subjected to the climate loads of Tofino (Figure 1a), Vancouver (Figure 1b), and St John’s (Figure 1c). As shown in these figures, the trends of the dependence of the mould index on time for both mould classes are the same. However, the values of mould index for components assigned the “S” mould sensitivity class is greater than that for those assigned as “MR” class. For example, as shown in Figure 2a, the values of the average mould index in the OSB sliver (1 mm thick) for the “MR” class are 59%, 56% and 55% that of the “S” class when the Reference wall was subjected to the climate loads of Tofino, Vancouver and St John’s, respectively. The corresponding values for the maximum mould index for the “MR” class are 65%, 64% and 62% that of the “S” class (see Figure 2b).
For all wall systems, the next subsections provide tables and plots of all results of Mould Index (MIDX)
values as a function of time for the OSB/gypsum – type X sheathing panel and represent values for a mould sensitivity class “MR”. By comparing the performance of each of the Client’s wall assemblies to that of the Reference wall, the trends for values of mould index of wall components, as provided in these tables and plots, indicate that for components assigned as “MR” sensitivity class, the values are similar to those previously obtained for wall components assigned as “S” sensitivity class (more details are provided in the companion Task 6 Reports [5, 6]).
Figure 1 - Reference Wall: Response of OSB component (1 mm sliver on exterior OSB surface) to climate loads of: (a) Tofino (BC), (b) Vancouver (BC), and (c) St John’s (NL); response given as the dependence of
mould index values on time for sensitivity classes “S” and “MR”
0 1 2 3 4 5 6 0 90 180 270 360 450 540 630 720 810 Reference Wall (MR) Reference Wall (S)
(b) Vancouver
M
o
u
ld
In
d
e
x,
M
0 1 2 3 4 5 6 0 90 180 270 360 450 540 630 720 810 Reference Wall (MR)Reference Wall (S)
(c) St John's
Time (day)
M
o
u
ld
In
d
e
x
,
M
0 1 2 3 4 5 6 0 90 180 270 360 450 540 630 720 810 Reference Wall (MR) Reference Wall (S)(a) Tofino
M
o
u
ld
In
d
e
x,
M
Figure 2 - Reference Wall: Response of OSB component (1 mm sliver on exterior OSB surface) to climate loads of Tofino (BC), Vancouver (BC), and St John’s (NL); response given as average and maximum mould
2.1. Results from Simulation
– Client A Drainage System
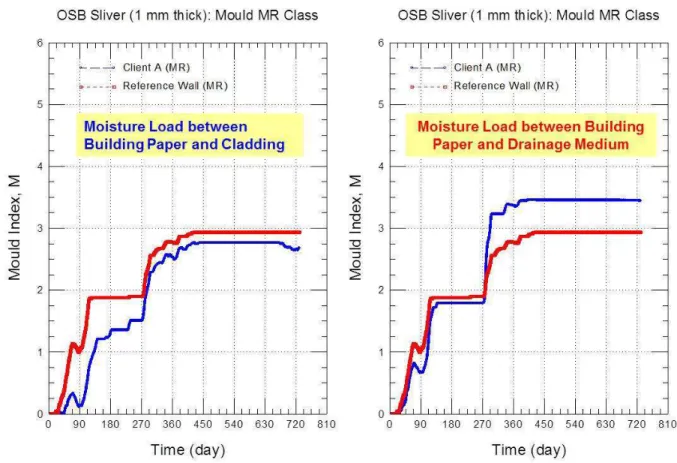
The response of the Client A’s wall assembly to the climate loads of Tofino (BC), Vancouver (BC) and St John’s (NL) are provided in Figure 3 to Figure 8 and in Table 4 to Table 6. More specifically, the variation in values for Mould Index (MIDX) over the course of the two year simulation period (average
year followed by wet year) and in respect to the different locations in the wall, are provided in this section for wall components having a mould growth sensitivity class assigned as Medium Resistant “MR”. The corresponding results for wall components having a mould growth sensitivity class assigned as Sensitive “S” are available in the companion Task 6 reports [5, 6]. In instances where sheathing panels (e.g. OSB) have been chemically, or by other means, treated to protect the panel from mould growth, the sheathing panel may indeed fall within the “MR” mould growth sensitivity class. Hence, the following results for the hygrothermal performance of Client A’s wall system may be applicable in respect to values of MIDX.
Figure 3 - Client A Wall: Response of OSB component to climate loads of Tofino (BC); response given as mould index value for sensitivity class “MR”
Figure 4 – Reference and Client A Walls: Response of OSB component (1 mm sliver on exterior OSB surface) to climate loads of Tofino (BC); response given as mould index value for sensitivity class “MR”
Table 4 – Average & maximum values of MIDX for different locations in Reference (REF) and Client A Walls, subjected to climate loads of Tofino (BC); Moisture Load placed between the Building paper and: (i)
Cladding; (ii) Drainage medium; response given as MIDXvalue for sensitivity class “MR” REF - Layer or Interface REF - Layer or Interface
M
IDX OSB Sliver (1 mm)Back OSB (10 mm) Whole OSB (11 mm) OSB-Fibre Interface OSB Sliver (1 mm) Back OSB (10 mm) Whole OSB (11 mm) OSB-Fibre Interface Average 2.300 1.156 1.234 0.535 2.300 1.156 1.234 0.535 Maximum 2.933 1.934 1.999 1.415 2.933 1.934 1.999 1.415
Client A (i) - Layer or Interface Client A (ii) - Layer or Interface
M
IDX OSB Sliver (1 mm)Back OSB (10 mm) Whole OSB (11 mm) OSB-Fibre Interface OSB Sliver (1 mm) Back OSB (10 mm) Whole OSB (11 mm) OSB-Fibre Interface Average 1.962 0.968 1.041 0.397 2.568 1.580 1.652 0.888 Maximum 2.767 1.779 1.842 1.250 3.455 2.849 2.889 2.402
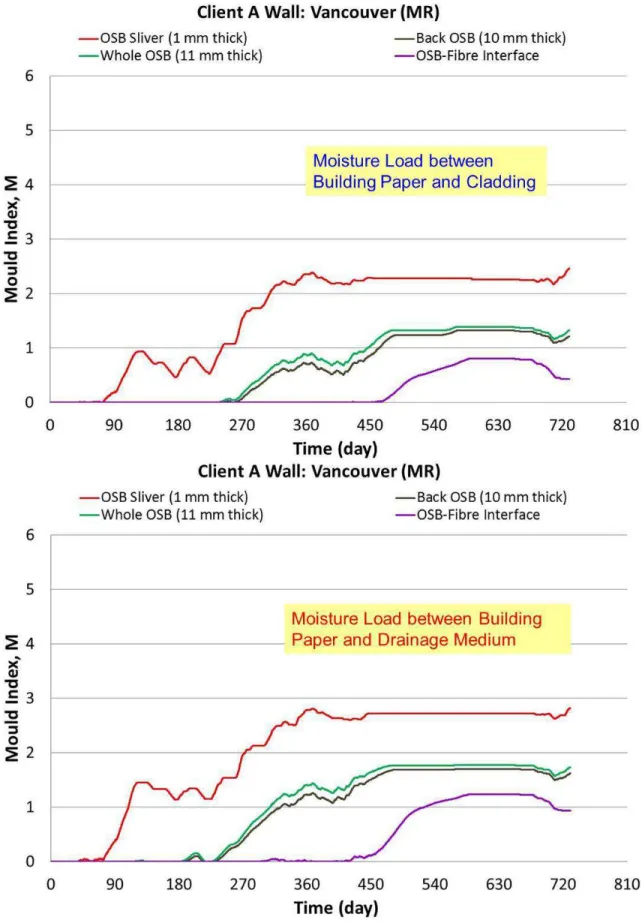
Figure 5 - Client A Wall: Response of OSB component to climate loads of Vancouver (BC); response given as mould index value for sensitivity class “MR”
Figure 6 – Reference and Client A Walls: Response of OSB component (1 mm sliver on exterior OSB surface) to climate loads of Vancouver (BC); response given as mould index value for sensitivity class “MR”
Table 5 – Average & maximum values of MIDX for different locations in Reference (REF) and Client A Walls, subjected to climate loads of Vancouver (BC); Moisture Load placed between the Building paper and: (i)
Cladding; (ii) Drainage medium; response given as MIDXvalue for sensitivity class “MR” REF - Layer or Interface REF - Layer or Interface
M
IDX OSB Sliver (1 mm)Back OSB (10 mm) Whole OSB (11 mm) OSB-Fibre Interface OSB Sliver (1 mm) Back OSB (10 mm) Whole OSB (11 mm) OSB-Fibre Interface Average 1.959 0.835 0.910 0.314 1.959 0.835 0.910 0.314 Maximum 2.714 1.525 1.601 1.016 2.714 1.525 1.601 1.016
Client A (i) - Layer or Interface Client A (ii) - Layer or Interface
M
IDX OSB Sliver (1 mm)Back OSB (10 mm) Whole OSB (11 mm) OSB-Fibre Interface OSB Sliver (1 mm) Back OSB (10 mm) Whole OSB (11 mm) OSB-Fibre Interface Average 1.581 0.611 0.682 0.218 1.983 0.911 0.986 0.387 Maximum 2.455 1.316 1.379 0.806 2.815 1.700 1.766 1.236
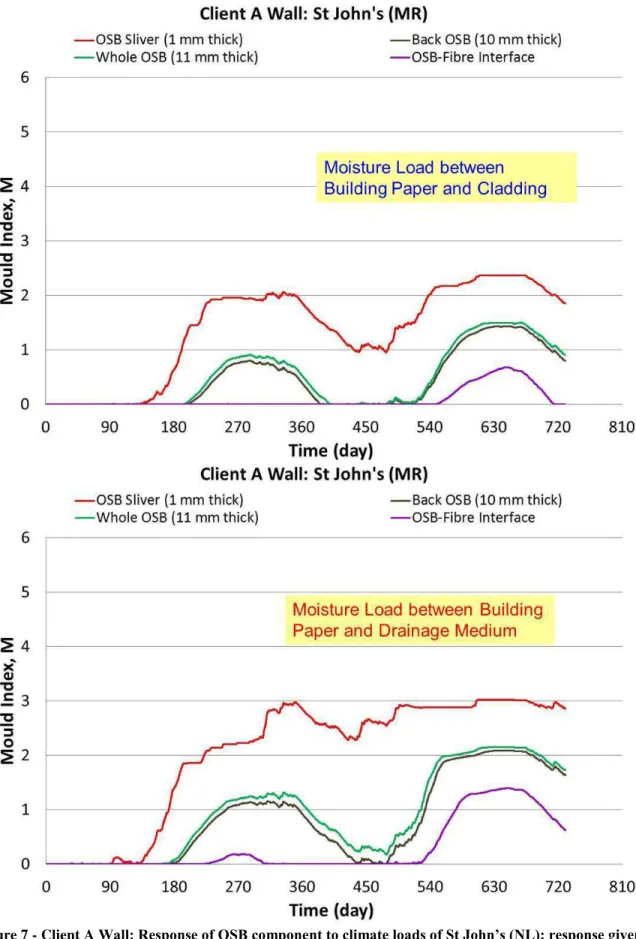
Figure 7 - Client A Wall: Response of OSB component to climate loads of St John’s (NL); response given as mould index value for sensitivity class “MR”
Figure 8 – Reference and Client A Walls: Response of OSB component (1 mm sliver on exterior OSB surface) to climate loads of St John’s (NL); response given as mould index value for sensitivity class “MR”
Table 6 – Average & maximum values of MIDX for different locations in Reference (REF) and Client A Walls, subjected to climate loads of St John’s (NL); Moisture Load placed between the Building paper and: (i)
Cladding; (ii) Drainage medium; response given as MIDXvalue for sensitivity class “MR” REF - Layer or Interface REF - Layer or Interface
M
IDX OSB Sliver (1 mm)Back OSB (10 mm) Whole OSB (11 mm) OSB-Fibre Interface OSB Sliver (1 mm) Back OSB (10 mm) Whole OSB (11 mm) OSB-Fibre Interface Average 1.692 0.650 0.723 0.173 1.692 0.650 0.723 0.173 Maximum 2.613 1.643 1.722 0.929 2.613 1.643 1.722 0.929
Client A (i) - Layer or Interface Client A (ii) - Layer or Interface
M
IDX OSB Sliver (1 mm)Back OSB (10 mm) Whole OSB (11 mm) OSB-Fibre Interface OSB Sliver (1 mm) Back OSB (10 mm) Whole OSB (11 mm) OSB-Fibre Interface Average 1.364 0.434 0.491 0.090 2.024 0.807 0.915 0.295 Maximum 2.367 1.428 1.498 0.679 3.014 2.079 2.147 1.391
2.2. Results from Simulation
– Client B Drainage System
The response of the Client B wall assembly to the climate loads of Tofino (BC), Vancouver (BC) and St John’s (NL) are provided in Figure 9 and Figure 10 and in Table 7. More specifically, the variation in values for Mould Index (MIDX) over the course of the two year simulation period (average year followed
by wet year) and in respect to the different locations in the wall, are provided in this section for wall components having a mould growth sensitivity class assigned as Medium Resistant “MR”. The
corresponding results for wall components having a mould growth sensitivity class assigned as Sensitive “S” are available in the companion Task 6 reports [5, 6]. In instances where sheathing panels (e.g. OSB) have been chemically, or by other means, treated to protect the panel from mould growth, the sheathing panel may indeed fall within the “MR” mould growth sensitivity class. Hence, the following results for the hygrothermal performance of Client B’s wall system may be applicable in respect to values of MIDX.
Figure 9 – Client B Wall: Response of OSB component to climate loads of Tofino, and Vancouver (BC) and St John’s (NL) response given as mould index value for sensitivity class “MR”
Figure 10 – Reference and Client B Walls: Response of Gypsum component (1 mm sliver on exterior Gypsum surface) to climate loads of (from left to right) Tofino and Vancouver (BC) and St John’s NF; response given as MIDXvalue for sensitivity class “MR”
Table 7 – Response of Reference (REF) and Client B Walls to climate loads Tofino and Vancouver (BC) and St John’s (NL)
Average and maximum values of MIDX for different locations in walls in which Moisture Load was placed between Building paper and cladding; response given as MIDXvalue for sensitivity class “MR”
0 1 2 3 4 5 6 0 90 180 270 360 450 540 630 720 810 Client B (MR) Reference Wall (MR) Time (day) M ould Inde x , M 0 1 2 3 4 5 6 0 90 180 270 360 450 540 630 720 810 Client B (MR) Reference Wall (MR) Time (day) M ould Inde x , M 0 1 2 3 4 5 6 0 90 180 270 360 450 540 630 720 810 Client B (MR) Reference Wall (MR) Time (day) M ould Inde x , M
Tofino
Van ou er
St John's
Gypsum X Sliver (1mm) Interior Gypsum (11.5 mm) Gypsum Layer (12.5 mm) Gypsum- Fibre Interface Gypsum-Roxul Interface OSB Sliver (1 mm) Back OSB (10 mm) Whole OSB (11 mm) OSB-Fibre Interface OSB Sliver (1 mm) Back OSB (10 mm) Whole OSB (11 mm) OSB-Fibre Interface REF-Avg 2.300 1.156 1.234 0.535 2.300 1.959 0.835 0.910 0.314 1.692 0.650 0.723 0.173 REF-Max 2.933 1.934 1.999 1.415 2.933 2.714 1.525 1.601 1.016 2.613 1.643 1.722 0.929 Client B-Avg 1.902 1.844 1.849 1.790 2.347 1.558 1.501 1.506 1.451 1.376 1.318 1.322 1.277 2.495 2.440 2.444 2.391 2.804 2.301 2.238 2.243 2.182 2.261 2.220 2.223 2.184
2.3. Results from Simulation
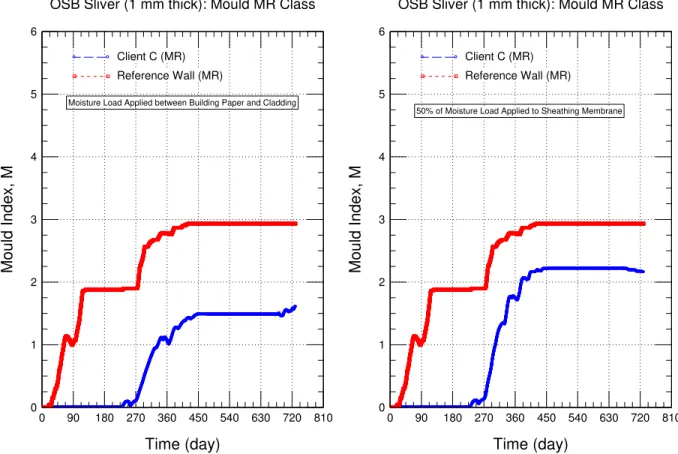
– Client C Drainage System
The response of the Client C wall assembly to the climate loads of Tofino (BC), Vancouver (BC) and St John’s (NL) are provided in Figure 11 to Figure 19 and in Table 8 to Table 10. More specifically, the variation in values for Mould Index (MIDX) over the course of the two year simulation period (average
year followed by wet year) and in respect to the different locations in the wall, are provided in this section for wall components having a mould growth sensitivity class assigned as Medium Resistant “MR”. The corresponding results for wall components having a mould growth sensitivity class assigned as Sensitive “S” are available in the companion Task 6 reports [5, 6]. In instances where sheathing panels (e.g. OSB) have been chemically, or by other means, treated to protect the panel from mould growth, the sheathing panel may indeed fall within the “MR” mould growth sensitivity class. Hence, the following results for the hygrothermal performance of Client C’s wall system may be applicable in respect to values of MIDX.
Figure 11 - Client C Wall: Response of OSB component to climate loads of Tofino (BC) for Moisture load applied between Building Paper and Cladding; response given as mould index value for sensitivity class
“MR”
Figure 12 - Client C Wall: Response of OSB component to climate loads of Tofino (BC) for 50% of Moisture Load applied to sheathing membrane; response given as mould index value for sensitivity class “MR”
Figure 13 – Client C Wall: Response of OSB component (1 mm sliver on exterior OSB surface) to climate loads of Tofino (BC); response given as mould index value for sensitivity class “MR”
Table 8 – Client C Wall: Average and maximum values of MIDX for different locations of Client C in which the Moisture Load of Tofino (BC) was placed between the Building paper and: (i) Cladding; (ii) Drainage
medium; response given as MIDXvalue for sensitivity class “MR”
Tofino
Tofino / % ML
OSB Sliver (1 mm) Back OSB (10 mm) Whole OSB (11 mm) OSB-Fibre Interface OSB Sliver (1 mm) Back OSB (10 mm) Whole OSB (11 mm) OSB-Fibre Interface REF-Avg 2.300 1.156 1.234 0.535 2.300 1.156 1.234 0.535 REF-Max 2.933 1.934 1.999 1.415 2.933 1.934 1.999 1.415 Client C Avg 0.826 0.253 0.292 0.034 1.243 0.533 0.587 0.203 Client C Max 1.608 0.718 0.787 0.190 2.217 1.229 1.285 0.720 0 1 2 3 4 5 6 0 90 180 270 360 450 540 630 720 810 Client C (MR) Reference Wall (MR)Moisture Load Applied between Building Paper and Cladding
Time (day) M o uld I n de x, M
OSB Sliver (1 mm thick): Mould MR Class
0 1 2 3 4 5 6 0 90 180 270 360 450 540 630 720 810 Client C (MR) Reference Wall (MR)
50% of Moisture Load Applied to Sheathing Membrane
Time (day) M o uld I n de x, M
Figure 14 - Client C Wall: Response of OSB component to climate loads of Vancouver (BC) for Moisture load applied between Building Paper and Cladding; response given as mould index value for sensitivity class “MR”
Figure 15 - Client C Wall: Response of OSB component to climate loads of Vancouver (BC) for 50% of Moisture Load applied to sheathing membrane; response given as mould index value for sensitivity class “MR”
Figure 16 – Client C Wall: Response of OSB component (1 mm sliver on exterior OSB surface) to climate loads of Vancouver (BC); response given as mould index value for sensitivity class “MR”
Table 9 – Client C Wall: Average and maximum values of MIDX for different locations of Client C in which the Moisture Load of Vancouver (BC) was placed between the Building paper and: (i) Cladding; (ii) Drainage
medium; response given as MIDXvalue for sensitivity class “MR”
Van ou er
Van ou er / % ML
OSB Sliver (1 mm) Back OSB (10 mm) Whole OSB (11 mm) OSB-Fibre Interface OSB Sliver (1 mm) Back OSB (10 mm) Whole OSB (11 mm) OSB-Fibre Interface REF-Avg 1.959 0.835 0.910 0.314 1.959 0.835 0.910 0.314 REF-Max 2.714 1.525 1.601 1.016 2.714 1.525 1.601 1.016 Client C Avg 0.430 0.009 0.019 0.000 0.736 0.179 0.207 0.008 Client C Max 1.227 0.141 0.193 0.000 1.591 0.594 0.646 0.145 0 1 2 3 4 5 6 0 90 180 270 360 450 540 630 720 810 Client C (MR) Reference Wall (MR)Moisture Load Applied between Building Paper and Cladding
Time (day) M o uld I n de x, M
OSB Sliver (1 mm thick): Mould MR Class
0 1 2 3 4 5 6 0 90 180 270 360 450 540 630 720 810 Client C (MR) Reference Wall (MR)
50% of Moisture Load Applied to Sheathing Membrane
Time (day) M o uld I n de x, M
Figure 17 - Client C Wall: Response of OSB component to climate loads of St John’s (NL) for Moisture load applied between Building Paper and Cladding; response given as mould index value for sensitivity class “MR”
Figure 18 - Client C Wall: Response of OSB component to climate loads of St John’s (NL) for 50% of Moisture Load applied to sheathing membrane; response given as mould index value for sensitivity class “MR”
Figure 19 – Client C Wall: Response of OSB component (1 mm sliver on exterior OSB surface) to climate loads of Vancouver (BC); response given as mould index value for sensitivity class “MR”
Table 10 – Client C Wall: Average and maximum values of MIDX for different locations of Client C in which the Moisture Load of Vancouver (BC) was placed between the Building paper and: (i) Cladding; (ii) Drainage
medium; response given as MIDXvalue for sensitivity class “MR”
St John’s
St John’s / % ML
OSB Sliver (1 mm) Back OSB (10 mm) Whole OSB (11 mm) OSB-Fibre Interface OSB Sliver (1 mm) Back OSB (10 mm) Whole OSB (11 mm) OSB-Fibre Interface REF-Avg 1.692 0.650 0.723 0.173 1.692 0.650 0.723 0.173 REF-Max 2.613 1.643 1.722 0.929 2.613 1.643 1.722 0.929 Client C Avg 0.241 0.015 0.024 0.000 0.402 0.061 0.079 0.000 Client C Max 1.112 0.195 0.266 0.000 1.389 0.491 0.564 0.000 0 1 2 3 4 5 6 0 90 180 270 360 450 540 630 720 810 Client C (MR) Reference Wall (MR)Moisture Load Applied between Building Paper
Time (day) M o uld I n de x, M
OSB Sliver (1 mm thick): Mould MR Class
0 1 2 3 4 5 6 0 90 180 270 360 450 540 630 720 810 Client C (MR) Reference Wall (MR)
50% of Moisture Load Applied to Sheathing Membrane
Time (day) M o uld I n de x, M
2.4. Results from Simulation
– Client D Drainage System
The response of the Client D wall assembly to the climate loads of Tofino (BC), Vancouver (BC) and St John’s (NL) are provided in Figure 20 to Figure 25 and in Table 11 to Table 13. More specifically, the variation in values for Mould Index (MIDX) over the course of the two year simulation period (average
year followed by wet year) and in respect to the different locations in the wall, are provided in this section for wall components having a mould growth sensitivity class assigned as Medium Resistant “MR”. The corresponding results for wall components having a mould growth sensitivity class assigned as Sensitive “S” are available in the companion Task 6 reports [5, 6]. In instances where sheathing panels (e.g. OSB) have been chemically, or by other means, treated to protect the panel from mould growth, the sheathing panel may indeed fall within the “MR” mould growth sensitivity class. Hence, the following results for the hygrothermal performance of Client D’s wall system may be applicable in respect to values of MIDX.
Figure 20 - Client D Wall: Response of OSB component to climate loads of Tofino (BC); response given as mould index value for sensitivity class “MR”
Figure 21 – Reference and Client D Walls: Response of OSB component (1 mm sliver on exterior OSB surface) to climate loads of Tofino (BC); response given as mould index value for sensitivity class “MR” Table 11– Average & maximum values of MIDX for different locations in Reference (REF) and Client D walls;
Moisture Load of Tofino (BC) placed between Building Paper and: (i) Cladding; (ii) Drainage medium; response given as MIDXvalue for sensitivity class “MR”
REF Layer or Interface Layer or Interface
M
IDX OSB Sliver (1 mm) Back OSB (10 mm) Whole OSB (11 mm) OSB-Fibre Interface OSB-Cavity Interface OSB Sliver (1 mm) Back OSB (10 mm) Whole OSB (11 mm) OSB-Fibre Interface OSB-Cavity Interface Average 2.300 1.156 1.234 0.535 2.300 2.300 1.156 1.234 0.535 2.300 Maximum 2.933 1.934 1.999 1.415 2.933 2.933 1.934 1.999 1.415 2.933Client D (i) - Layer or Interface Client D (ii) - Layer or Interface
M
IDX OSB Sliver (1 mm) Back OSB (10 mm) Whole OSB (11 mm) OSB-Fibre Interface OSB-Cavity Interface OSB Sliver (1 mm) Back OSB (10 mm) Whole OSB (11 mm) OSB-Fibre Interface OSB-Cavity Interface Average 1.568 0.703 0.772 0.274 1.843 2.371 1.578 1.640 0.946 2.559 Maximum 2.491 1.509 1.571 0.967 2.830 3.474 3.012 3.040 2.605 3.500 0 1 2 3 4 5 6 0 90 180 270 360 450 540 630 720 810 Client D (MR) Reference Wall (MR)Moisture Load between Building Paper and Cladding
Time (day) M o uld I n de x, M
OSB Sliver (1 mm thick): Mould MR Class
0 1 2 3 4 5 6 0 90 180 270 360 450 540 630 720 810 Client D (MR) Reference Wall (MR)
Moisture Load between Building Paper & Drainage Medium
Time (day) M o uld I n de x, M
Figure 22 - Client D Wall: Response of OSB component to climate loads of Vancouver (BC); response given as mould index value for sensitivity class “MR”
Figure 23 – Reference and Client D Walls: Response of OSB component (1 mm sliver on exterior OSB surface) to climate loads of Vancouver (BC); response given as mould index value for sensitivity class “MR” Table 12– Average & maximum values of MIDX for different locations in Reference (REF) and Client D walls;
Moisture Load of Vancouver (BC) placed between Building Paper and: (i) Cladding; (ii) Drainage medium; response given as MIDXvalue for sensitivity class “MR”
REF Layer or Interface Layer or Interface
M
IDX OSB Sliver (1 mm) Back OSB (10 mm) Whole OSB (11 mm) OSB-Fibre Interface OSB-Cavity Interface OSB Sliver (1 mm) Back OSB (10 mm) Whole OSB (11 mm) OSB-Fibre Interface OSB-Cavity Interface Average 1.959 0.835 0.910 0.314 1.959 1.959 0.835 0.910 0.314 1.959 Maximum 2.714 1.525 1.601 1.016 2.714 2.714 1.525 1.601 1.016 2.714Client D (i) - Layer or Interface Client D (ii) - Layer or Interface
M
IDX OSB Sliver (1 mm) Back OSB (10 mm) Whole OSB (11 mm) OSB-Fibre Interface OSB-Cavity Interface OSB Sliver (1 mm) Back OSB (10 mm) Whole OSB (11 mm) OSB-Fibre Interface OSB-Cavity Interface Average 1.082 0.311 0.354 0.077 1.082 1.532 0.635 0.703 0.266 1.532 Maximum 2.017 0.915 0.974 0.410 2.017 2.540 1.404 1.460 0.933 2.540 0 1 2 3 4 5 6 0 90 180 270 360 450 540 630 720 810 Client D (MR) Reference Wall (MR)Moisture Load between Building Paper & Cladding
Time (day) M o uld I n de x, M
OSB Sliver (1 mm thick): Mould MR Class
0 1 2 3 4 5 6 0 90 180 270 360 450 540 630 720 810 Client D (MR) Reference Wall (MR)
Moisture Load between Building Paper & Drainage Medium
Time (day) M o uld I n de x, M
Figure 24 - Client D Wall: Response of OSB component to climate loads of St John’s (NL); response given as mould index value for sensitivity class “MR”
Figure 25 – Reference and Client D Walls: Response of OSB component (1 mm sliver on exterior OSB surface) to climate loads of St John’s (NL); response given as mould index value for sensitivity class “MR” Table 13– Average & maximum values of MIDX for different locations in Reference (REF) and Client D walls;
Moisture Load of St John’s (NL) placed between Building Paper and: (i) Cladding; (ii) Drainage medium; response given as MIDXvalue for sensitivity class “MR”
REF Layer or Interface Layer or Interface
M
IDX OSB Sliver (1 mm) Back OSB (10 mm) Whole OSB (11 mm) OSB-Fibre Interface OSB-Cavity Interface OSB Sliver (1 mm) Back OSB (10 mm) Whole OSB (11 mm) OSB-Fibre Interface OSB-Cavity Interface Average 1.692 0.650 0.723 0.173 1.692 1.692 0.650 0.723 0.173 1.692 Maximum 2.613 1.643 1.722 0.929 2.613 2.613 1.643 1.722 0.929 2.613Client D (i) - Layer or Interface Client D (ii) - Layer or Interface
M
IDX OSB Sliver (1 mm) Back OSB (10 mm) Whole OSB (11 mm) OSB-Fibre Interface OSB-Cavity Interface OSB Sliver (1 mm) Back OSB (10 mm) Whole OSB (11 mm) OSB-Fibre Interface OSB-Cavity Interface Average 0.800 0.175 0.208 0.013 0.800 2.099 0.815 0.932 0.341 2.099 Maximum 1.868 0.957 1.033 0.210 1.868 3.188 2.285 2.349 1.603 3.188 0 1 2 3 4 5 6 0 90 180 270 360 450 540 630 720 810 Client D (MR) Reference Wall (MR)Moisture Load between Building Paper and Cladding
Time (day) M o uld I n de x, M
OSB Sliver (1 mm thick): Mould MR Class
0 1 2 3 4 5 6 0 90 180 270 360 450 540 630 720 810 Client D (MR) Reference Wall (MR)
Moisture Load between
Building Paper and Drainage Medium
Time (day) M o uld I n de x, M
2.5. Results from Simulation
– Client E Drainage System
The response of the Client E wall assembly to the climate loads of Tofino (BC), Vancouver (BC) and St John’s (NL) are provided in Figure 26 to Figure 31 and in Table 14 to Table 16. More specifically, the variation in values for Mould Index (MIDX) over the course of the two year simulation period (average
year followed by wet year) and in respect to the different locations in the wall, are provided in this section for wall components having a mould growth sensitivity class assigned as Medium Resistant “MR”. The corresponding results for wall components having a mould growth sensitivity class assigned as Sensitive “S” are available in the companion Task 6 reports [5, 6]. In instances where sheathing panels (e.g. OSB) have been chemically, or by other means, treated to protect the panel from mould growth, the sheathing panel may indeed fall within the “MR” mould growth sensitivity class. Hence, the following results for the hygrothermal performance of Client E’s wall system may be applicable in respect to values of MIDX.
Figure 26 - Client E Wall: Response of OSB component to climate loads of Tofino (BC); response given as mould index value for sensitivity class “MR”
Figure 27 – Reference & Client E Walls: Response of OSB to climate loads of Tofino (BC); response given as mould index value for sensitivity class “MR” Table 14 – Response of Reference & Client E Walls to climate loads of Tofino (BC); Average & maximum values of MIDX for wall locations where: (i) ML* placed between building paper & Cladding; (ii) 50 % ML on building paper; system vented; (iii) 50 % ML on building paper; system ventilated
Tofino
Tofino / % ML, Lo er ft; Vented
Tofino / % ML, Lo er ft; Ventilated
OSB Sliver (1 mm) Back OSB (10 mm) Whole OSB (11 mm) OSB-Fibre Interface OSB Sliver (1 mm) Back OSB (10 mm) Whole OSB (11 mm) OSB-Fibre Interface OSB Sliver (1 mm) Back OSB (10 mm) Whole OSB (11 mm) OSB-Fibre Interface REF-Avg 2.300 1.156 1.234 0.535 2.300 1.156 1.234 0.535 2.300 1.156 1.234 0.535 REF-Max 2.933 1.934 1.999 1.415 2.933 1.934 1.999 1.415 2.933 1.934 1.999 1.415 Client E-Avg
.
.
.
.
2.067 1.473 1.528 0.941 0.586 0.054 0.073 0.000 Client E-Max.
.
.
.
3.471 3.049 3.086 2.598 2.187 0.508 0.606 0.000 *ML: Moisture Load 0 1 2 3 4 5 6 0 90 180 270 360 450 540 630 720 810 Client E (MR) Reference Wall (MR) Time (day) M o uld I n de x, MOSB Sliver (1 mm thick): Mould MR Class
0 1 2 3 4 5 6 0 90 180 270 360 450 540 630 720 810 Client E (MR) Reference Wall (MR) 50% ML, bottom 4ft; Vented Time (day) M o uld I n de x, M
OSB Sliver (1 mm thick): Mould MR Class
0 1 2 3 4 5 6 0 90 180 270 360 450 540 630 720 810 Client E (MR) Reference Wall (MR) 50% ML, bottom 4ft; Ventilated Time (day) M o uld I n de x, M
Figure 28 - Client E Wall: Response of OSB component to climate loads of Vancouver (BC); response given as mould index value for sensitivity class “MR”
Figure 29 – Reference & Client E Walls: Response of OSB to climate loads of Vancouver (BC); response given as mould index value for sensitivity class “MR” Table 15 – Response of Reference & Client E Walls to climate loads of Vancouver (BC); Average & maximum values of MIDX for wall locations where: (i) ML* placed between building paper & Cladding; (ii) 50 % ML on building paper; system vented; (iii) 50 % ML on building paper; system ventilated
Vancouver Vancouver/50% ML, Lower 4ft; Vented Vancouver/50% ML, Lower 4ft; Ventilated
OSB Sliver (1 mm) Back OSB (10 mm) Whole OSB (11 mm) OSB-Fibre Interface OSB Sliver (1 mm) Back OSB (10 mm) Whole OSB (11 mm) OSB-Fibre Interface OSB Sliver (1 mm) Back OSB (10 mm) Whole OSB (11 mm) OSB-Fibre Interface REF-Avg 1.959 0.835 0.910 0.314 1.959 0.835 0.910 0.314 1.959 0.835 0.910 0.314 REF-Max 2.714 1.525 1.601 1.016 2.714 1.525 1.601 1.016 2.714 1.525 1.601 1.016 Client E-Avg 0 0 0 0 0.860 0.178 0.212 0.000 0.002 0.000 0.000 0.000 Client E-Max 0 0 0 0 2.127 0.571 0.707 0.003 0.136 0.000 0.000 0.000 *ML: Moisture Load 0 1 2 3 4 5 6 0 90 180 270 360 450 540 630 720 810 Reference Wall (MR) Client E (MR) Time (day) M o uld I n de x, M
OSB Sliver (1 mm thick): Mould MR Class
0 1 2 3 4 5 6 0 90 180 270 360 450 540 630 720 810 Client E (MR) Reference Wall (MR) 50% ML, bottom 4ft; Vented Time (day) M o uld I n de x, M
OSB Sliver (1 mm thick): Mould MR Class
0 1 2 3 4 5 6 0 90 180 270 360 450 540 630 720 810 Client E (MR) Reference Wall (MR) 50% ML, bottom 4ft; Ventilated Time (day) M o uld I n de x, M
Figure 30 - Client E Wall: Response of OSB component to climate loads of St John’s (NL); response given as mould index value for sensitivity class “MR”
Figure 31 – Reference & Client E Walls: Response of OSB to climate loads of St John’s (NL); response given as mould index value for sensitivity class “MR” Table 16 – Response of Reference & Client E Walls to climate loads of St John’s (NL); Average & maximum values of MIDX for wall locations where: (i) ML* placed between building paper & Cladding; (ii) 50 % ML on building paper; system vented; (iii) 50 % ML on building paper; system ventilated
St John’s St John’s/ % ML, Lo er ft; Vented St John’s/ % ML, Lo er ft; Ventilated
OSB Sliver (1 mm) Back OSB (10 mm) Whole OSB (11 mm) OSB-Fibre Interface OSB Sliver (1 mm) Back OSB (10 mm) Whole OSB (11 mm) OSB-Fibre Interface OSB Sliver (1 mm) Back OSB (10 mm) Whole OSB (11 mm) OSB-Fibre Interface REF-Avg 1.692 0.650 0.723 0.173 1.692 0.650 0.723 0.173 1.692 0.650 0.723 0.173 REF-Max 2.613 1.643 1.722 0.929 2.613 1.643 1.722 0.929 2.613 1.643 1.722 0.929 Client E-Avg 0 0 0 0 1.999 0.696 0.767 0.351 0.002 0.000 0.000 0.000 Client E-Max 0 0 0 0 3.258 2.303 2.379 1.597 0.136 0.000 0.000 0.000 *ML: Moisture Load 0 1 2 3 4 5 6 0 90 180 270 360 450 540 630 720 810 Reference Wall (MR) Client E (MR) Time (day) M o uld I n de x, M
OSB Sliver (1 mm thick): Mould MR Class
0 1 2 3 4 5 6 0 90 180 270 360 450 540 630 720 810 Client E (MR) Reference Wall (MR) 50% ML, bottom 4ft; Vented Time (day) M o uld I n de x, M
OSB Sliver (1 mm thick): Mould MR Class
0 1 2 3 4 5 6 0 90 180 270 360 450 540 630 720 810 Client E (MR) Reference Wall (MR) 50% ML, bottom 4ft; Ventilated Time (day) M o uld I n de x, M
2.6. Results from Simulation
– Client F Drainage System
The response of the Client F wall assembly to the climate loads of Tofino (BC), Vancouver (BC) and St John’s (NL) are provided in Figure 32 to Figure 33 and in Table 17. More specifically, the variation in values for Mould Index (MIDX) over the course of the two year simulation period (average year followed
by wet year) and in respect to the different locations in the wall, are provided in this section for the case for wall components having a mould growth sensitivity class assigned as Medium Resistant “MR”. The corresponding results for wall components having a mould growth sensitivity class assigned as Sensitive “S” are available in the companion Task 6 reports [5, 6]. In instances where sheathing panels (e.g. OSB) have been chemically, or by other means, treated to protect the panel from mould growth, the sheathing panel may indeed fall within the “MR” mould growth sensitivity class. Hence, the following results for the hygrothermal performance of Client F’s wall system may be applicable in respect to values of MIDX.
Figure 32 - Client F Wall: Response of OSB component to climate loads of Tofino, and Vancouver (BC) and St John’s (NL); response given as mould index value for sensitivity class “MR”