A 140 GHz pulsed EPR/212 MHz
NMR spectrometer for DNP studies
The MIT Faculty has made this article openly available.
Please share
how this access benefits you. Your story matters.
Citation
Smith, Albert A., Björn Corzilius, Jeffrey A. Bryant, Ronald
DeRocher, Paul P. Woskov, Richard J. Temkin, and Robert G. Griffin.
“A 140GHz Pulsed EPR/212MHz NMR Spectrometer for DNP
Studies.” Journal of Magnetic Resonance 223 (October 2012): 170–
179.
As Published
http://dx.doi.org/10.1016/j.jmr.2012.07.008
Publisher
Elsevier
Version
Author's final manuscript
Citable link
http://hdl.handle.net/1721.1/99511
Terms of Use
Creative Commons Attribution-Noncommercial-NoDerivatives
A 140 GHz Pulsed EPR/212 MHz NMR Spectrometer for DNP
Studies
Albert A. Smitha, Björn Corziliusa, Jeffrey A. Bryanta, Ronald DeRochera, Paul P. Woskovb,
Richard J. Temkinb, and Robert G. Griffina,*
aDepartment of Chemistry and Francis Bitter Magnet Laboratory, Massachusetts Institute of Technology, Cambridge, Massachusetts 02139, United States
bPlasma Science and Fusion Research Center, Massachusetts Institute of Technology, Cambridge, Massachusetts 02139, United States
Abstract
We described a versatile spectrometer designed for the study of dynamic nuclear polarization (DNP) at low temperatures and high fields. The instrument functions both as an NMR
spectrometer operating at 212 MHz (1H frequency) with DNP capabilities, and as a pulsed-EPR operating at 140 GHz. A coiled TE011 resonator acts as both an NMR coil and microwave
resonator, and a double balanced (1H, 13C) radio frequency circuit greatly stabilizes the NMR performance. A new 140 GHz microwave bridge has also been developed, which utilizes a four-phase network and ELDOR channel at 8.75 GHz, that is then multiplied and mixed to obtain 140 GHz microwave pulses with an output power of 120 mW. Nutation frequencies obtained are as follows: 6 MHz on S = ½ electron spins, 100 kHz on 1H, and 50 kHz on 13C. We demonstrate
basic EPR, ELDOR, ENDOR, and DNP experiments here. Our solid effect DNP results
demonstrate an enhancement of 144 and sensitivity gain of 310 using OX063 trityl at 80 K and an enhancement of 157 and maximum sensitivity gain of 234 using Gd-DOTA at 20 K, which is significantly better performance than previously reported at high fields (>3 T).
1 Introduction
Dynamic nuclear polarization (DNP) is a method of enhancing signals in nuclear magnetic resonance (NMR) experiments, by transferring the large spin-polarization of paramagnetic electrons to the surrounding nuclear spins [1–5]. The DNP phenomenon was initially postulated and demonstrated in the 1950s [6; 7], but because DNP efficiency scales unfavorably with increases in the magnetic field, it had not seen much use at high fields (>5T) until recently. However, when the gyrotron was introduced as a means of providing high microwave field strengths, high field DNP in combination with magic angle spinning (MAS) became a viable experiment [8–10]. Biradical polarizing agents have further
contributed to the efficiency of cross-effect DNP at high magnetic fields [11–13]. Our recent experiments have shown that the solid effect can also be efficient at high field [14; 15] and can be performed with high-spin paramagnetic metal centers [16]. With these advances, DNP has seen a variety of applications in solid-state NMR [17–21], and additional advances
© 2012 Elsevier Inc. All rights reserved
*Correspondence should be addressed: rgg@mit.edu.
Publisher's Disclaimer: This is a PDF file of an unedited manuscript that has been accepted for publication. As a service to our
customers we are providing this early version of the manuscript. The manuscript will undergo copyediting, typesetting, and review of
NIH Public Access
Author Manuscript
J Magn Reson
. Author manuscript; available in PMC 2013 October 01.Published in final edited form as:
J Magn Reson. 2012 October ; 223: 170–179. doi:10.1016/j.jmr.2012.07.008.
NIH-PA Author Manuscript
NIH-PA Author Manuscript
in liquid-state DNP [22; 23] and dissolution DNP [24–26] have also expanded the scope of DNP applications.
Although much work has been done to understand the DNP mechanism, a complete model of the process is only possible with the characterization of the electron and the nuclear spins, in addition to accurate measurement of experimental parameters. This requires measurement of electron and nuclear spin-lattice (T1) and spin-spin (T2) relaxation times, the electron nutation frequency, and the EPR lineshape. It can also be very useful to know the frequency or field dependence of both the nuclear polarization enhancement, and the electron
polarization depletion.
Additionally, there has been interest in developing pulsed-DNP techniques, including polarization transfers performed in the rotating frame, and experiments that increase the excitation bandwidth. The dressed-state solid effect (DSSE) and nuclear spin-orientation via electron spin locking (NOVEL) both eliminate the unfavorable field dependence of
laboratory-frame DNP techniques such as cross effect and solid effect, by using electron spin-locking to perform transfers in the rotating frame [27; 28]. However, calibration of parameters to optimize both NOVEL and DSSE require measurement of the electron nutation frequency, and can benefit from indirect measurement of DNP via electron detection. However, to determine the effectiveness of each method for enhancing bulk nuclear polarization, one must use direct observation via NMR detection. Another approach to improving DNP efficiency via pulsed methods exchanges continuous wave (cw)
microwave irradiation for short, strong pulses as a means of increasing the bandwidth of a DNP experiment without increasing average power [29; 30].
A pulsed-EPR spectrometer integrated with an NMR spectrometer is the ideal instrument for in-depth studies of DNP mechanisms and implementation of pulsed-DNP: EPR detection capabilities allow characterization of the paramagnetic electrons including measurement of the EPR spectrum as well as T1 and T2 of the electron. Also, direct measurement of the electron nutation frequency during DNP experiments is only possible with EPR detection. Multiple EPR channels with different relative phases allow for spin locking of the electrons, which is required for DSSE and NOVEL. A frequency-sweepable electron-electron double resonance (ELDOR) channel can allow for indirect measurement of DNP conditions, and provide additional flexibility when performing DNP experiments. Finally, the NMR spectrometer allows direct measurement of the nuclear T1, the DNP buildup time (TB), and
the nuclear enhancement (ε∞); the knowledge of those parameters is essential to DNP studies.
Several high field DNP spectrometers equipped with EPR detection capabilities have been recently described in the literature. Vega, Goldfarb and coworkers have developed an EPR/ DNP system operating at 95 GHz and have recently shown DNP enhancements and also double resonance experiments detecting DNP via EPR observation [31; 32]. Prisner, et al. demonstrated liquid-state DNP, also using an EPR/DNP system [22; 33], and Köckenberger et al. has also implemented an EPR setup for use in conjunction with a dissolution DNP experiment [34]. Han and coworkers demonstrated initial results with a 200 GHz EPR/DNP spectrometer [35]. Finally, the HIPER EPR system developed by Smith and coworkers is designed around a ~1 kW extended interaction klystron (EIK), and has been used to show DNP enhancements via pulsed cross effect [30].
We describe a 140 GHz/212 MHz EPR/DNP spectrometer designed for the study of DNP mechanisms. Our system is unique in its flexibility for performing EPR and DNP experiments in the solid-state, and shows outstanding performance in obtaining DNP enhancements in a static sample. Preliminary results show EPR, ELDOR, and
electron-NIH-PA Author Manuscript
NIH-PA Author Manuscript
nuclear double resonance (ENDOR) data, and also DNP enhancements observed via NMR. We obtain an enhancement of 144 and sensitivity gain of 310 under solid effect conditions using OX063 trityl, where the microwave field strength is critical to performance. We also report temperature dependent enhancements using Gd-DOTA as a polarizing agent, and obtain a maximum enhancement of 157 and maximum sensitivity gain of 234 at 20 K. These represent the highest enhancements to date reported using 1H solid effect at high fields (≥5T).
2. Instrument Design
The 140 GHz EPR/212 MHz NMR can be grouped into a five subsystems: the magnet and field control, temperature control, the EPR spectrometer, the NMR spectrometer, and the DNP probe. Of these systems, the EPR spectrometer and the DNP probe have undergone major changes that will be described in detail here, in addition to a description of the spectrometer control. We briefly describe the magnet and field control, temperature control, and NMR spectrometer before detailing the novel components of the spectrometer.
The 140 GHz EPR/212 MHz NMR spectrometer utilizes a Magnex 5 T/130 mm bore magnet with a ±0.4 T superconducting sweep coil. An NMR probe containing a small water sample resides just below the sample space in the magnet. A Resonance Research field-mapping unit (FMU), which is one-channel NMR spectrometer, is used to measure the 1H resonance frequency of the water sample. This is used to determine the magnetic field. The field is then swept to the desired position, as described in detail by Maly, et al. [36]. An Oxford SpectrostatCF cryostat and ITC502 temperature controller allow precise temperature regulation down to 1.4 K. A 2-channel RNMR Cambridge Instruments console (courtesy of D.J. Ruben) allows flexible radio frequency (RF) pulse creation and NMR detection.
EPR Spectrometer: 140 GHz EPR Bridge
We have built a five-channel (four phases and 1 sweepable ELDOR channel) EPR bridge operating at 140 GHz with 120 mW of output power. The EPR bridge can be broken into three major sections as shown in Figure 1: microwave pulse generation (red), which includes the five channel network, signal down-mixing (blue), and quadrature detection (green). We describe each section, and also discuss phase-locking of the three sections, which is essential for EPR signal detection. Also, the specific parts used in the construction of the EPR bridge are provided in the supplementary information (SI).
Frequency generation uses a Virginia Diodes Inc. active multiplier chain (AMC), which requires either pulsed or cw input at 34.5–35.5 GHz and multiplies that input frequency by 4 to give 120 mW of power at 138–142 GHz. Therefore we generate phase-controlled pulses at 35 GHz to feed into the AMC. Microwaves are generated at 8.75 GHz via multiplication of a 2.1875 GHz source by 4. The microwave power at 8.75 GHz is split three ways: half is directed into the five-channel network where microwave pulses are generated, a quarter is fed into a ×3 multiplier giving 26.25 GHz and the last quarter is used as a reference frequency for quadrature detection. Pulses from the output of the five-channel network and cw microwaves from the ×3 multiplier are mixed together, providing pulses at 35 GHz that can be fed into the AMC. We have designed the generation of microwave pulses at 35 GHz to minimize phase error. In our configuration, the phase error at 35 GHz is the same as the phase error at 8.75 GHz, because the mixing step (26.25 GHz + 8.75 GHz) does not introduce any new error. Although it would be simpler to create pulses at 8.75 GHz and use a ×4 multiplier to create 35 GHz pulses, this would introduce a phase error at 35 GHz that is four times larger than the error at 8.75 GHz.
NIH-PA Author Manuscript
NIH-PA Author Manuscript
The five-channel network consists of four phases and one sweepable ELDOR channel. 8.75 GHz microwaves are fed into the four channels, where they are first attenuated, and then phase shifted to the appropriate phase (usually 0°, 90°, 180°, 270°). One may also use the channels for pulses with different power levels in the same experiment. Finally, pulses are generated using a double-balanced mixer (Marki M1-0412), by feeding an attenuated transistor-transistor logic (TTL) pulse from a pulse programmer into the intermediate frequency port of the mixer. We use mixers to create a very fast, but inexpensive microwave switch as previously shown by Bolton etal [37]. On its own, a mixer makes a very poor microwave switch, because of high insertion loss and poor on/off contrast. However, when the output of the switching mixer after up conversion is fed into a multiplier, as done with the AMC in our system, the nonlinear behavior of the multiplier increases the on/off contrast and filters weaker spurious frequencies from the up converter. In fact, it is possible to generate sub-nanosecond pulses with this method. Although not yet implemented, this EPR bridge is designed to drive a gyro-traveling-wave-tube-amplifier with 40 dB gain, making very short pulses necessary to produce π/2 pulses with the high microwave powers that would be available [38; 39]. One should note that because the ×4 multiplier only cuts off microwave power if the power is below some threshold, when one channel is activated, power from the other channels will leak through the multiplier. This is remedied because the channels are paired with 180° phase shift between them. As a result, equal power leakage is cancelled for the four phases.
The ELDOR channel of the five-channel network is a voltage controlled oscillator (VCO) operating between 8.25 GHz and 9.25 GHz, to give a 4 GHz sweep range when multiplied to 140 GHz. Like the other channels of the five-channel network, this channel is first fed into an attenuator, and gated with a mixer. As mentioned above, when one of the other channels is activated, this will allow the ELDOR channel to leak through. Since there is no channel with opposite phase of the ELDOR channel, we must use a standard microwave switch in addition to the mixer on this channel to avoid power leakage when other channels are in use. Short pulses can still be achieved by opening the microwave switch before the mixer, as long as no other channel is activated during that period.
Down-mixing of the EPR signal to 8.75 GHz is achieved with a biasable mixer (Millitech MXB-08) that mixes the EPR signal at 140 GHz with a reference frequency of 131.25 GHz. This allows for heterodyne quadrature detection at 8.75 GHz. In the reference arm,
multiplying the 2.1875 GHz source by 5 generates microwaves at 10.9375 GHz. 131.25 GHz microwaves are subsequently generated from a ×12 AMC (Millitech AMC-08), which is fed into the biasable mixer.
Output from the mixer is amplified and fed into the quadrature detection. The EPR signal is split and enters two mixers. The reference signal for the two mixers is obtained by taking cw 8.75 GHz microwaves from the ×4 multiplier in the pulse generation arm. This is routed through a variable phase shifter, and then a 90°-hybrid power splitter. The 90° phase shift between the two mixers allows one to obtain the real and imaginary signals from the two mixers. The output from the mixers is amplified, and finally the down-mixed signal enters an oscilloscope.
The phase of the EPR signal will be random if the reference frequencies of the pulse generation, down-mixing, and quadrature arms are not locked. Therefore phase-locking is essential, and is achieved by generating all reference frequencies from the same source. In our case, this is the 2.1875 GHz source. The pulse generation and quadrature arms both require 8.75 GHz input, which is generated by ×4 multiplication of the source. The down-mixing arm then requires 2.1875 GHz input, which is obtained directly from the source. Therefore, the total multiplication factor for each bridge of the arm is as follows: 64
NIH-PA Author Manuscript
NIH-PA Author Manuscript
× 2.1875 GHz for the pulse generation arm, 60 × 2.1875 GHz for the down-mixing arm, and 4 × 2.1875 GHz for the quadrature arm. One may note that a simpler scheme would be to use an 8.75 GHz source and factors of 16, 15, and 1, respectively. However, this would require a ×5 multiplier operating with at least 43.75 GHz output frequency. The limited availability of such multipliers made it simpler to start at lower frequency, and use a ×5 multiplier with 10.9375 GHz output.
EPR Spectrometer: Control and Detection
In order to have precise control over the EPR spectrometer, we have implemented SpecMan4EPR with much help from Boris Epel [40]. SpecMan allows for simple
integration of a variety of components by providing drivers for many different components, and provides a convenient software interface to allow for coordination of all components. We have used an AWG1000 (Chase Scientific) as a pulse programmer. The AWG is a 12-bit arbitrary waveform generator, which has the waveform generation itself replaced with 12 positive emitter-coupler logic (PECL) channels, which have a 1 ns pulse resolution. The AWG triggers the five pulse channels (plus an additional switch on the ELDOR channel), a protection switch on the receiver, detection with an oscilloscope, and can also trigger RNMR in order to initiate an NMR pulse sequence. SpecMan allows the AWG1000 to initiate a pulse sequence on either an internal trigger or an external trigger, so that it is possible to perform an experiment on the EPR that begins concurrently with an NMR experiment.
For detection, we use a WaveRunner 6200 (LeCroy) oscilloscope that can detect frequencies up to 2 GHz, with a sampling rate of 10 Giga-samples per second. This is also interfaced with SpecMan, and allows for a variety of detection modes, including acquisition of the full waveform, Fourier transform of the waveform, and echo integration. Finally, a TCP/IP driver in SpecMan allows us to pass parameters to LabView programs, and the driver waits for a response from the program confirming that the parameter has been set. We use this to communicate with the field controller, to set the ENDOR and ELDOR frequencies, and to set an attenuator which is built into the 140 GHz AMC (the ELDOR VCO and AMC attenuator both require voltage inputs, for which we communicate directly with a 0–5 V digital to analog converter that is attached to the VCO and AMC).
DNP Probe
In order to perform efficient DNP experiments with low power microwaves (120 mW), and have good radio frequency (RF) performance, it is essential to have both a high-Q EPR resonator and an efficient NMR circuit. We use a coiled TE011 cylindrical resonator for this
purpose, which was first proposed and used for 9 GHz ENDOR experiments [41; 42], and later implemented at 140 GHz by Weis, et al. [43]. The coiled TE011 resonator, which is
shown in Figure 2b, is a fundamental mode microwave resonator- therefore having the full microwave field concentrated at a single node and giving higher microwave field strengths and filling factors than higher mode resonators (the field strengths will still depend on the coupling and loss of the resonator). At the same time the sample is situated around a node of the electric field component, reducing dielectric losses and sample heating. Because the resonator is also a solenoid shaped coil, it can also act as an RF resonator when attached to a tuning circuit. The resonator typically accommodates sample capillaries with .55 mm outer diameter and .40 mm inner diameter, which can be filled with 2 mm of sample (~250 nL); larger capillaries may be used although the Q of the cavity will suffer.
The coiled TE011 is critical to the performance of this spectrometer, since it provides a very
high Q, and therefore high microwave field strengths using small amounts of microwave power. However, inherent to a high Q is a narrow cavity bandwidth. As a result, when the
NIH-PA Author Manuscript
NIH-PA Author Manuscript
frequency is swept in an experiment, the field strengths can vary across the frequency sweep. This can potentially make ELDOR experiments over wide frequency ranges considerably more difficult. Also, we will later see experiments where the resonator is periodically retuned in a frequency-swept DNP experiment, in order to circumvent the limitations of the high Q cavity. It is possible to reduce the Q of the cavity for various experiments. One may use a matching mechanism, in addition to a tuning mechanism, although this is not currently implemented. It is also possible to reduce Q by other methods, such as introduction of small pieces of metal or dielectric to the microwave cavity. If either of these methods is used, however, the maximum field strength available will be reduced. Although this resonator has been in use in our lab for some time, the RF circuit had inherent instability due to the proximity of the center of the RF coil to the waveguide, as can be seen in Figure 2c where the waveguide meets the resonator iris. The waveguide must either be very close to the coil, essentially acting as a capacitor, which makes it very prone to arcing, or the waveguide must touch the coil, essentially grounding the coil and causing a very inhomogeneous RF field. However, if the circuit is tuned so that the center of the coil has the same electric potential as ground (a virtual ground), then both arcing and RF
inhomogeneity can be prevented. This may be achieved with a balanced RF circuit [44]. Denysenkov and co-workers have demonstrated a one-channel balanced, lumped-element circuit using the coiled TE011 resonator at 400 MHz/260 GHz in a liquid-DNP probe [33].
We have taken a similar approach. However, for a solid-state DNP probe, it is beneficial to have both a 1H channel and a 13C channel so that one may polarize 1H and transfer that polarization via cross-polarization to 13C where there is significantly less background signal [45]. Additionally, because the probe must operate at low temperature, a transmission line circuit is used rather than a lumped-element circuit. For this purpose, we have designed a double balanced (1H, 13C) transmission line circuit to use in conjunction with the coiled TE011 resonator.
The circuit design is shown in Figure 3. For tuning and matching of both channels, we use a parallel tune/series match configuration, and additionally use a variable capacitor to ground on the opposite side of each channel to allow for balancing of the circuit. For simple tuning of the circuit, we make the total transmission line length on each side of the 1H channel equal to the 1H wavelength. Conveniently, for a Teflon dielectric transmission line, this is ~1 m, which is approximately the length of the probe itself. However, the 13C wavelength is ~4 m in Teflon dielectric. Therefore, we add an additional 1 m of transmission line on each side of the circuit (inside the circuit box), so that the total length on each side is equal to half the 13C wavelength. This causes the circuit to behave as a lumped element circuit, because half-integer wavelength transmission lines act similarly to electrical shorts [46]. Isolation of the channels is achieved using 1H traps on the 13C channel and 13C traps on the 1H channel. The full probe is shown in Figure 2a. We have used three metal rods for support of the probe, with brass disks providing electrical contact between the three rods, the waveguide, and the outer conductor of the transmission line. This was necessary to establish a good ground on the outside of the transmission line. Without the use of the brass disks to connect the transmission line to the waveguide and support rods, there are significant standing waves on the outer conductor of the transmission line. The presence of standing waves significantly changes the behavior of the circuit- making it highly unstable and also difficult to model using computer simulation. Therefore, additional grounding is essential.
The upper halves of the support rods are made of stainless steel in order to reduce heat conductivity at the top of the probe. However, even so-called non-magnetic stainless steel may become significantly magnetic with extensive field cycling and thermocycling, so the lower half of the rods are made of brass at the bottom. Therefore, magnetization of the
NIH-PA Author Manuscript
NIH-PA Author Manuscript
stainless steel will not affect the magnetic field homogeneity at the sample. A fourth rod made of G10 composite material can be rotated from outside the probe, and is used to move one plunger in and out of the cavity for microwave tuning. We also note that the tuning box seen in Figure 2a is connected to the probe via N-type elbow joints that can be disconnected from the probe itself. This allows one to easily remove the top-loading probe from the magnet when changing samples. Also, the use of different circuit boxes for different nuclei with the same probe is possible.
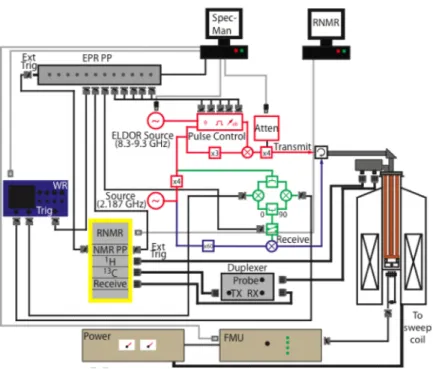
Full System Control
In Figure 4, we show the full spectrometer configuration. The computer labeled SpecMan controls the EPR. It is connected internally to the pulse programmer, which in turn is connected to the EPR bridge. USB connectors attach to a digital-to-analog converter that provides voltages for the AMC attenuator and ELDOR VCO. The WaveRunner oscilloscope and the FMU communicate via TCP/IP with the SpecMan computer, all being connected to an Ethernet network. Finally, the magnet power supply and a water probe are connected to the FMU. The computer labeled RNMR is connected to the RNMR console, which includes the pulse programmer, 1H and 13C channels, and the receiver. The RNMR console connects to the probe (filters and directional couplers are not shown in Figure 4), and an active duplexer (Warner Harrison) separates the RF pulses on the 13C channel from the 13C NMR signal.
For DNP experiments, it is necessary to synchronize the EPR and NMR spectrometers. In our configuration, the computers that control the EPR and NMR do not communicate directly. Although experiments are queued on separate computers, the experiments can be coordinated with triggers between the AWG, which acts as the EPR pulse programmer, and RNMR, which controls the NMR pulse programmer. We show the full spectrometer configuration in Figure 4. Note that an external trigger for each pulse programmer is attached to a channel of the other pulse programmer. We describe how this configuration may be used to execute pulsed-DNP experiments, ENDOR experiments, and cw-DNP experiments for which electron and nuclear polarization is observed simultaneously. In order to perform a pulsed-DNP experiment, one must execute the EPR pulse sequence repeatedly to achieve significant buildup of nuclear polarization. Because the EPR sequence requires precise (nanosecond) timing, it is necessary to use a high-resolution
pulse-programmer such as the AWG that we use for the EPR. However, the AWG does not have sufficient memory to store a seconds-long buildup with nanosecond resolution. Therefore, we load one or several instances of the pulse sequence onto the AWG, but then use repeated triggering of the AWG via the RNMR pulse programmer to re-execute the sequence many times, allowing for an extended, seconds long buildup period, with nanosecond resolution for the EPR pulses.
External triggering of the RNMR pulse programmer allows for simple setup of ENDOR experiments. ENDOR requires that an RF pulse be inserted between microwave pulses. RNMR can in fact be triggered both on rising and falling pulses, which allows us to start and stop an RF pulse with the rising and falling edges of a single trigger from the AWG. As a result, not only can the RF pulse be initiated by the EPR spectrometer, but its length may also be controlled without adjustment of parameters in the RNMR software.
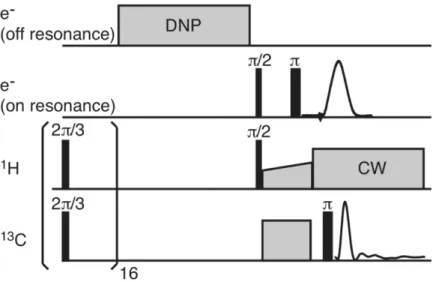
Finally, we may use external triggering of the AWG to measure the electron polarization after a DNP experiment, as is shown in Figure 5, where both the electron polarization and the nuclear polarization are measured together at the end of the experiment. In this case, RNMR executes a DNP experiment, and at the conclusion of the experiment, initiates cross
NIH-PA Author Manuscript
NIH-PA Author Manuscript
polarization (CP) to measure the nuclear polarization, while simultaneously triggering a Hahn echo sequence to measure the electron polarization.
3. Experimental Results
To demonstrate the capabilities of our EPR/DNP spectrometer, we will show the results of several typical EPR and DNP experiments. First, we briefly discuss the mw and rf performance of the instrument. 1H and 13C nutation frequencies were determined by measuring transverse 13C magnetization via a CP experiment. The 1H nutation frequency was measured by incrementing the length of the initial flip pulse on the 1H channel before CP. In order to measure the 13C nutation frequency, a pulse on the 13C channel was applied immediately after the CP period. The pulse was shifted 90° in phase from the spin lock. Therefore, the length of the pulse could be incremented in order to measure the 13C nutation frequency. Finally, a Hahn echo was applied to the electrons, where the initial pulse was incremented to obtain the e− nutation frequency. The frequencies measured were 100 kHz on 1H, 50 kHz on 13C, and 6 MHz on e−. The 6 MHz nutation frequency for electrons is significantly higher than we have obtained previously [43], and leads to excellent DNP performance, as we will show. SI Figure 1 shows the results from a nutation experiment using trityl.
In Figure 6, we show several EPR experiments. Figure 6a shows an EPR spectrum of bTbtk-py (0.7 mM in 60:40 glycerol:D2O), a water-soluble analogue of the bTbk biradical [11; 47].
This was acquired with a Hahn echo, where the timing of the π/2–τ–π pulse sequence is 55 ns–200 ns–110 ns followed by detection via integration of the Hahn echo. 641 field points were acquired by repeating the pulse sequence 400 times at each field point, using a 4 step phase cycle, with a repetition time of 5 ms. The derivative spectrum in Figure 6a was calculated with the EasySpin fieldmod function, with modulation amplitude of 1 mT [48]. Note that we can use a short delay between pulses by phase cycling in order to eliminate any ring-down or free-induction decay that would otherwise interfere with acquisition of the Hahn echo.
In Figure 6b, we show an ELDOR hole burning experiment on 40 mM trityl in 60:40 glycerol:D2O (a typical solid effect DNP sample). We apply a saturating pulse to the center
of the spectrum with the ELDOR channel, wait 20 μs in order to eliminate any residual coherence, and then apply a Hahn echo pulse sequence (40 ns–400 ns–80 ns). The integrated intensity of the Hahn echo is recorded for each field position. In order to acquire this spectrum, the magnetic field and ELDOR frequency are swept together so that the ELDOR frequency remains on resonance with the center of the trityl spectrum. The field and frequency were swept together from 4990 mT to 4998 mT and −101 MHz to +123 MHz (offset), respectively, over 101 points. 200 shots were taken at each point, with a 4-step phase cycle. Note that after 5 ms, the trityl line is almost fully saturated. This is an important observation: when measuring the T1 of electrons in a highly concentrated sample, such as is necessary for DNP, the recovery time is a composite of electron-electron spin-diffusion, spectral diffusion, and electron spin-lattice relaxation (T1). However, if it is possible to saturate the full EPR spectrum, then the contribution from electron-electron spin diffusion and spectral diffusion is greatly diminished, giving an accurate measurement of the T1. In Figure 6c, we show a Mims ENDOR of BDPA doped in polystyrene [49]. The pulse sequence for Mims ENDOR is π/2–τ–π/2–T–π/2, which causes a stimulated echo at a time
τ after the final π/2 pulse. However, during the period T, an RF π-pulse is applied to the 1H
channel, which affects the refocusing of the stimulated echo. The timing of our sequence was 45 ns–200 ns–45 ns–7.1 μs–45 ns, with a 7 μs RF pulse during the period T. The magnetic field was set to 4994.5 mT, putting the center of the BDPA spectrum on resonant
NIH-PA Author Manuscript
NIH-PA Author Manuscript
with the 140 GHz source. The RF frequency was swept from 207.654 MHz to 217.654 MHz, with 181 frequency points recorded. 1600 shots were taken at each point, using a 4-step phase cycle. By decreasing the matching of the RF circuit so that the reflected power was similar across the full 10 MHz sweep width, we were able to record the full ENDOR spectrum without any retuning of the circuit. Some optimization of the tuning was required to obtain a symmetric ENDOR spectrum. Note that it is possible to obtain a 5 μs π-pulse for narrower frequency sweeps, since one may use better matching of the RF circuit.
In Figure 7, we show a frequency swept DNP enhancement profile of 40 mM trityl in 60:40 13C-glycerol:D2O acquired at 80 K, where we polarize 1H for 10 s and observe the enhancement via CP on 13C. The frequency given is the offset from 140 GHz, which is on resonance with the center of the EPR spectrum (B0=4993.5 mT). We retune the microwave
cavity at each frequency position to obtain the optimal electron nutation frequency, and acquire 8 shots at each frequency point. The frequency was swept from 139.7 GHz to 140.3 GHz (−300 MHz to 300 MHz in Figure 7), with 121 frequency points recorded. DNP enhancements are observed at the DNP+ and DNP− matching conditions. Note that at each matching condition, the shape of the frequency profile is very similar to the trityl spectrum (Figure 7, top). The maximum enhancement occurs at −212 MHz (DNP+). In Figure 8a, we acquire a spectrum at the maximum enhancement with (on) and without (off) microwave irradiation. Both on and off signals were acquired with a 10 s recycle delay, and the electron nutation frequency was ~6 MHz for the on signal. The on signal is acquired with 32 shots, and the off signal with 6464 shots. We also measure the DNP buildup time (TB) by
incrementing the polarization period, which is shown in Figure 8b. Finally, the 1H T1 is measured by irradiating the sample for 10 s, followed by a period without irradiation, during which 1H T1 relaxation occurs. This is shown in Figure 8c.
If the on and off signals are compared directly, the on signal is found to be 350 times larger than the off signal. However, both on and off signal were acquired with a 10 s recycle delay, whereas the recovery times of the on and off signal are different. The off signal recovers with the 1H T1 (21.7 s) and the on signal recovers with the DNP buildup time (4.4 s); we must account for this difference in recovery time. We do so by applying a scaling factor to the intensity of each spectrum [14]. The scaling factor is given by (1− exp(−tRD/T))−1,
where tRD is the recycle delay and T is the recovery time for a particular experiment, in this
case either TB or T1. This gives the enhancement that would be obtained if both on and off
signals were performed with an infinite recycle delay. Therefore, the enhancement obtained is ε∞ = 144. However, because the DNP buildup time is significantly shorter than the recovery time without DNP, a significant amount of experimental time can be saved and therefore we should also take this into account. We may do so by calculating the DNP sensitivity gain, which is given by . For our experiment, we obtain a sensitivity gain of 310, which is comparable to enhancements obtained with the cross effect [11; 12; 47].
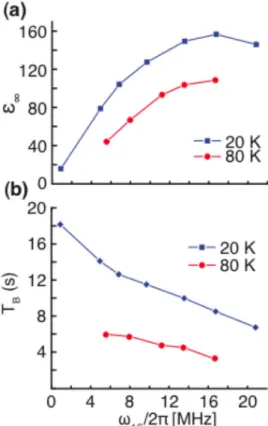
In Figure 9, we show 1H solid effect enhancements and buildup times using a paramagnetic
metal complex, which is a method that was recently demonstrated under MAS-DNP conditions by Corzilius et al. [16]. 10 mM of Gd-DOTA
(1,4,7,10-tetraazacyclododecane-1,4,7,10-tetraacetic acid) was dissolved in 60:40 (v/v) 13
C-glycerol:D2O. DNP was performed at 5022.5 mT, using a microwave frequency of 139.786 GHz, satisfying the solid effect double-quantum condition. Experiments were performed at both 20 K and 80 K. At each of these temperatures, DNP enhancements and buildup times were recorded for various microwave field strengths. Buildup times were determined by varying the polarization time and fitting the results to an exponential function, as was done for trityl in Figure 8. The polarization time was varied from 0.2 s to 32 s, using 16 points spaced logarithmically and 16 shots at each point; the results for the exponential fit are
NIH-PA Author Manuscript
NIH-PA Author Manuscript
plotted in Figure 9b. The nuclear T1 s at 20 K and 80 K were also determined to be 17.3 s at 20 K and 5.0 s at 80 K; the sample was polarized for 10 s, followed by a variable delay and detection, and the signal decay was fitted to an exponential. Finally, the enhancements were determined by comparing on and off signals at 20 K and 80 K. On signals were acquired with 16 and 8 shots at 20 K and 80 K, respectively. Off signals were acquired with 512 and 4480 shots at 20 K and 80 K respectively. Both on and off signals were acquired using a 10 s recycle delay, although the enhancements in Figure 9a are scaled to account for differences in recovery times, as was done to determine trityl enhancements.
In Figure 9, we see increases in enhancement as the microwave field strength is increased, and also see decreases in the buildup time. However, we note that at 20 K, for the highest field strength, the enhancement begins to decrease again, which indicates we have sufficient microwave field strength to begin to saturate the solid effect. We also point out that our maximum enhancements at 20 K and 80 K, being 109 and 157, greatly exceed those recently reported by our lab for MAS-DNP using Gd-DOTA [16]; this is a function of the much greater microwave field strengths available in our microwave cavity. As with trityl, there is an additional sensitivity gain due to the solid effect buildup time being shorter than the inherent nuclear T1, in this case giving sensitivity gains of 223 and 135 for 20 K and 80 K, respectively for the maximum enhancements. Note that the largest sensitivity gain at 20 K is 234, corresponding to the maximum microwave field strength, although the enhancement is slightly lower at this point. The nutation frequencies seen in Figure 9 are considerably larger than those found elsewhere. For Gadolinium, which is S = 7/2, the nutation frequency is four times higher than what would be obtained using a S = 1/2 polarizing agent [50].
4. Conclusions
We have presented significant improvements to EPR and DNP instrumentation, leading to improvements in experimental flexibility, RF stability, and DNP performance. A double-balanced, transmission line probe design with a TE011 coiled resonator that acts as both the
NMR coil and EPR cavity was implemented. With this design, we achieve high electron nutation frequencies and stable RF performance, which had previously been difficult to obtain reliably due to arcing and RF inhomogeneities in a similar, but unbalanced probe design. Also, we presented a novel design for a five-channel, 120 mW, 140 GHz EPR bridge. With this system, we have demonstrated highly efficient performance of EPR and DNP. An enhancement of 144 and sensitivity gain of 310 for the 1H solid effect using trityl far exceeds any previous solid effect experiments at high field (≥3 T) and liquid-nitrogen temperatures. An enhancement of 157 at 20 K using Gd-DOTA is also a milestone for the solid effect. With the integrated NMR and EPR spectrometers and superior DNP
performance, we hope to achieve a better understanding of various DNP processes and further improve DNP methods.
Supplementary Material
Refer to Web version on PubMed Central for supplementary material.
Acknowledgments
This research was supported by the National Institutes of Health (EB002804, EB002026, EB001965 and
EB004866). B. C. acknowledges a postdoctoral fellowship from the Deutsche Forschungsgemeinschaft (DFG). We thank K. Golman and J. H. Ardenkjær-Larsen (Nycomed Innovation AB, now GE Healthcare, Malmo, Sweden) for providing the trityl radical. We thank Alexander Barnes, Evgeny Markhasin, James Hu, and Thorsten Maly for valuable discussions.
NIH-PA Author Manuscript
NIH-PA Author Manuscript
6. Bibliography
[1]. Abragam A, Goldman M. Principles of dynamic nuclear polarisation. Rep. Prog. Phys. 1978; 41:395–467.
[2]. Jeffries, CD. Dynamic Nuclear Orientation, Interscience. New York: 1963.
[3]. Wind RA, Duijvestijn MJ, van d.L. C. Manenschijn A, Vriend J. Applications of dynamic nuclear polarization in 13C NMR in solids. Prog. Nucl. Mag. Res. Sp. 1985; 17:33–67.
[4]. Barnes AB, De Paëpe G, van der Wel PCA, Hu KN, Joo CG, Bajaj VS, Mak-Jurkauskas ML, Sirigiri JR, Herzfeld J, Temkin RJ, Griffin RG. High-Field Dynamic Nuclear Polarization for Solid and Solution Biological NMR. Appl. Magn. Reson. 2008; 34:237–263. [PubMed: 19194532]
[5]. Maly T, Debelouchina GT, Bajaj VS, Hu K-N, Joo C-G, Mak-Jurkauskas ML, Sirigiri JR, van der Wel PCA, Herzfeld J, Temkin RJ, Griffin RG. Dynamic nuclear polarization at high magnetic fields. J. Chem. Phys. 2008; 128:052211–19. [PubMed: 18266416]
[6]. Carver TR, Slichter CP. Experimental Verification of the Overhauser Nuclear Polarization Effect. Phys. Rev. 1956; 102:975.
[7]. Overhauser AW. Polarization of Nuclei in Metals. Phys. Rev. 1953; 92:411.
[8]. Bajaj V, Farrar C, Hornstein M, Mastovsky I, Vieregg J, Bryant J, Elena B, Kreischer K, Temkin R, Griffin R. Dynamic nuclear polarization at 9T using a novel 250GHz gyrotron microwave source. J. Magn. Reson. 2003; 160:85–90. [PubMed: 12615147]
[9]. Becerra L, Gerfen G, Temkin R, Singel D, Griffin R. Dynamic nuclear polarization with a cyclotron resonance maser at 5 T. Phys. Rev. Lett. 1993; 71:3561–3564. [PubMed: 10055008] [10]. Gerfen GJ, Becerra LR, Hall DA, Griffin RG, Temkin RJ, Singel DJ. High frequency (140 GHz)
dynamic nuclear polarization: Polarization transfer to a solute in frozen aqueous solution. J. Chem. Phys. 1995; 102:9494–9497.
[11]. Matsuki Y, Maly T, Ouari O, Karoui H, Le Moigne F, Rizzato E, Lyubenova S, Herzfeld J, Prisner TF, Tordo P, Griffin RG. Dynamic Nuclear Polarization with a Rigid Biradical. Angew. Chem. Int. Ed. 2009; 48:4996–5000.
[12]. Song C, Hu K-N, Swager TM, Griffin RG. TOTAPOL – A Biradical Polarizing Agent for Dynamic Nuclear Polarization Experiments in Aqueous Media. J. Am. Chem. Soc. 2006; 128:11385–90. [PubMed: 16939261]
[13]. Hu K, Yu H, Swager T, Griffin R. Dynamic nuclear polarization with biradicals. J. Am. Chem. Soc. 2004; 126:10844–5. [PubMed: 15339160]
[14]. Smith AA, Corzilius B, Barnes AB, Maly T, Griffin RG. Solid effect dynamic nuclear
polarization and polarization pathways. J. Chem. Phys. 2012; 136:015101. [PubMed: 22239801] [15]. Corzilius. Solid Effect in Magic Angle Spinning Dynamic Nuclear Polarization. J. Chem. Phys.
submitted. 2012
[16]. Corzilius B, Smith AA, Barnes AB, Luchinat C, Bertini I, Griffin RG. High-Field Dynamic Nuclear Polarization with High-Spin Transition Metal Ions. J. Am. Chem. Soc. 2011; 133:5648– 5651. [PubMed: 21446700]
[17]. van der Wel P, Hu K, Lewandowski J, Griffin R. Dynamic nuclear polarization of amyloidogenic peptide nanocrystals: GNNQQNY, a core segment of the yeast prion protein Sup35p. J. Am. Chem. Soc. 2006; 128:10840–6. [PubMed: 16910679]
[18]. Bajaj VS, Mak-Jurkauskas ML, Belenky M, Herzfeld J, Griffin RG. Functional and shunt states of bacteriorhodopsin resolved by 250 GHz dynamic nuclear polarization-enhanced solid-state NMR. Proc. Natl. Acad. Sci. 2009; 106:9244–9249. [PubMed: 19474298]
[19]. Debelouchina GT, Bayro MJ, van der Wel PCA, Caporini MA, Barnes AB, Rosay M, Maas WE, Griffin RG. Dynamic nuclear polarization-enhanced solid-state NMR spectroscopy of
GNNQQNY nanocrystals and amyloid fibrils. Phys. Chem. Chem. Phys. 2010; 12:5911–5919. [PubMed: 20454733]
[20]. Lesage A, Lelli M, Gajan D, Caporini MA, Vitzthum V, Mieville P, Alauzun J, Roussey A, Thieuleux C, Mehdi A, Bodenhausen G, Coperet C, Emsley L. Surface Enhanced NMR Spectroscopy by Dynamic Nuclear Polarization. J. Am. Chem. Soc. 2010; 132:15459–15461. [PubMed: 20831165]
NIH-PA Author Manuscript
NIH-PA Author Manuscript
[21]. Bayro MJ, Debelouchina GT, Eddy MT, Birkett NR, MacPhee CE, Rosay M, Maas WE, Dobson CM, Griffin RG. Intermolecular Structure Determination of Amyloid Fibrils with Magic-Angle Spinning and Dynamic Nuclear Polarization NMR. J. Am. Chem. Soc. 2011
[22]. Prandolini MJ, Denysenkov VP, Gafurov M, Lyubenova S, Endeward B, Bennati M, Prisner TF. First DNP Results from a Liquid Water-TEMPOL Sample at 400 MHz and 260 GHz. Appl. Magn. Reson. 2008; 34:399–407.
[23]. Armstrong BD, Lingwood MD, McCarney ER, Brown ER, Bl,mler P, Han S. Portable X-band system for solution state dynamic nuclear polarization. J. Magn. Reson. 2008; 191:273–281. [PubMed: 18226943]
[24]. Bowen S, Hilty C. Time-Resolved Dynamic Nuclear Polarization Enhanced NMR Spectroscopy. Angew. Chem. Int. Ed. Engl. 2008; 47:5235–5237. [PubMed: 18512824]
[25]. Leggett J, Hunter R, Granwehr J, Panek R, Perez-Linde AJ, Horsewill AJ, McMaster J, Smith G, Kockenberger W. A dedicated spectrometer for dissolution DNP NMR spectroscopy. Phys. Chem. Chem. Phys. 2010; 12:5883–5892. [PubMed: 20458428]
[26]. Jannin S, Bornet A, Colombo S, Bodenhausen G. Low-temperature cross polarization in view of enhancing dissolution Dynamic Nuclear Polarization in NMR. Chem. Phys. Lett. 2011; 517:234– 236.
[27]. Weis V, Bennati M, Rosay M, Griffin RG. Solid effect in the electron spin dressed state: A new approach for dynamic nuclear polarization. J. Chem. Phys. 2000; 113:6795–6802.
[28]. Henstra A, Dirksen P, Schmidt J, Wenckebach WT. Nuclear Spin Orientation via Electron Spin Locking (NOVEL). J. Magn. Reson. 1988; 77:389–393.
[29]. Un S, Prisner T, Weber RT, Seaman MJ, Fishbein KW, McDermott AE, Singel DJ, Griffin RG. Pulsed dynamic nuclear polarization at 5 T. Chem. Phys. Lett. 1992; 189:54–59.
[30]. Hunter RI, Cruickshank PAS, Bolton DR, Riedi PC, Smith GM. High power pulsed dynamic nuclear polarisation at 94 GHz. Phys. Chem. Chem. Phys. 2010
[31]. Feintuch A, Shimon D, Hovav Y, Banerjee D, Kaminker I, Lipkin Y, Zibzener K, Epel B, Vega S, Goldfarb D. A Dynamic Nuclear Polarization spectrometer at 95 GHz/144 MHz with EPR and NMR excitation and detection capabilities. J. Magn. Reson. 2011; 209:136–141. [PubMed: 21296015]
[32]. Nagarajan V, Hovav Y, Feintuch A, Vega S, Goldfarb D. EPR detected polarization transfer between Gd3+ and protons at low temperature and 3.3 T: The first step of dynamic nuclear polarization. J. Chem. Phys. 2010; 132:214504-1–13. [PubMed: 20528028]
[33]. Denysenkov VP, Prandolini MJ, Krahn A, Gafurov M, Endeward B, Prisner TF. High-Field DNP Spectrometer for Liquids. Appl. Magn. Reson. 2008; 34:289–299.
[34]. Granwehr J, Leggett J, Kockenberger W. A low-cost implementation of EPR detection in a dissolution DNP setup. J. Magn. Reson. 2007; 187:266–76. [PubMed: 17560151]
[35]. Armstrong BD, Edwards DT, Wylde RJ, Walker SA, Han S. A 200 GHz dynamic nuclear polarization spectrometer. Phys. Chem. Chem. Phys. 2010; 12:5920–5926. [PubMed: 20461268] [36]. Maly T, Bryant J, Ruben D, Griffin R. A field-sweep/field-lock system for superconducting
magnets--Application to high-field EPR. J. Magn. Reson. 2006; 183:303–7. [PubMed: 17027306]
[37]. Bolton DR, Cruickshank PAS, Robertson DA, Smith GM. Sub-nanosecond coherent pulse generation at millimetr-wave frequencies. Electron. Lett. 2007; 43
[38]. Joye CD, Shapiro MA, Sirigiri JR, Temkin RJ. Demonstration of a 140-GHz 1-kW Confocal Gyro-Traveling-Wave Amplifier. IEEE T. Electron Dev. 2009; 56:818–827.
[39]. Kim HJ, Nanni EA, Shapiro MA, Sirigiri JR, Woskov PP, Temkin RJ. Amplification of Picosecond Pulses in a 140-GHz Gyrotron-Traveling Wave Tube. Phys. Rev. Lett. 2010; 105:135101. 1–4. [PubMed: 21230783]
[40]. Epel B, Gromov I, Stoll S, Schweiger A, Goldfarb D. Spectrometer manager: A versatile control software for pulse EPR spectrometers. Concepts Magnetic Res. B. 2005; 26B:36–45.
[41]. Hyde JS. ENDOR of Free Radicals in Solution. J. Chem. Phys. 1965; 43:1806–1818.
[42]. Gruber K, Forrer J, Schweiger A, Gunthard HH. Computer controlled ENDOR spectrometer. J. Phys. E: Sci. Inst. 1974; 7:569.
NIH-PA Author Manuscript
NIH-PA Author Manuscript
[43]. Weis V, Bennati M, Bryant JA, Griffin RG. High-Field DNP and ENDOR with a Novel Multiple-Frequency Resonance Structure. J. Magn. Reson. 1999; 140:293–299. [PubMed: 10479576]
[44]. Engelke F. Electromagnetic wave compression and radio frequency homogeneity in NMR solenoidal coils: Computational approach. Concepts Magnetic Res. 2002; 15:129–155. [45]. Hartmann SR, Hahn EL. Nuclear Double Resonance in the Rotating Frame. Phys. Rev. 1962;
128:2042–2053.
[46]. Traficante DD. Introduction to Transmission Lines. Concepts Magnetic Res. 1992; 5:57–86. [47]. Kiesewetter M. Dynamic Nuclear Polarization with a Water-Soluble Rigid Biradical. J. Am.
Chem. Soc. 2012; 134:4537–4540. [PubMed: 22372769]
[48]. Stoll S, Schweiger A. EasySpin, a comprehensive software package for spectral simulation and analysis in EPR. J. Magn. Reson. 2006; 178:42–55. [PubMed: 16188474]
[49]. Mims WB. Envelope Modulation in Spin-Echo Experiments. Phys. Rev. B. 1972; 5:2409. [50]. Astashkin AV, Schweiger A. Electron-spin transient nutation: a new approach to simplify the
interpretation of ESR spectra. Chemical Physics Letters. 1990; 174:595–602.
NIH-PA Author Manuscript
NIH-PA Author Manuscript
• Spectrometer for pulsed EPR and DNP experiments at 140 GHz/211 MHz • balanced helical cavity which serves as a EPR resonator and doubly tuned NMR
coil.
• 6 MHz nutation frequency for S = ½ electrons, 100 kHz on 1H, and 50 kHz
on 13C.
• solid effect DNP enhancement of 144 and sensitivity gain of 310
NIH-PA Author Manuscript
NIH-PA Author Manuscript
Figure 1. 140 GHz EPR Bridge Design
Schematic for generation of pulsed at 140 GHz and detection of EPR signal. Microwave pulses are generated at 8.75 GHz (8.25 GHz–9.25 GHz for ELDOR channel), and multiplied and mixed to 140 GHz for 120 mW pulses. Signal is referenced to 131.25 GHz, and detected using a heterodyne quadrature detector operating at 8.75 GHz which down-converts signal for detection. Red indicates the pulse generation, blue indicates the down-mixing source, and green indicates the quadrature detection.
NIH-PA Author Manuscript
NIH-PA Author Manuscript
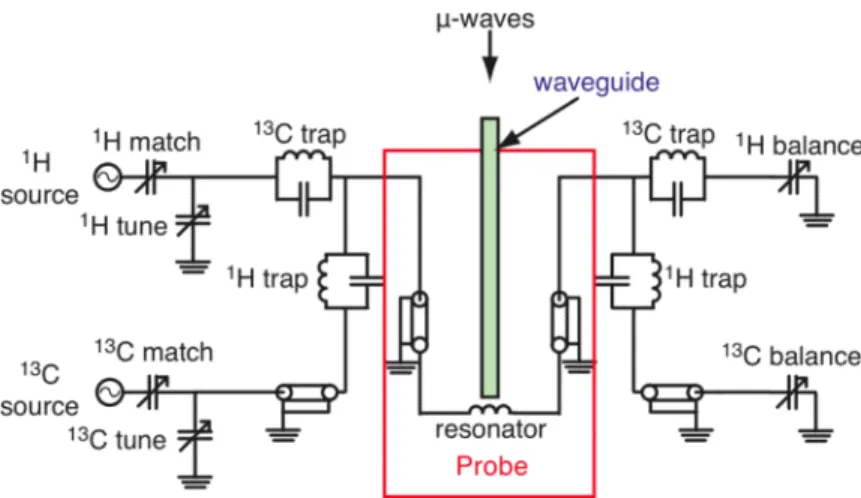
Figure 2. DNP Probe Design
Physical design of the DNP probe. (a) Full probe and removable circuit-box. (b) Coiled TE011 resonator that serves as both a microwave resonator and an RF coil. (c) Resonator
with microwave tuning plungers, sample space, microwave entry, and RF connections. Parts (b) and (c) partially adapted from Ref. [43].
NIH-PA Author Manuscript
NIH-PA Author Manuscript
Figure 3. Balanced RF Circuit Design
Circuit design for a double-balanced (1H, 13C) DNP probe. A balanced NMR probe is achieved by having symmetric circuitry between the tune and balance capacitors on each channel, placing a voltage node at the center of the resonator coil. Polyflon variable capacitors are used. Transmission lines are 1 m in length with a Teflon dielectric (1 m≈λ1H≈λ13C/4).
NIH-PA Author Manuscript
NIH-PA Author Manuscript
Figure 4. Full Spectrometer Configuration
Full schematic for the integration of the EPR and NMR spectrometer. Separate computers and pulse programmers (PP) control EPR and NMR spectrometers. The computers are labeled SpecMan and RNMR respectively. SpecMan controls the ELDOR frequency, the microwave attenuator, the magnetic field, and the EPR pulse programmer. RNMR controls RF pulse generation and NMR detection. Both pulse programmers can be externally triggered, allowing simple configuration of ENDOR and pulsed-DNP experiments, as well as simultaneous EPR and NMR detection.
NIH-PA Author Manuscript
NIH-PA Author Manuscript
Figure 5. Simultaneous EPR and NMR Detection
Pulse sequence to perform DNP transfer and detect e− and 1H (detected on 13C) polarizations after the DNP polarization period. We use a CP transfer to 13C to measure the 1H polarization, and use a Hahn echo to measure the e− polarization.
NIH-PA Author Manuscript
NIH-PA Author Manuscript
Figure 6. EPR Experiments
(a) Echo-detected spectrum of bTbtk-py, acquired with a Hahn echo (pseudo-modulated spectrum calculated with EasySpin [48]). (b) ELDOR hole-burning experiment on a sample of 40 mM trityl in 60:40 glycerol:D2O. The external field and ELDOR frequency were
swept together to keep the ELDOR frequency on resonance with the center of the EPR spectrum. (c) Mims ENDOR of BDPA in polystyrene, with π/2=45 ns and τ=200 ns.
NIH-PA Author Manuscript
NIH-PA Author Manuscript
Figure 7. Solid effect DNP Enhancement Profile
DNP enhancement profile of 40 mM trityl in 60:40 13C glycerol:D2O that was obtained by
sweeping the microwave frequency rather than the magnetic field, which is fixed at 4993.5 mT. Note that the EPR cavity was retuned at each frequency. The EPR spectrum shown above the enhancement profile is a field-swept spectrum of 1 mM trityl in 60:40 glycerol:D2O. Although the EPR spectrum was acquired with a field sweep, it is
straightforward to convert this to a frequency axis, which we have done in this figure.
NIH-PA Author Manuscript
NIH-PA Author Manuscript
Figure 8. Solid effect DNP Sensitivity Gain
(a) On signal versus off signal using trityl, scaled to the relative intensities for infinite recycle delay, giving an enhancement of 144 and an overall sensitivity gain of 310. The off-signal has been multiplied by a factor 20 for improved visibility. (b) Buildup of nuclear polarization, with a time constant TB. (c) Decay of nuclear polarization with a time constant
of T1.
NIH-PA Author Manuscript
NIH-PA Author Manuscript
Figure 9. Microwave Field Strength and Temperature Dependence of Gd-DOTA Enhancements (a) Solid effect enhancements using Gd-DOTA at 20 K and 80 K as a function of
microwave field strength. (b) Buildup times (TB) at 20 K and 80 K as a function of
microwave field strength.