HAL Id: hal-00665507
https://hal.archives-ouvertes.fr/hal-00665507
Submitted on 18 Nov 2020
HAL is a multi-disciplinary open access
archive for the deposit and dissemination of
sci-entific research documents, whether they are
pub-lished or not. The documents may come from
teaching and research institutions in France or
abroad, or from public or private research centers.
L’archive ouverte pluridisciplinaire HAL, est
destinée au dépôt et à la diffusion de documents
scientifiques de niveau recherche, publiés ou non,
émanant des établissements d’enseignement et de
recherche français ou étrangers, des laboratoires
publics ou privés.
Distributed under a Creative Commons Attribution - NoDerivatives| 4.0 International
License
Statistical analysis of polychaete population density:
dynamics of dominant species and scaling properties in
relative abundance fluctuations
B. Quiroz-Martinez, François G Schmitt, Jean-Claude Dauvin
To cite this version:
B. Quiroz-Martinez, François G Schmitt, Jean-Claude Dauvin. Statistical analysis of polychaete
population density: dynamics of dominant species and scaling properties in relative abundance
fluctu-ations. Nonlinear Processes in Geophysics, European Geosciences Union (EGU), 2012, 19, pp.45-52.
�10.5194/mpg-19-45-2012�. �hal-00665507�
www.nonlin-processes-geophys.net/19/45/2012/ doi:10.5194/npg-19-45-2012
© Author(s) 2012. CC Attribution 3.0 License.
Nonlinear Processes
in Geophysics
Statistical analysis of polychaete population density:
dynamics of dominant species and scaling properties in relative
abundance fluctuations
B. Quiroz-Martinez1,2,3, F. G. Schmitt1,2,3, and J.-C. Dauvin1,2,3,4
1Univ. Lille Nord de France, 59000 Lille, France 2USTL, LOG, 62930 Wimereux, France
3CNRS, Laboratoire d’oc´eanologie et de g´eosciences (LOG), UMR8187, 62930 Wimereux, France 4Universit´e de Caen-Basse Normandie CNRS, UMR M2C 6143, 14000 Caen, France
Correspondence to: F. G. Schmitt ([email protected])
Received: 29 April 2010 – Revised: 10 October 2011 – Accepted: 21 December 2011 – Published: 5 January 2012
Abstract. We consider here the dynamics of two polychaete
populations based on a 20 yr temporal benthic survey of two muddy fine sand communities in the Bay of Morlaix, Western English Channel. These populations display high temporal variability, which is analyzed here using scaling approaches. We find that population densities have heavy tailed proba-bility density functions. We analyze the dynamics of rela-tive species abundance in two different communities of poly-chaetes by estimating in a novel way a “mean square drift” coefficient which characterizes their fluctuations in relative abundance over time. We show the usefulness of using new tools to approach and model such highly variable population dynamics in marine ecosystems.
1 Introduction
One of the key features of environmental and geophysi-cal field studies is their high variability at many different time and space scales. Because of these external influences and also because of the stochasticity introduced by the re-production and predator prey processes, population dynam-ics are also characterized by high variability over time and space (Pimm and Redfearn, 1988; Blarer and Doebeli, 1999; Ferriere and Cazelles, 1999; Inchausti and Halley, 2001; Schmitt et al., 2008). The dynamics of many natural pop-ulations involve intermittent rarity, the alternation over vari-able periods of time of phases of extremely low abundance and short outbreaks (Ferriere and Cazelles, 1999). While many studies in population ecology have focused on aver-age evolutions over time, several recent studies have been concerned by the modeling of their large events or extremes (Gaines and Denny, 1993; Arino and Pimm, 1995; Katz et
al., 2005; Pascual and Guichard, 2005; Reynolds and Freck-leton, 2005). Large values are ecologically important for many reasons: large numbers of individuals of a species may lead to higher ecological pressure on preys and competitors, but also higher availability for predators. For example, in the framework of marine ecology, phytoplankton blooms show very large densities, and may induce ecological disturbances of the marine coastal ecosystems (Boyer et al., 2009).
The search for universal scaling laws in biodiversity and ecology often involves considering a form of power-law dis-tribution (Katz et al., 2005). As reviewed by Marquet et al. (2007), power laws can emerge in population dynamics (Keitt and Stanley, 1998; Ferriere and Cazelles, 1999) or in patterns of abundance, distribution, and richness (Frontier, 1985; Banavar et al., 1999; Harte et al., 1999, 2001; Mar-quet, 2002; Labra et al, 2005). In this paper, we consider two polychaete sets of data, as they are considered good sur-rogates to identify the main environmental conditions that control the structure and functioning of benthic communi-ties (Dauvin et al., 1994; Olsgard et al., 2003; Mutlu et al., 2010). Polychaetes colonize a large range of soft and hard marine sediment habitats, from intertidal to hadal (parts of the ocean below 6000 m) zones. This group often domi-nates benthic macrofauna (Gr´emare et al., 1998) and has been shown to constitute a good surrogate for describing its distribution (Olsgard et al., 2003); they can also be used as markers of different ecological conditions (Gambi and Gi-angrande, 1986). Numerous reproductive strategies linked to different life spans can be found in polychaetes; these life spans may range from only weeks to several years; lar-val planktonic duration varies from some hours to several months (Giangrande, 1997).
46 B. Quiroz-Martinez et al.: Statistical analysis of polychaete population density RM PN 5°E 5°E 0° 0° 5°W 5°W 52°N 52°N 50°N 50°N 48°N 48°N 0 50 100 200km RM PN Baie de Morlaix NORTH SEA FRANCE ENGLAND ENGLISH CHA NNEL
Fig. 1. Location of sampling stations.
Based on long-term series changes in diversity of two soft-bottom communities, we study the dynamics of polychaete populations using different statistical techniques. In a first section, we present the databases. Then, we consider the total abundance and show that they have heavy tail distributions, and we consider the relation between total abundance and species diversity. In a second section, we focus on dynamical properties of some relative abundance time series extracted from the biodiversity databases and find a general scaling re-lation between the magnitude of the “ecological drift” and the relative abundance. The last section is a discussion and conclusion.
2 Databases, abundance distribution and species richness
2.1 Presentation of the databases
In 1977, a benthic survey of temporal changes was under-taken to perform a long-term monitoring over 20 yr of two fine sand communities from the Bay of Morlaix (Pierre Noire and Riviere de Morlaix), Western English Channel, France (Fig. 1). During this 20-yr survey (1977–1996), the macro-zoobenthos was sampled at Pierre Noire (137 dates) and Riv-iere de Morlaix (97 dates). The Pierre Noire (PN) site is located in the eastern part of the Bay of Morlaix, Brittany (western English Channel) (48◦42,500N; 3◦51,960W), 17 m depth at low tide. The Riviere de Morlaix (RM) site is lo-cated at (48◦39,270N; 3◦52,080W), 10 m depth at low tide,
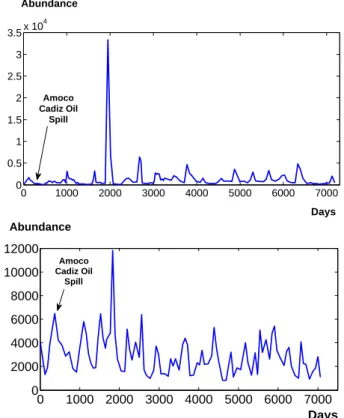
in an area under freshwater influence. These two commu-nities were sampled regularly (every one or two months de-pending on the period) from 1977 to 1996, using the same sampling and laboratory methodology (Dauvin, 1998, 2000; Dauvin and Carbon, 1999). The databases considered here correspond to matrices where each column is the sampling date and each line a given species abundance, with many ze-roes (over 65 and 72 % of zeze-roes for PN and RM datasets, respectively). 0 1000 2000 3000 4000 5000 6000 7000 0 0.5 1 1.5 2 2.5 3 3.5x 10 4 Days Abundance Amoco Cadiz Oil Spill 0 1000 2000 3000 4000 5000 6000 7000 0 2000 4000 6000 8000 10000 12000 Days Amoco Cadiz Oil Spill Abundance
Fig. 2. Variations of polychaete abundance in (a) Pierre Noire site (above) and (b) Riviere de Morlaix site (below).
The English Channel is a megatidal sea where fine sedi-ments are confined to the shallow waters of bays and estu-aries and where fine-sand and muddy fine-sand communi-ties such as Pierre Noire and Riviere de Morlaix are isolated communities, separated by other substrata (rocky, pebbly and gravely, coarse sand, ma¨erl) (Dauvin, 1998).
2.2 Heavy tails in probability distributions of total abundance data
We first consider total abundance data: the time series for polychaete total abundance in PN and RM stations are shown in Fig. 2a and b, respectively, where we represent the sum of all species. These plots illustrate the high variability of these populations, and the burst-like events associated to sudden population outbreaks. The 10 most abundant species in each dataset are given in Tables 1 and 2 and Tables 3 and 4 give the abundance of species belonging to the Spionid family as they are one of the most representative and abundant families of polychaetes.
Let us note also that both sites were polluted by hydro-carbons from the Amoco Cadiz wreck in April 1978. The spill’s impact was more pronounced at PN than in RM site (Dauvin, 1998, 2000); however, here we do not focus on the influence of this particular event, and consider the species dy-namics as a whole. The primary effects of the Amoco Cadiz oil spill in spring 1978 were only important at the PN site
Table 1. List of most abundant species and contribution to total abundance for the PN site.
Species Total Contribution
Abundance % Pseudopolydora pulchra 88 657 23 Spio decoratus 81 028 21 Paradoneis armata 42 627 11 Chaetozone gibber 24 718 6 Marphysa belli 18 227 5 Aricidea fragilis 14 846 4 Nephtys hombergii 14 729 4 Scoloplos armiger 12 521 3 Spiophanes bombyx 8334 2 Euclymene oerstedi 7430 2
Pierre Noire site 382 732 –
Table 2. List of most abundant species and contribution to total abundance for the RM site.
Species Total Contribution
Abundance % Chaetozone gibber 127 578 44 Melinna palmata 54 484 19 Pseudopolydora pulchra 23 417 8 Nephtys hombergii 19 973 7 Euclymene oerstedi 19 973 7 Mediomastus fragilis 9757 3 Aphelochaeta marioni 9332 3 Lanice conchilega 7901 3 Clymenura clypeata 6904 2.5 Notomastus latericeus 5097 2
Riviere de Morlaix site 287 659 –
where amphipod Ampelisca dominated before the oil spill while at RM tolerant polychaetes such as Chaetozone gibber dominated. At PN, the spill was abrupt and the amphipod populations disappeared immediately with the introduction of hydrocarbons in the sediment (Dauvin, 1998); the poly-chaetes were not affected by the oil spill except for a small increase in abundance of a Heterocirrus alatus population (Cirratulidae) at Pierre Noire site during the autumn 1978 and the summer increase of Pseudopolydora pulchra at both sites in 1982 (Dauvin, 2000).
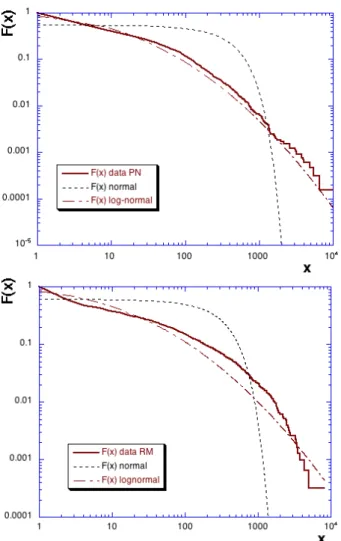
We considered the total abundance, for all sampling dates and locations considered together, in order to characterize their probability distribution function. For this we focus on the complementary cumulative distribution function F (x) = Pr(X ≥ x) =R∞
x p(x
0)dx0where p(x) is the probability
den-sity function (pdf). This function is shown for both PN and RM databases in Fig. 3a–b. In the same plots, we also rep-resent a fit obtained for a normal random variable with the same mean and variance as the times series (µPN=58.3,
Table 3. List of most abundant Spionid species and contribution to total spionid abundance for the PN site.
Species Total Contribution
Abundance % Pseudopolydora pulchra 88 657 48.8 Spio decoratus 81 028 44.6 Spiophanes bombyx 8334 4.6 Polydora flava 2643 1.46 Microspio meckzikowianus 475 0.26 Prionospio malmgreni 240 0.13 Scolelepis girardi 144 0.08 Spiophanes kroyeri 28 0.02 Aonides oxycephala 19 0.01 Nernine bonnieri 16 0.01 Nerinides cantabra 9 0 Polydora caeca 3 0 Prionospio cirrifera 2 0 Scolelepis ciliata 2 0
Pierre Noire site 181 600 –
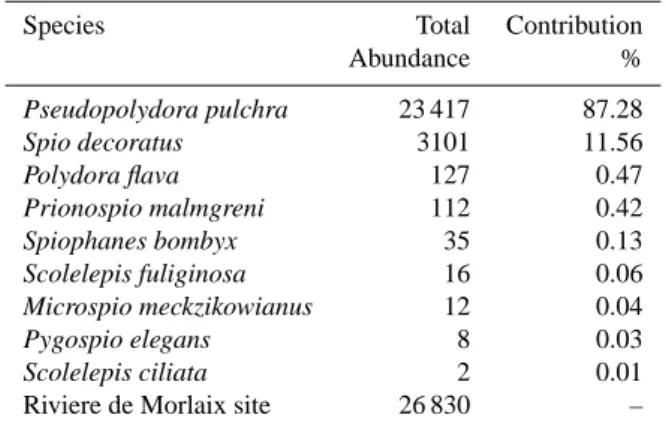
Table 4. List of most abundant Spionid species and contribution to total spionid abundance for the RM site.
Species Total Contribution
Abundance % Pseudopolydora pulchra 23 417 87.28 Spio decoratus 3101 11.56 Polydora flava 127 0.47 Prionospio malmgreni 112 0.42 Spiophanes bombyx 35 0.13 Scolelepis fuliginosa 16 0.06 Microspio meckzikowianus 12 0.04 Pygospio elegans 8 0.03 Scolelepis ciliata 2 0.01
Riviere de Morlaix site 26 830 –
σPN=456.3 and µRM=92.5, σRM=345.2). We also
rep-resent lognormal fits with the same mean and variance as the logarithm of experimental data (µ0PN=2.09, σPN0 =1.86 and µ0RM=2.05, σRM0 =2.09). The normal fits are very far from the data, whereas the lognormal fit are much closer, es-pecially for the PN case, however a Kolmogorov-Smirnov test of lognormality of the data gave negative results for both datasets. Since the tail of the continuous curve in Fig. 3a is approximately linear, we have also tested the power-law fit (hyperbolic tail for the probability density function of the form p(x) ≈ x−α for large x values) using recently pro-posed procedures in Clauset et al. (2009). We have used Matlab codes given by the main author in the companion page of his paper1. The first step of the proposed method
1See http://tuvalu.santafe.edu/∼aaronc/powerlaws, last
48 B. Quiroz-Martinez et al.: Statistical analysis of polychaete population density
Fig. 3. The complementary cumulative distribution function (log-log plot) of polychaete abundance: (a) in Pierre Noire site (above) and (b) in Riviere de Morlaix site (below). The continuous lines correspond to the data, dotted lines to normal distributions obtained from the same mean and variance as experimental data, and dash-dotted lines to a lognormal distribution with the same mean and variance as the logarithm of experimental data.
is to estimate the lower threshold xmin for which a
power-law fit of the pdf is optimal, and the power-power-law tail α. We obtain αPN=2.18 ± 0.1 and xminPN=99 ± 52 and αRM=
2.33 ± 0.4 and xminRM=443 ± 280 for, respectively, the PN
and RM datasets, where the error bars are obtained using the procedure described in Clauset et al. (2009). The second step of the method is important and called MLE (maximum likelihood estimator); it uses goodnes-of-fits based on the Kolmogorov-Smirnov test in order to determine if the data are consistent with a power-law hypothesis. The output of the method is a p-value, fraction of synthetic distances that are larger than the empirical distance from a pure power law. It is a number between 0 and 1 indicating the validity of the power-law fit: when p < 0.1 the power-law hypothesis is re-jected. We obtained pPN=0.03 and pRM=0.007, showing
0 2000 4000 6000 8000 20 30 40 50 60 Abundance Pierre Noire Riviere de Morlaix Species Richness
Fig. 4. Species richness versus total abundance for each sampling date. Conditional averages are shown as continuous lines.
that, even if visually the tail in Fig. 3a is approximately lin-ear, the distribution is not purely a power-law.
These results show that total abundance data are heavy-tailed, with a distribution which is not lognormal nor power-law. We do not push further here the search for the adequate distribution and note that this could belong to generalized Gamma distributions.
2.3 Relation between total abundance and species richness
A possible definition of biological diversity is “the variety and abundance of species in a defined unit of study” (Magur-ran, 2004). Abundance and relative abundance are often con-sidered amongst the many facets of diversity as the impor-tance (relative or absolute) of species is implicitly involved in the estimation of species richness. In this framework, a general pattern of biodiversity is the richness-abundance re-lation, where species diversity (total number of species) is larger when total abundance of the sample is larger (Marquet et al., 2007).
There were many different polychaete species identified for each sampling station: a total of 140 species for Pierre Noire site and 115 species for Riviere de Morlaix site. Fig-ure 4 shows the species richness (total number of polychaete species found) versus the total abundance, for each sampling date. The two databases form clouds of data over which we calculated a conditional average using a local Gaussian ker-nel smoothing (Wand and Jones, 1995). This method is use-ful to extract a smooth nonlinear conditional average evolu-tion based on a cloud of points. The resulting curves show that there is an increase of the species richness with total abundance; they also provide an illustration of this species richness-abundance relationship.
The PN site has approximately a species richness which is twice the one of RM site, for the same total abundance. We found that the conditional average relationship between species richness and total abundance is increasing with in-creasing abundance, in agreement with one of the general patterns in biodiversity (Marquet et al., 2007). These results also show that the RM site is substantially less species-rich than the PN site; the former is under estuarine influence and is also a zone with a natural accumulation of mud fine par-ticles enriched in organic matter. These estuarine benthic communities are generally less species-rich than open ma-rine communities such as the PN site (Dauvin, 1997).
3 Dynamical properties: relative abundance and ecological drift
3.1 Relative abundance
In the previous section we considered the statistics of total abundance time series. In this section, we are interested in some dynamical properties of these databases, focusing mainly on species information. We consider the quantifica-tion of the relative abundance fluctuaquantifica-tions in relaquantifica-tion with the mean abundance of one species. We consider here relative abundance data, i.e. species abundance fluctuations relative to the total population abundance. For this, we normalized each species abundance by the total abundance N (t ) at time t. For a species i with abundance Ni(t )at time t , we
intro-duce the ratio ri(t )according to:
ri(t ) =
Ni(t )
N (t ) (1)
This transforms the species dynamics with high burst val-ues between 0 and large positive numbers, to a relative abun-dance dynamics between 0 and 1. Using this approach, we discuss below a dynamical property which is found for all species.
3.2 Ecological drift and its quantification
In the field of genetic population dynamics, the concept of genetic drift of an isolated population is now classical. This drift is the consequence of the intrinsic random nature of the reproduction process. It is characterized by a stochastic vari-ability of some gene’s frequency inside a finite population, from one generation to the next. Similarly, a theory of dy-namical biodiversity has been developed in the last decade, Hubbell’s neutral theory of biodiversity and biogeography (Hubbell, 2001; He and Hu, 2005; Hu et al., 2006), which was inspired by Kimura’s Neutral Theory of Molecular Evo-lution in the field of population genetics (Kimura, 1994). In Hubbell’s theory, genes are replaced by species and the con-cept of ecological drift was introduced (Hubbell, 2001), to characterize the temporal evolution of relative abundance of
a species inside a finite isolated community. Here, using ma-rine benthic databases, we aim to quantify such ecological drift. We must emphasize that we borrow here the concept of ecological drift and relative abundance, but this has no rela-tion with the validity of the hypotheses of neutral theory for the database analyzed. In other words, we borrow a concept, but we do not need the underlying hypotheses of the theory.
In order to characterize the fluctuations of a species’ dy-namics, we consider its mean square displacement (MSD) (which could also be seen as its mean square drift):
MSD = 1r(t )2 (2)
where 1r(t) = r(t)−r(t −1) and the relative abundance here is estimated with respect to the total polychaetes population. For the study of such dynamics, we considered only sub-samples of our databases for which the sampling period was regular (from 1978 to 1981 for PN data, monthly samples, and from 1980–1996 for RM, with five samples per year). Relative abundance is a strongly fluctuating quantity. Ta-bles 3 and 4 show the population dynamics MSD for the most abundant species, the average value MSDmestimated over all
species, and the ratio MSD/MSDmin order to quantify the
difference in the ecological drift of several abundant species. We see that species with high MSD are the most abundant in the communities and display high variability in their abun-dance values; conversely rare species have low MSD values and similarly low variability in abundance.
Hu et al. (2006) have argued that the ecological drift is likely to be larger for rarer species, whereas abundant species should have a low ecological drift. This prediction was based on the analogy between ecological drift and genetic drift, and on the neutral model where ecological drift is obtained from a random birth and death process chosen among randomly chosen species, explaining the prediction of a smaller effect for large community sizes. Here we have tested this predic-tion using the populapredic-tion dynamics mean square displace-ment as a measure of the strength of the ecological drift. Figure 5 shows the mean species relative abundance < r > versus MSD, in log-log plot. This relation is the opposite of what could be expected according to Hu et al. (2006) with an increase and not a decrease of the ecological drift of a species with its abundance. Moreover, we find a remarkable scaling relation:
MSD = C < r >β (3)
with β = 1.5 and C = 0.2. The power law relation found here has an exponent of 1.5, for which we have no interpretation. This relation could be linked to a more general allometric relation. It is also remarkable that in Fig. 5, the two databases perfectly collapse, whereas for other comparisons (i.e. Fig. 4) the curves were quite different for PN and RM series.
50 B. Quiroz-Martinez et al.: Statistical analysis of polychaete population density
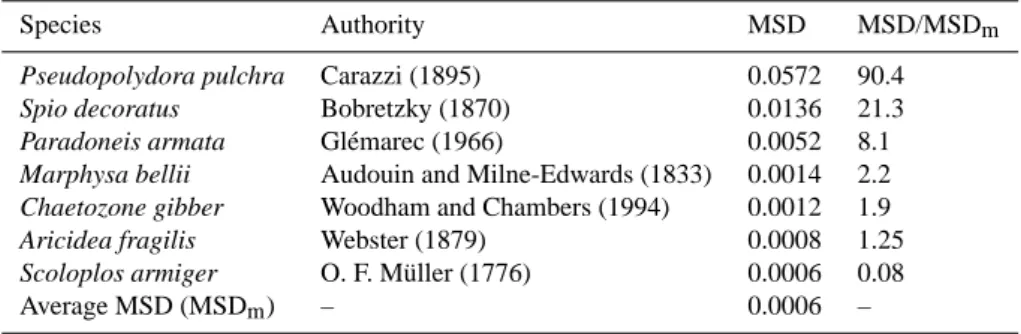
Table 5. Mean square drift (MSD) for the most abundant species of polychaetes in PN station. The third column is the normalised coefficient.
Species Authority MSD MSD/MSDm
Pseudopolydora pulchra Carazzi (1895) 0.0572 90.4
Spio decoratus Bobretzky (1870) 0.0136 21.3
Paradoneis armata Gl´emarec (1966) 0.0052 8.1
Marphysa bellii Audouin and Milne-Edwards (1833) 0.0014 2.2 Chaetozone gibber Woodham and Chambers (1994) 0.0012 1.9
Aricidea fragilis Webster (1879) 0.0008 1.25
Scoloplos armiger O. F. M¨uller (1776) 0.0006 0.08
Average MSD (MSDm) – 0.0006 –
Table 6. Mean square drift (MSD) for the most abundant species of polychaetes in RM station. The third column is the normalised coefficient.
Species Authority MSD MSD/MSDm
Chaetozone gibber Woodham and Chambers 0.048 54.21
Melinna palmata Grube (1870) 0.02 23.94
Pseudopolydora pulchra Carazzi (1895) 0.016 19.62 Nephtys hombergii de Savigny in Lamarck (1818) 0.008 7.96 Aphelochaeta marioni de Saint Joseph (1894) 0.0016 1.76 Euclymene oerstedii Clapar`ede (1863) 0.0006 0.82 Mediomastus fragilis Rasmussen (1973) 0.0004 0.51
Average MSD (MSDm) – 0.0009 –
Fig. 5. MSD as a function of polychaete species mean relative abundance. Species with high MSD values are the most abundant in the communities; conversely rare species have low MSD. Equation of the fit: MSD = 0.2 < r >1.5.
4 Discussion and conclusion
In this paper, we have considered the community dynamics inside the highly variable total abundance. For this, we have normalized the data, at each time step, by the total dance. Each species was characterized by a relative abun-dance value, bounded between 0 and 1. We considered the “ecological drift”, corresponding to the time evolution of the
relative abundance of a species and proposed, for the first time, a quantification of the strength of this drift, using the mean square displacement coefficient from one time step to the other. We found that this coefficient is related to the abun-dance of the species; Tables 5 and 6 indicate that the strength of the ecological drift is stronger for abundant species, pro-viding a relation which is the opposite of what could be ex-pected according to Hu et al. (2006) in the framework of neutral theory. This result has indicated that the more abun-dant a species is, the more it fluctuates, this being a possible manifestation of species turnover (Vilenkin, 2006). This re-lation could be linked to a more general allometric rere-lation. Gaston and McArdle (1994) mention that the abundance of animals in different habitats can have different variabilities and that these are thought to be driven by levels of tempo-ral variability exhibited by the habitats. The more variable the environment the larger temporal variability is likely to be; disturbed or temporally variable habitats tend to be oc-cupied by species with high rates of population growth, like opportunistic species (i.e. Pseudopolydora pulchra and Spio decoratus). The results we found confirm and quantify such observations. Dauvin (1998) has shown similar patterns with periodic alternation between cold and hot winters in the Bay of Morlaix and identified them as the main driver of the long-term changes of the Pierre Noire community after the Amoco Cadiz spill which remains the main event during the 1977– 1996 survey.
Nearshore estuarine and marine infaunal communities are often characterized by high variability in abundance and in dominance patterns between years (Peterson, 1975; Ma-honey and Livingston, 1982; Flint and Kalke, 1985; Holland, 1985; Nichols, 1985; Posey, 1986), although there are exam-ples of long-term stability in dominance for lower salinity areas (Hines et al., 1987; Holland et al., 1987). Despite this variability, these infaunal communities are generally dom-inated by relatively few taxa, with less than 10–20 % of species often comprising larger than 99 % of a community by number, and most other taxa represented by only a few individuals. Here we have recalled that both communities are indeed dominated by very few numbers of species (i.e. Pseudopolydora pulchra, Spio decoratus, Chaetozone gib-ber...) but nevertheless we found common patterns valid for all species, whatever their total abundance. In future works we will apply and develop these methodologies to other bio-diversity databases, in order to determine the degree of gen-erality and potential universality of this scaling relationship.
Acknowledgements. This work was supported by Consejo Na-cional de Ciencia y Tecnologa (CONACyT), Mexico. We thank all the persons who collected and sorted the specimens at the Roscoff Marine Biological Station, France. We thank Denis Marin for his help with the map and anonymous reviewers for their comments. We have used the Matlab code available http://tuvalu.santafe.edu/∼aaronc/powerlaws for the power law
test of abundance distribution, and thank Aaron Clauset for some exchanges on his programs.
Edited by: S. Lovejoy
Reviewed by: L. Seuront, B. Watson, and another anonymous referee
The publication of this article is financed by CNRS-INSU.
References
Arino, A. and Pimm, S. L.: On the nature of population extremes, Evolution. Ecol., 9, 429–443, 1995.
Banavar, J. R., Green, J. L., Harte, J., and Maritan, A.: Finite Size Scaling in Ecology, Phys. Rev. Lett., 83, 4212–4214, 1999. Blarer, A. and Doebeli, M.:Resonance effects and outbreaks in
eco-logical time series, Ecol. Lett., 2, 167–177, 1999.
Boyer, J. N., Kelble, C. R., Ortner, P. B., and Rudnick, D. T.: Phy-toplankton bloom status: Chlorophyll a biomass as an indicator of water quality condition in the southern estuaries of Florida, USA, Ecol. Indicat., 9, S56–S67, 2009.
Clauset, A., Shalizi, C. R., and Newman M. E. J.: Power-Law Dis-tributions in Empirical Data, SIAM Review, 51, 661–703, 2009.
Dauvin, J. C.: ´Evolution `a long terme des peuplements de s´ediments fins sablo-vaseux de la Manche et de la mer du Nord, Oc´eanis, 23, 113–144, 1997.
Dauvin, J. C.: The Fine Sand Abra alba Community of the Bay of Morlaix Twenty Years after the Amoco Cadiz Oil Spill, Mar. Pollut. Bull., 36, 669–676, 1998.
Dauvin, J. C.: The Muddy Fine Sand Abra alba–Melinna palmata Community of the Bay of Morlaix Twenty Years after the Amoco Cadiz Oil Spill, Mar. Pollut. Bull., 40, 528–536, 2000.
Dauvin, J. C. and Carbon, J.: Variabilit´e temporelle de la diver-sit´e des peuplements de s´ediments fins de la baie de Morlaix, Oc´eanis, 25, 343–375, 1999.
Dauvin, J. C., Kendall, M., Paterson, G., Gentil, F., Jirkov, I., Sheader, M., and De Lange, M.: An initial assessment of poly-chaete diversity in the northeastern Atlantic Ocean, Biodiv. Lett., 2, 171–181, 1994.
Ferriere, R. and Cazelles, B.: Universal power laws govern inter-mittent rarity in communities of interacting species, Ecology, 80, 1505–1521, 1999.
Flint, R. W. and Kalke, R. D.: Benthos structure and function in a south Texas estuary, Contrib. Mar. Sci., 28, 33–53, 1985. Frontier, S.: Diversity and structure in aquatic ecosystems,
Oceanogr. Mar. Biol. Ann. Rev., 23, 253–312, 1985.
Gaines, S. D. and Denny, M. W.: The Largest, Smallest, Highest, Lowest, Longest, and Shortest: Extremes in Ecology, Ecology, 74, 1677–1692, 1993.
Gambi, M. C. and Giangrande, A.: Distribution of soft-bottom polychaetes in two coastal areas of the Tyrrhenian Sea (Italy): Structural Analysis, Estuarine, Coast. Shelf Sci., 23, 847–862, 1986.
Gaston, K. J. and McArdle, B. H.: The temporal variability of an-imal abundances: measures, methods and patterns, Phil. Trans. Roy. Soc. B, 345, 335–358, 1994.
Giangrande, A.: Polychaete reproductive patterns, life cycles and life histories: an overview, Oceanogr. Mar. Biol. Ann. Rev., 35, 323–386, 1997.
Gr´emare, A., Amouroux, J. M., and Vetion, G.: Long-term com-parison of macrobenthos within the soft bottoms of the Bay of Banyuls-sur-mer (Northwestern Mediterranean Sea), J. Sea Res., 40, 281–302, 1998.
Harte, J., Kinzig, A., and Green, J.: Self-Similarity in the Distribu-tion and Abundance of Species, Science, 284, 334–336, 1999. Harte, J., Blackburn, T., and Ostling, A.: Self-Similarity and the
Re-lationship between Abundance and Range Size, American Natu-ralist, 157, 374–386, 2001.
He, F. and Hu, X.-S.: Hubbell’s fundamental biodiversity parameter and the Simpson Diversity Index, Ecol. Lett., 5, 386–390, 2005. Hines, A. H., Haddon, P. S., Miklas, J. J., Weichert, L. A., and Haddon, A. M.: Estuarine invertebrates and fish: sampling de-sign and constraints for long-term measurements of population dynamics, in: New Approaches to Monitoring Aquatic Ecosys-tems, edited by: Boyle, T. P., American Society for Testing and Materials, Philadelphia, PA, 140–164, 1987.
Holland, A. F.: Long-term variation of macrobenthos in a mesoha-line region of Chesapeake Bay, Estuaries, 8, 93–113, 1985. Holland, A. F., Shaughnessy, A. T., and Hiegel, M. H.: Long-term
variation in mesohaline Chesapeake Bay macrobenthos: spatial and temporal patterns, Estuaries, 10, 227–245, 1987.
macroecol-52 B. Quiroz-Martinez et al.: Statistical analysis of polychaete population density
ogy and population genetics, Oikos, 113, 548–556, 2006. Hubbell, S. P.: The Unified Neutral Theory of Biodiversity and
Bio-geography. Princeton University Press, Princeton, NJ, 2001. Inchausti, P. and Halley, J.: Investigating long-term ecological
vari-ability using the global population dynamics database, Science, 293, 655–657, 2001.
Katz, R. W., Brush, G. S., and Parlange, M. B.: Statistics of Ex-tremes: Modeling ecological disturbances, Ecology, 86, 1124– 1134, 2005.
Keitt, T. H. and Stanley, H. E.: Dynamics of North American breed-ing bird populations, Nature, 393, 257–260, 1998.
Kimura, M.: Population Genetics, Molecular Evolution, and Neu-tral Theory: selected papers, The University of Chicago Press, Chicago, 1994.
Labra, F. A., Abades, S. R., and Marquet, P. A.: Scaling patterns in exotic species: Distribution and abundance, in: Species In-vasions: Insights into Ecology, Evolution, and Biogeography, edited by: Sax, D. F., Stachowicz, J. J., and Gaines, S. D., Sin-auer Associates, Inc., Sunderland, MA, 480 pp., 2005.
Magurran, A. E.: Measuring Biological Diversity, Wiley-Blackwell, New York, 256 pp., 2004.
Mahoney, B. M. S. and Livingston, R. J.: Seasonal fluctuations of benthic macrofauna in the apalachicola estuary, Florida, USA: The role of predation, Mar. Biol., 69, 207–213, 1982.
Marquet, P. A.: Of Predators, Prey, and Power Laws, Science, 295, 2229–2230, 2002.
Marquet, P. A., Abades, S. R., and Labra, F. A.: Biodiversity power-laws, in: Scaling Biodiversity, edited by: Storch, D., Marquet, P. A., and Brown, J. H., Cambridge University Press, Cambridge, 470 pp., 2007.
Mutlu, E., C¸ inar, M. E., and Ergev, M. B.: Distribution of soft-bottom polychaetes of the Levantine coast of Turkey, eastern Mediterranean Sea, J. Mar. Syst., 79, 23–35, 2010.
Nichols, F. H.: Abundance fluctuations among benthic invertebrates in two Pacific estuaries, Estuaries, 8, 136–144, 1985.
Olsgard, F., Brattegard, T., and Holthe, T.: Polychaetes as surro-gates for marine biodiversity: lower taxonomic resolution and indicator groups, Biodiv. Conservation, 12, 1033–1049, 2003. Pascual, M. and Guichard, F.: Criticality and disturbance in spatial
ecological systems, Trends Ecol. Evolut., 20, 88–95, 2005. Peterson, C. H.: Stability of Species and of Community for the
Ben-thos of two Lagoons, Ecology, 56, 958–965, 1975.
Pimm, S. L. and Redfearn, A.: The variability of population densi-ties, Nature, 334, 613–614, 1988.
Posey, M. H.: Changes in a benthic community associated with dense beds of a burrowing deposit feeder, Callianassa cali-forniensis, Mar. Ecol. Prog. Ser., 31, 15–22, 1986.
Reynolds, J. D. and Freckleton, R. P.: Population Dynamics: Grow-ing to Extremes, Science, 309, 567–568, 2005.
Schmitt, F. G., Molinero, J. C., and Brizard, S. Z.: Nonlinear dy-namics and intermittency in a long-term copepod time series, Comm. Nonlin. Sci. Num. Sim., 13, 407–415, 2008.
Vilenkin, B.: Ecological reading of random numbers, Ecol. Modell., 195, 385–392, 2006.
Wand, M. R. and Jones, M. C.: Kernel Smoothing, 1st Edn., Chap-man and Hall/CRC, New York, 1995.
![Sur la théorie des excursions pour des processus de Lévy symétriques stables d'indice α ϵ ]1,2] et quelques applications](data:image/gif;base64,R0lGODlhAQABAIAAAP///wAAACH5BAEAAAAALAAAAAABAAEAAAICRAEAOw==)