HAL Id: hal-03031456
https://hal.uca.fr/hal-03031456
Submitted on 10 Dec 2020
HAL is a multi-disciplinary open access
archive for the deposit and dissemination of
sci-entific research documents, whether they are
pub-lished or not. The documents may come from
teaching and research institutions in France or
abroad, or from public or private research centers.
L’archive ouverte pluridisciplinaire HAL, est
destinée au dépôt et à la diffusion de documents
scientifiques de niveau recherche, publiés ou non,
émanant des établissements d’enseignement et de
recherche français ou étrangers, des laboratoires
publics ou privés.
Distributed under a Creative Commons Attribution - NonCommercial - NoDerivatives| 4.0
International License
Experimental study of caldera formation
Olivier Roche, T Druitt, O Merle
To cite this version:
Olivier Roche, T Druitt, O Merle. Experimental study of caldera formation. Journal of Geophysical
Research, American Geophysical Union, 2000, 105 (B1), pp.395-416. �hal-03031456�
JOURNAL OF GEOPHYSICAL RESEARCH, VOL. 105, NO. B1, PAGES 395-416, JANUARY 10, 2000
Experimental study of caldera formation
O. Roche, T. H. Druitt, and O. Merle
Laboratoire "Magmas et Volcans" (UMR 6524 and CNRS), Universitd Blaise Pascal, Clermont-Ferrand, France
Abstract. Scaled experiments
have been carried out on caldera collapse
mechanisms,
using
silicone as analogue
magma and dry sand as analogue
rock. Experiments
were carried out in two
and three dimensions
using a range of roof aspect
ratios (thickness/width
0.2 to 4.5) appropriate
for
caldera collapse. They reveal a g•neral mechanism of collapse, only weakly dependent on theshape
of the reservoir.
For low roof aspect
ratios (_<1),
subsidence
starts
by flexure of the roof and
the formation of outward dipping, reverse
ring faults, which in turn trigger formation of peripheral
inward dipping, normal ring faults. The subsidence
always
occurs
asymmetrically.
In cross
section
the reverse
faults delimit a coherent
piston, bounded
on each side by an annular
zone of inwardly
tilted strata located between the reverse
and normal ring fault sets. The surface
depression
consists
of a nondeformed
area (piston) surrounded
by an annular
extensional
zone (tilted strata).
For high
aspect
ratios (> 1), multiple reverse
faults break up the roof into large pieces,
and subsidence
occurred as a series of nested wedges (2-D) or cones (3-D). The extensional zone dominates thesurface
depression.
In the case where preexisting
regional faults do not play a major role, the
collapse
mechanics
of calderas
probably
depends
strongly
on the roof aspect
ratio. Calderas
with
low roof aspect
ratios are predicted
to collapse
as coherent
pistons
along reverse
faults. The
annular extensional
zone might be the source
of the large landslides
that generate
intracaldera
megabreccias.
Collapse into magma
reservoirs
with high roof aspect
ratios may be the origin of
some funnel calderas where explosive reaming is not dominant.1. Introduction
Calderas form in a range of terrestrial tectonic settings during
large ignimbrite eruptions and by the collapse of shield volcanoes. They also occur on other planets [Wood, 1984].
Caldera diameters range from -2 km to many tens of kilometers.
Volumes of erupted products range from a few cubic kilometers
to >5000 km
'• [Williams,
1941; Smith,
1979; Lipman,
1984,
1997].
The subsurface structures and collapse mechanisms of calderas
are controversial [Williams, 1941; Reynolds, 1956; Smith and
Bailey, 1968; Yokoyama, 1981; Walker, 1984; McBirney, 1990;
Scandone, 1990; Branney, 1995; Lipmarz, 1984, 1997]. The subject is of interest for a number of reasons. Many young calderas are located in densely inhabited areas /Newhall and Dgurisin, 1988]. Post eruptive hydrothermal activity generates economically important ore deposits along caldera faults /Lipman, 1984; Elston, 1994; Rytt•ba, 1994] and provides a
source of geothermal power [Heiket? and Goff, 1983; Goff and
Gardner, 1988]. The mechanisms of caldera collapse have
implications for the dynamics of ignimbrite eruptions [Druitt and
Sparks, 1984].
Current models of caldera collapse are based on a combination of field studies, theoretical models, geophysical data, and
analogue experimentation. Analogue models are useful because
they reproduce aspects of the natural phenomenon on a laboratory scale [Komuro et al., 1984; Komuro, 1987; Mart/et
a!., 1994]. We carried out a series of scaled experiments to
Copyright 2000 by the American Geophysical Union.
Paper number 1999JB900298.
0148-0227/00/1999J B900298509.00
investigate the mechanics of caldera collapse. In the experiments
it is the weight of the reservoir roof that drives subsidence, as in
real calderas. Our discussion focuses in particular on calderas
formed
by ignimbrite
eruptions
[Smith, 1979]. We compare
the
experimental results with field observations of both young and eroded calderas, and also with structures produced by mining subsidence. Mining subsidence models provide important insights into caldera collapse, but there are major differences in scale. The ratio of subsidence to roof thickness is 10 to 100 timesgreater in calderas than in mines. Moreover, the difference in
scale implies that stresses involved during caldera formation are much greater than in mines. For these reasons, our analogue experiments are scaled to take into account the large dimensions of calderas. The experiments show that many of the caldera collapse geometries proposed in the literature can potentially be explained by a single mechanism. They also have implications for the formation of some funnel calderas and for the dynamics of large ignimbrite eruptions. We begin by reviewing the different models of caldera collapse proposed in the literature.
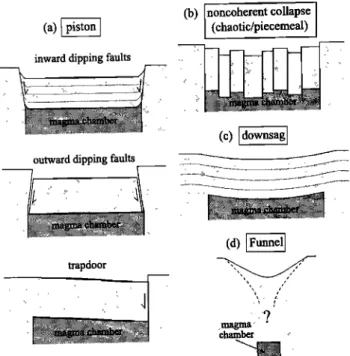
2. Models of Caldera Collapse
Three end-member mechanisms of caldera collapse have been
proposed in the literature: piston collapse, noncoherent (chaotic
or piecemeal) collapse, and downsag. A fourth type, funnel
calderas, is based on caldera morphology, and the exact collapse
mechanism is controversial (Figure 1). Individual calderas can in some cases exhibit components of two or more collapse mechanisms.
2.1. Piston Collapse
In the piston collapse model, an essentially coherent block subsides along one or more well-defined ring faults (Figure l a)
396 ROCHE ET AL.: EXPERIMENTAL STUDY OF CALDERA FORMATION
(a)
•piston
i
inward dipping faults
outward dipping faults
trapdoor
(b) [noncoherent
collapse
[(chaotic/piecemeal)
½) downagl
'ch
Figure 1. Summary of end-member mechanisms of caldera- collapse proposed in the literature. (a) piston models, (b) noncoherent collapse model, (c) downsag model, and (d) funnel
model.
[Clough et al., 1909; Williams, 1941; Reynolds, 1956; Smith and Bailey, 1968; Oftedahl, 1978; Lipman, 1984, 1997]. The ring faults are observed directly in eroded calderas [e.g., Oftedahl,
1978, Lipman, 1984]. In young calderas their existence is
inferred from alignments of vents along curved arcs [Williams,
1941; Smith and Bailey, 1968; Bacon, 1983; Hildreth and
Mahood, 1986,' Lipman, 1984]. The piston is otlen plate-like in
geometry and more or less cylindrical. In some cases there are
multiple ring/hults, such as at Clut caldera [Hildebrand, 1984],
Grizzly Peak [Fridrich et al., 1991], Washburn,
Pueblo,
Long
Ridge [Rytuba and McKee, 1984], and La Primavera [Mahood,
1980].
The diameters of calderas interpreted as piston structures
range from <10 km, such as Crater Lake [Bacon, 1983], Kulshan
[Hildreth, 1996], Ischizuki [Yoshida, 1984], lschia [Tibaldi and Vezzoli, 1998], and Vepe [Nappi eta!., 1991], to considerably more than 10 kin, such as Lake City and Silverton [Lipman,
1976], Grizzly Peak [Fridrich at al., 1991], Valles [Smith and
Bailey, 1968], Questa [Lipman, 1983], Creede [Steven and Lipman, 1976], Long Valley [Hildreth and Mahood, 1986],
Organ [Seaget and McCurry, 1988], and Hechiceros [Ritter and
Cepeda, 1991]. The amount of subsidence is usually estimated t¾om the thickness of intracaldera tuff and ranges up to 3 km [Smith, 1979; Spera and Crisp, 1981; Lipma•, 1984] or, rarely, up to 5 km [John, 1995, Oftedahl, 1978; Seaget and McCurry,
1988].
Three different end-member collapse geometries have been proposed for piston calderas: inward dipping ring faults, vertical
or outward dipping ring lhults, and trapdoor. The existence of
inward dipping ring faults has been invoked widely in the literature [Kingsley, 1931; Reynolds, 1956; Smith and Bailey,
1968; Vincent, 1970; Lipman, 1984], but there is an obvious
space problem for the subsiding block. Such faults are, in fact,
rarely observed in the field, and in most cases the ring fault dips
are very steep or vertical, such as at Lake City [Lipman, 1976], Summitville [Lipman, 1975], Grizzly Peak [Fridrich et al., 1991], and Tavua [Setterfield et al., 1991]. More often, the
inward dip is deduced from updrag of strata at the block margins
(see Figure la)[Kingsley, 1931; Reynolds, 1956; Vincent, 1963, 1970; Oftedahl, 1978; Yoshida, 1984; Simkin and Howard, 1970]. In some cases, complex structures are invoked to accommodate the space problem [Hildebrand, 1984]. It is
commonly implied that precollapse tumescence creates inward
dipping faults that are then reactivated during subsidence [Smith
and Bailey, 1968; Vincent, 1970; Komuro eta!., 1984; Komuro, 1987; Gudmundsson, 1988; Gudmundsson et al., 1997]. However, it is geometrically impossible tbr relaxation of
tumescence along inward dipping faults to result in 3 km or more
of subsidence. In fact, evidence for precursory tumescence is
elusive at most calderas [Lipman, 1984].
Vertical to outward dipping ring faults and ring dikes have been described from the deeper levels of some eroded calderas,
such as Ischizuki (70 ø to 80 ø ) [Yoshida, 1984], Baerum
[Oftedahl, 1978], calderas of the Stillwater range [John, 1995], and the Scottish Hebrides [Richey, 1932]. In this case, there is no space problem for the subsiding block. Seismic data at Rabaul
show the existence of a shallow-level ring fault with an outward
dip of 45 ø to 80 ø [Mori and McKee, 1987; Jones and Stewart, 1997]. On a smaller scale the pit craters of Masaya volcano
subsided along faults with outward dips of 70 ø to 80 ø [Rymer et
al., 1998]. Anderson [1936] showed that underpressuring of a
magma chamber would lead to subsidence along outward dipping
faults.
Magma
injection
along
the faults
would
generate
ring
dikes.
Some piston calderas subside in an asymmetric, or trapdoor,
manner, as commonly deduced from thickness variations of the intracaldera tuff. Examples include Silverton [Steven and Lipman, 1976], Bonanza [Varga and Smith, 1984], Mule Creek [Elston, 1984], Organ [Seaget and McCurry, 1988], Grizzly Peak [Fridrich et al., 1991 ], Tarso-Voon [Vincent, 1963], Fernandina [Simkin and Howard, 1970], and Snowdon [Howells et al.,
1986]. At Snowdon the point of maximum subsidence is located
near the main eruptive vent, as recognized by a concentration of
co-ignimbrite lag breccias. 2.2. Noncoherent Collapse
In some calderas the piston does not remain intact during
subsidence (Figure lb). This is called noncoherent, piecemeal, or
chaotic collapse. During subsidence of the Scafell caldera the
floor broke up into multiple 0.1 to 2 km blocks separated by large
faults [Branney and Kokelaar, 1994]. A reinterpretation of the
multicyclic Glen Coe caldera indicates that collapse probably occurred in a similar manner [Moore and Kokelaar, 1997, 1998].
The random distribution of postcollapse vents in some calderas
such
as Campi
Flegrei
and Hakone
[Walker, 1984] may record
breakup
of the subsided
block. The existence
of regional
fault
networks may favor noncoherent collapse at many calderas. In all likelihood, there exists a spectrum of calderas from those in which there is minor breakup of the piston during subsidence tothose
in which collapse
is strongly
noncoherent.
In practice,
it
may be hard to distinguish syncollapse faulting from thatgenerated during postcollapse resurgence, as at Valles [Heiken et
a!., 1990] and Campi Flegrei [Orsi et al., 1996].
The concept of chaotic collapse was used by Scandone [1990]
to explain
the negative
gravity
anomalies
associated
with many
ROCHE ET AL.' EXPERIMENTAL STUDY OF CALDERA FORMATION 397
ignimbrite calderas. Scandone supported his hypothesis by reference to collapse in nuclear explosion cavities. However, there is a scale difference of 2-3 orders of magnitude between
nuclear cavities and large calderas [Yokoyama and De la Cruz-
Reyna, 1991], so the analogy is not valid. It has been proposed that some funnel calderas form by chaotic collapse [Kuno et al.,
1971; A ramaki, 1984; Kamata, 1989].
2.3. Downsag
In the downsag conceptual model a significant component of
the subsidence occurs by flexure (Figure l c). This was proposed
for Taupo caldera by Walker [1984] and the Bolsena calderas by
Walker [ 1984] and Nappi et al. [1991 ]. However, in these, and most other examples, the evidence for pure downsag is lacking. At most calderas, field data suggest that downsag acts together
with faulting to accommodate the subsidence. This is the case for
calderas such as those of the Ossipe Mountains [Kingsley, 1931],
Ischizuki [Yoshida, 1984], Tavua /Setterfield at al., 1991 ], Fernandina/Sirekin and Howard, 1970], and for the pit craters of
Masaya volcano [Ryme• ctal., 1998]. Downsag is revealed by the
existence of surface extensional and compressional features. This
is the case at Olympus Mons where, a transition exists between
an extensional zone (arcuate grabens) near the caldera margin and
a compressional zone (ridges) near the center [Mouginis-Mark
and Robinson, 1992•,. Arcuate grabens have also been observed
at Black Bear [Hihtebrand, 1984] and at the Galapagos calderas
[Geist et al., 1994]. At Glen Coe, extension caused by
downflexure generated surface crevasses hundreds of meters deep
at the caldera margins [Moore and Kokelaar, 1997].
(a) Subcritical extraction, roof aspect ratio h/w>0.7
6 •4 = 0 .., •-2 -4 w=140m
(b) Critical extraction, roof aspect ratio h/w=0.7
'=-
ø
t
•-2 -4o.3
g•
0.2
o.
1 z:w=.
o .-• 2.4. Funnel CalderasYokoyama [1981, 1983] introduced the concept of funnel
calderas. This model differs from the others in that it is based on
caldera morphology, rather than on collapse mechanism (Figure
l d). Drill core data and U-shaped negative gravity anomalies suggest that some calderas consist of a flared, funnel-shaped depression filled with breccia. This interpretation has been
applied generally to small-diameter (<2-4 km) calderas but also,
more rarely, to larger calderas such as Aira [Yokoyama, 1961;
Aramaki, 1984], Aso /Oho et al., 1992], La Primavera
[Yokoyama and Mena, 1991 ], and Kuttyaro [ Yokoyama, 1983].
Comprehensive drilling at Hakone [Aramaki, 1992], Shishimuta
[Kamata, 1989, 1992], and Nigorikawa [Ando et al., 1992;
Aramaki, 1992; Kurozumi and Doi, 1994, 1995] has shown that
in each case the width of the breccia fill decreases downward.
The present experiments may have implications for the origins of
some funnel calderas, as discussed in section 9.3.
3. Previous Experimental Studies of Caldera
Formation
Ramberg [1981] carried out centrifuge experiments using
putty (the magma chamber) placed under a roof of clay.
Preexisting vertical fractures were generated artificially in the
clay, and these guided the subsiding block without creation of
other faults. Komuro et al. [1984] used a rigid, upward moving
sphere in a volume of clay or in a mixture of sand and clay to
simulate the doming created by an ascending magma body in the
crust. This produced a depression at the center of the dome that
might represent a caldera. Komuro [1987] used an evaporating
sphere of dry ice buried in sand and clay and showed that
(c) Supercritical extraction, roof aspect ratio h/w<0.7
0.3
0.2
o.• o w=560m / // // \ //Figure 2. National Coal Board [1975] model Ibr subsidence,
horizontal displacement, and strain at the surface caused by a
rectangular cavity 2 m high and 200 m deep. (a) Subcritical case,
(b) critical case, and (c) supercritical case. The angle of draw 0 is
35 ø . Maximum horizontal displacement toward the center corresponds to the transition between extensional and
compressional strain. The maximal extension occurs above the
cavity margins. Modified from Whinaker and Reddish [ 1989].
collapse occurred as a coherent, subsiding block delimited by
outward dipping faults. Mart/et al. [1994] used an air balloon
immersed in a volume of alumina powder. In their experiments the balloon was inflated to simulate pre-collapse tumescence and/or deflated to simulate syneruptive collapse. Reverse, inward
dipping faults generated during tumescence seemed to reactivate
398 ROCHE ET AL.' EXPERIMENTAL STUDY OF CALDERA FORMATION
alone, collapse took place as a block delimited by vertical faults and cut internally by a complex pattern of curved faults. A limitation of these experiments is that during subsidence a balloon conserves its upward convex shape and imposes
deformation on the roof, not the contrary as in a caldera.
4. Principles of Subsidence Mechanics
The basic principles of subsidence mechanics are well known
from mining subsidence studies [Vidal, 1961; Given, 1973;
National Coal Board, 1975; Whittaker and Reddish, 1989; Hoek
et al., 1995]. Subsidence in mines is small compared to the
thickness of the mine roof. For example, typical subsidences are
less than a few meters, whereas the roof thickness is several
hundreds of meters (Figure 2). The ratio of subsidence to roof
thickness
is about
10
-2 in mines
and 10 to 100 times
greater
in
many calderas.
The National Coal Board [1975] published an empirical
model widely used for subsidence prediction [Whittaker and
Reddish, 1989]. For two-dimensional subsidence, two lines
drawn from the edges of the cavity delimit the collapse
depression at surface (Figure 2). The angle 0 between these lines
and the vertical is calleo the angle of draw and is equal to -35 ø . Subsidence at the surface is accompanied by horizontal
displacements at the surface toward the center of the depression.
At the center of the system, there is no horizontal displacement.
Horizontal displacements cause formation of both extensional
and compressional zones at the surface (Figure 2). The points of
maximum extension are located above the edges of the cavity.
The transition between the zones of surface extension and
compression corresponds to the maximum gradient of subsidence.
The National Coal Board [1975] model distinguishes three cases
depending on the roof aspect ratio (R=thickness/width): subcritical, critical, and supercritical. The critical aspect ratio (Figure 2b) is given by
tan0 = (w/2)/h = I/(2R), (1)
where w and h are the width and thickness of the roof,
respectively. For 0=35 ø we obtain a critical aspect ratio of R=0.7.
For R>0.7 (subcritical case, Figure 2a), there is a single point of
maximum compression located at the center of the depression.
For R=0.7 (critical case, Figure 2b), there are two points of
maximum compression and a single point of no deformation at
the centre. For R<0.7 (supercritical case, Figure 2c), there are two
points of maximum compression and an undeformed zone of
finite width in between. The model shows that the widths of the
marginal deformed zones (extensional plus compressional) are
constant for a given 0 and h, and do not depend on w. This implies that for a low R, there is a central undeformed zone
bounded by marginal deformed zones, whereas for a high R the
entire depression is affected by surface deformation. The concept
of critical aspect ratio is important in our experiments.
5. Experimental Methods
The experiments used dry sand as an analogue for rock and
silicone as analogue magma (Table 1). The use of sand to mimic
the brittle behavior of rock has been widespread since Hubbert's
[1937, 1951] studies. Dry sand has a Mohr-Coulomb behavior
and is cohesionless. The sand used in the experiments has a bulk
density
of 1500
kg m
-3 and
a grain
size
of 60 to 300 gm, with
a
mean diameter of 200 gm. The angle of internal t¾iction q) (33.5 +
0.8) was estimated from 64 measurements of the angle of repose.
Dying the sand does not change its physical properties. Silicone
putty
is a Newtonian
fluid with a viscosity
of 2.4 x l0 4 Pa s, as
measured
using
a rotating
viscometer.
Its density
is 1150
kg m
-3.
Gradients in rock properties (e.g., due to temperature variations)
and magma viscosity (e.g., due to compositional zoning) were
neglected in the experiments.
The experiments were carried out in both two and three dimensions (Figure 3). In each case a layer of silicone
(hereinafter referred to as the silicone reservoir) represented the
magma chamber. This was underlain by a large volume of
silicone connected to an outflow tube, which was blocked during
the preparation phase of each experiment. The silicone reservoir
was created using a mould of appropriate shape, then was buried
and overlain by layered, colored sand that simulated the chamber roof. Each experiment was initiated by unblocking the outflow
tube, allowing silicone to flow out of the reservoir, pushed by the
subsiding roof. The 2-D apparatus (60 x 10 x 30 cm, Figure 3a)
was used to understand the basic mechanisms of subsidence. The
3-D apparatus (60 x 60 x 30 cm, Figure 3b) was then used to
verify the mechanisms observed in two dimensions and to study
details of fault propagation and surface deformation in three dimensions.
Silicone reservoirs in the 2-D experiments were rectangular in
cross section with vertical sides and fiat rootS. Many granite plutons are believed to have approximately fiat roofs [Pitcher, 1978' Lipman, 1984; Takahashi, 1986' Lipman et al., 1993' Fiske and Tobbish, 1994' John, 1995]. In the 3-D experiments we first used cylindrical reservoirs with fiat roofs; we
subsequently investigated collapse into reservoirs of more
complex geometry. The range of investigated roof aspect ratios (R
= 0.2 to 4.5) corresponds to that likely in calderas.
After each experiment the model was covered with sand to
preserve the depression and other surface structures. The model
was then saturated with water and serially sectioned. In some
cases, dilute soap solution was used to reduce the surface tension
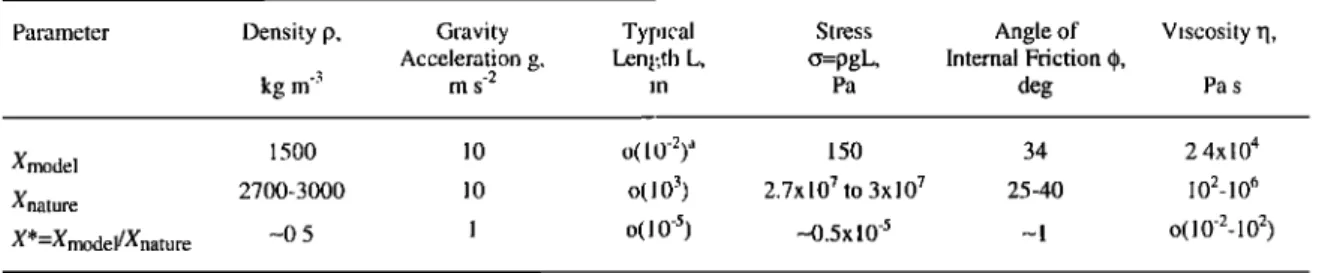
Table 1. Values of the Physical Parameters in Experiments and Calderas in Nature
Parameter Density p, Gravity Typical Stress
Acceleration g, Length L, o=pgL,
kg m
-3
m s
-2
•n
Pa
Angle of Internal Friction deg Viscosity q, Pa s Xmodel XnatureX* =Xmode l/ Xna ture
1500 10 o(10-2) a 150 2700-3000 10 o(103) 2.7xi07 to 3x10⁷ -0.5 1 o( 10 -5) -0.5 x 10 -5 34 25-40 -1 2.4xi04 102_106 O( l 0 -2-10 2) a The o( 10 -2) means order of 0.01.
ROCHE ET AL.' EXPERIMENTAL STUDY OF CALDERA FORMATION 399
(a)
longitudinal cut transverse cut
60 cm colored chamber sand - roof silicone magma ..- reservoir = chamber -- - I [•'"'"'"" '•:'"':••••••:...-...--. .•.•••] sliding v ' "--' -•'•'•""••':ø••:•::•'"• plate 20 cm 10cm
•
= .•
plexiglass
[-"""--'--"•
tube
(b)
60 cm 9 cm tubeFigure 3. Experimental apparatus used in this study. Colored
sand mimics the chamber roof. The thin layer of silicone
represents the magma chamber. This is referred to as the silicone
reservoir in the text. During an experiment the silicone leaves the
reservoir via an open tube, driven by the weight of the overlying
sand. (a) Two-dimensional apparatus and (b) 3-D apparatus
coefficient of internal friction (about 0.67). When h -- 0, Ov-- pgh, but as h increases, {37 tends to a maximum value of pgot (Figure
4). Departures of the vertical stress t¾om lithostatic were less
important in the 3-D apparatus than in the 2-D one, in which the
maximum deviation was -40%. However, the similarity of subsidence geometries in two and three dimensions suggest that
the resulting effects were of only secondary importance.
6. Scaling Considerations
Correct scaling requires geometric and dynamic similarity between the model and nature [Hubbert, 1937, 1951; Sanford, 1959; Ramberg, 1981]. For each key physical parameter we define a ratio X* (Table 1):
X*- Xmodel
- •. (3)X nature
L* is the length ratio, p* is the density ratio, g* is the
gravitational acceleration ratio, and o* is the stress ratio. Calderas have diameters up to several tens of kilometers,
subsidences up to 5 km, and magma chamber depths up to-10 k•n [Smith, 1979; Spera and Crisp, 1981; Lipman, 1984, 1997; Newha/l and Daurisin, 1988]. We chose a range of L* from
0.5x10
-s to 2x10
-5,
so that
1 cm
in the
experiments
corresponded
to 0.5 to 2 km in nature.
The density
ratio
p* in the experiments
was -0.5. The experiments were carried out in the Earth's gravityfield, so g*=l. For the scaling of stress parameters,
o*=p*g*L*. (4)
For a Coulomb material like rock or sand, 'r = % + {3,, tan qb, where
{3, is normal stress, 'c is shear stress, % is cohesion, and qb is the
angle of internal friction. The angle of internal friction of dry sand (-34 ø) is in the range (250-40 ø) of most rocks [Handin, 1966; Hoek et al., 1995]. To fulfil the scaling condition, with {3*
Vertical stress
(Pa)
0 500 1000 1500 2000 2500
of water and facilitate penetration into the sand. The experiments
are listed in Table 2.
In all the experiments the level of silicone in the open tube
was kept above that of the silicone in the apparatus but below that
of the top of the sand. It was thus the difference in density
between the roof and the silicone that drove the subsidence. Test
runs showed that only when the level in the tube lay below that of
the apparatus did the silicone flow under its own weight, sucking
the sand down with it. Our chosen experimental conditions
avoided this effect. Tests were also carried out to confirm the
reproducibility of the experiments.
Edge effects in the experiments were unavoidable due to the
finite size of the apparatus. This is because vertical stresses
({3,,) are in part supported by horizontal stresses ({3/,)against the
container walls, where {3/, = K{3• and K is a constant equal to 0.58
in sand [Duran, 1997]. In a container full of sand
o
v - pgot(1
-e-h/ø•),
(2)
where p is the bulk density of the sand, g is the gravitational
acceleration, and h is depth. The constant o• depends on the
dimensions of the experimental apparatus: o•=A/(PKg), where A
and P are the area and perimeter of the apparatus and g is the
,,
2
Glithostatic
Gvertical,
3-D
4
Gvertical,
2-D
\ \ \Figure 4. Vertical pressure gradients in sand in the 2-D and 3-D
400 ROCHE ET AL.' EXPERIMENTAL STUDY OF CALDERA FORMATION
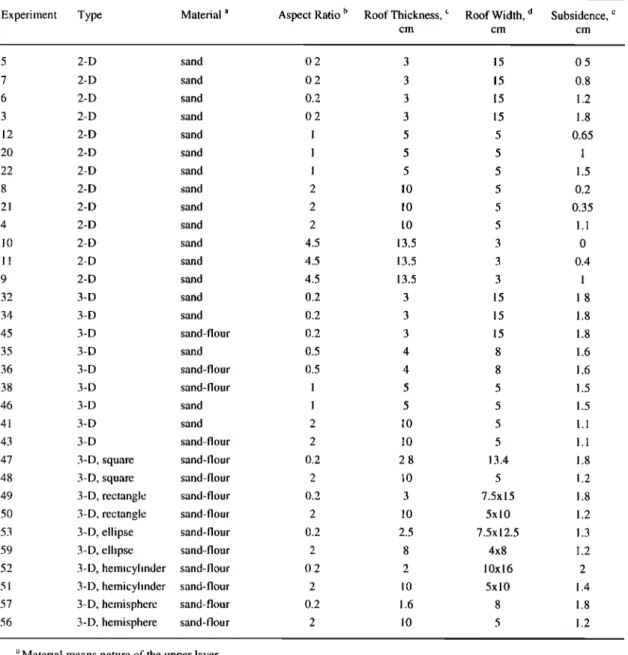
Table 2. List of Experiments Carried Out in This Study
Experiment Type Material • Aspect Ratio •' Roof Thickness, c Roof Width, • Subsidence,
cm cm cm 5 2-D sand 0.2 3 15 0.5 7 2-D sand 0.2 3 15 0.8 6 2-D sand 0.2 3 15 1.2 3 2-D sand 0.2 3 15 1.8 12 2-D sand 1 5 5 0.65 20 2-D sand I 5 5 1 22 2-D sand I 5 5 1.5 8 2-D sand 2 10 5 0.2 21 2-D sand 2 10 5 0.35 4 2-D sand 2 10 5 1.1 10 2-D sand 4.5 13.5 3 0 11 2-D sand 4.5 13.5 3 0.4 9 2-D sand 4.5 13.5 3 1 32 3-D sand 0.2 3 15 1.8 34 3-D sand 0.2 3 15 1.8 45 3-D sand-flour 0.2 3 15 1.8 35 3-D sand 0.5 4 8 1.6 36 3-D sand-flour 0.5 4 8 1.6 38 3-D sand-flour I 5 5 1.5 46 3-D sand 1 5 5 1.5 4 ! 3-D sand 2 10 5 1.1 43 3-D sand-flour 2 10 5 1.1 47 3-D, square sand-flour 0.2 2.8 13.4 1.8 48 3-D, square sand-flour 2 10 5 1.2 49 3-D, rectangle sand-flour 0.2 3 7.5x15 1.8 50 3-D, rectangle sand-flour 2 10 5x I 0 1.2 53 3-D, ellipse sand-flour 0.2 2.5 7.5xl 2.5 1.3 59 3-D, ellipse sand-flour 2 8 4x8 1.2 52 3-D, he•nicylinder sand-flour 0.2 2 10x16 2 51 3-D, hemicylinder sand-flour 2 10 5x10 1.4 57 3-D, he•nisphere sand-flour 0.2 1.6 8 1.8 56 3-D, hemisphere sand-flour 2 10 5 1.2
Material means nature of the upper layer.
Aspect Ratio is thickness versus width of the roof.
For rounded silicone layer the roof thickness is taken as the thinnest one above the silicone reservoir. For rounded silicone layer the roof width is the maximum width of the silicone reservoir.
Subsidence means •naximum co!lapse at surface.
= q:()*, we lnave TO,mode I ---- T0 :½ T(),natt, c. Cohesion values for rock
measured
on small
laboratory
samples
are of tlne
order
of 10
? Pa
[Handin, 1966, Hoek et at., 1995]. On a larger scale, joints and faults can lower cohesion by at least one order of magnitude [Schultz., 1996]. Thus the macroscopic cohesion is likely to be oftlne
order
of 106
Pa. WitIn
•:o*
of the order
of 0.5x10
-5 (Table
1)
we need an analogue material witln a cohesion of a few pascals. The use of cohesionless dry sand was tlnerefore a good
approximation.
Magma
viscosities
in nature
range
from 10'-
Pa s for basalt
to
about
106
Pa s for hydrous
rhyolite
[Shaw,
1972].
Perfect
scaling
in our experiments required an analogue fluid much less viscous
than silicone. Use of silicone increased the duration of
subsidence but did not clnange the fault geometries created, since
the deformation of Coulomb materials is rate-independent. The
higln viscosity of the silicone and granular nature of sand
prolnibited intrusion of tlne silicone and the formation of "ring
dikes" in tlne experiments.
7. Experimental Results
7.1. Two-Dimensional Reservoir
In these experiments the silicone reservoir was rectangular
with a Ilar roof and vertical sides. For each roof aspect ratio (0.2,
1, 2, and 4.5) we carried out three or four separate experiments
arrested (by blocking the outflow tube) after different amounts of
subsidence. By studying the internal structure of each experiment
we were able to reconstruct a temporal sequence of fault
ROCHE ET AL.' EXPERIMENTAL STUDY OF CALDERA FORMATION 401
(a)
(b)
(c)
(d)
0 5 cm first reverse fault
•
propagating
upward
•.-..•i::-.•.•;:.½.>.:.-;•,
• f•-;?•:•
•
5:.:::x:
>.:••...•••.•
•..••
..:
:•.:•..:-.
...
•,-..
'.v•
•?.•....,•
•:...•
• •
•
..•:...:•
:•;....•:•.:•::•
½
:::•
•:.::•:.:•.:•:•.::.::•...•.•::•
•
•
•:•
•...
•'zz:??:
;:
:':'•:':';:':::s•:•:::•"•:'"::"•:
normal fault ß normal fault
I second reverse fault I propagating upward
• propagating
upward I
large
fault
throw
I
small
fault
throw
• sn•all
fault
throw
•1• large
fault
throw
•
[• "•"" '"" `.``.`..•-.•`.`•.•.`..••.```````.•••`.`,,.••••••:•{i•...•!•iiii!•i::ii•{!i•:.•iiiiiiiii•....i•i•.•:.• '•"-•"•"•'••:::••••••.•;il '""'"' • -
tilted block - tilted block
t--' ,
I
....
6•
Subsidence = 1.8 cm
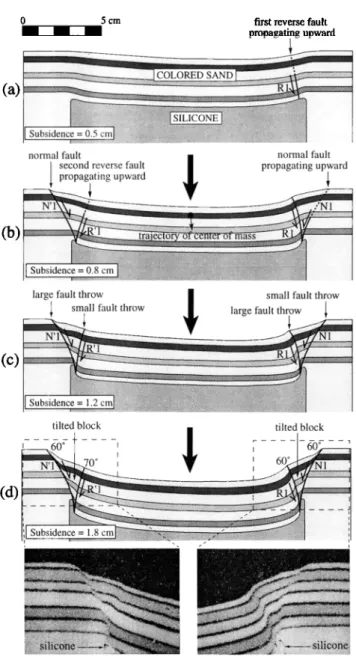
Figure 5. Two-dimensional
experiments.
Roof aspect
ratio of
0.2. (a) Experiment 5, (b) experiment 7, (c) experiment 6, and (d)experiment
3. The experiments
represent
a temporal
evolution
of
the system,
arrested
at diflbrent
stages.
R, reverse
fault; N, normal
fault.
8). This was possible because our experiments were reproducible.
Subsidence was commonly asymmetric, so in the accompanying
diagrams we have for convenience inverted some images so that
the asymmetry is always seen in the same sense. Reverse and normal faults are labeled R and N, respectively.
Subsidence in all cases started with downflexure, without the
formation of discrete faults. This was most marked at low roof
aspect ratios (Figure 5). Further collapse then occurred along a combination of outward dipping reverse and inward dipping
normal faults, each of which nucleated at the top of the silicone
reservoir and propagated upward (Figures 5 to 8). The faults were
subvertical at depth with dips o! 55 ø to 70 ø (reverse faults) and
60 ø to 65 ø (normal faults) at the sudhce.
At an aspect ratio of 0.2 (Figure 5), nucleation of a first reverse fault (R l) on one side of the reservoir was lbllowed by nucleation of a normal fhult (N' 1) on the other side. Early
subsidence was controlled by these two faults, and the collapse
vector was i•clined toward R I. Downthrow along R1 and N'I
then triggered fUrmarion of faults R' I and NI in a similar manner,
and the collapse became more symmetrical. The same took place
at an aspect ratio of 1, except that both reverse faults nucleated
0 5 cm
second reverse fault
propagating
upward
first
reverse
fault
Surface • ...
subsidence
= 0.75
cm ;;;;;;;?%.
??;.•....•::.•:.:.::•;:;:•:.•.•?•i•;;•;•i;;•;•:.;;:;•;•:•;;:•.•?•.•.;•;:•:•:•;::%•?
,',
?.': i::!iiiii.':::::.:::½:::.-..:.::. ... •.:..•.• ... • ... •:.•::...:•i:! -:.:.:...-.-..,-,,?.•_ .. . -ISubsdence
?
O.acm
I
;:
Surface subsidence = I cm(b)
R, 1
R1IS
ubsidence = 1.1 cn
4
...: i small deformed•!t tilted
block
lar•,e
tilted
block
•'
_5
o
I coherent
central
I
o
I"' ••03-] •; block
5•'•' I 60•.____•
Surface o o= 1.5
I 5sø
subsidence
(c)',
"
... iISubsidence
= .6 c
i ... *.•<•4•,:•.•.•., :•,:,,• :..---..:•,:•½,.. >- ... :.-....-•, •,½ .... • ß .. .... . .. ... ..:. . -. .. -- . . ---.:... i ß,.
...
...
ß
- '..'. -.-. . ß . ß '*. ".'-'-•:-:::s:::*:-•.½::•;•:•>:::•S•:2:5:•½•::::½::':'::-::'::>:½ ... •" :½•' . ... - - • '. ... ".. ' ß . .' ....Figure 6. Two-dimensional experiments. Roof aspect ratio of 1. (a) Experiment 12, (b) experiment 20, and (c) experiment 22. The experiments represent a temporal evolution of the system, arrested at different stages. The uppermost layer of black sand in the photograph was placed on the model after the experiment to
402 ROCHE ET AL.: EXPERIMENTAL STUDY OF CALDERA FORMATION
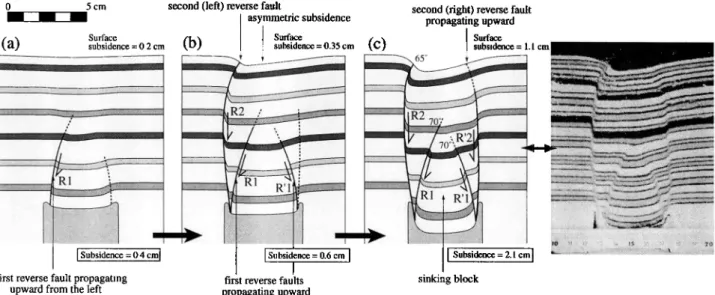
0 5 cm
a)
Surface
subsidence = 0.2 crnsecond (left) reverse fault
asymmetric subsidence
(b)
I Surface
subsidence = 0.35 cm] [
Subsidence
=
0.4
cm
I Subsidence
=
0.6
cm
first reverse fault propagating first reverse faults
upward from the left propagating upward
second (right) reverse fault propagating upward
I Surface
(C)
subsidence
= 1.1
cm
• 65 ø •-•--- ...I
'• I'1. •..•
..-•
I , , .>.• ...,• I•I Subsidence
= 2.1
cm
I
sinking blockFigure 7. Two-dimensional experiments. Roof aspect ratio of 2. (a) Experiment 8, (b) experiment 21, and (c)
experiment 4. The experiments represent a temporal exolution of the system, arrested at different stages. The
uppermost layer of black sand in the photographs was placed on the model after the experiment to protect the
collapse depression. R, reverse fault; N, normal fault.
before the normal ones. In both cases, the reverse and normal
faults bounded blocks of strata tilted at 10 ø to 20 ø toward the
depression (Figures 5 and 6). The reverse faults migrated progressively into these tilted blocks as subsidence occurred (Figure 9). A notable feature of the final structures is the presence of marginal updrag of sand layers along reverse as well as normal
faults.
At higher aspect ratios (2 and 4.5) collapse occurred along
multiple
reverse
faults,
which broke the roof up into a series
of
wedges (Figures 7 and 8). In these cases, a first pair of faults (RIand R'I) nucleated at the top of the reservoir and propagated
upward. This triggered formation of a second pair higher up (R2
and R'2), then (for an aspect ratio of 4.5) a third pair (R3 and
R'3). Peripheral normal faults were not generated at these aspect
ratios. Additional experiments showed that they do eventually form in such systems but only at very large, and geologically
unrealistic, subsidences (more than 5 km when scaled).
Despite the use of a very simple geometry for the silicone layer and a roof of constant thickness, only minor departures from symmetry in the initial setup always led to asymmetric
0 5 cm fault R3 nucleates when
•/ R2 becomes reverse
Surface
Surface
I
subsidence = 0 cm subsidence = 0.4 cm - ____ ß ß ß ß I Subsidence = 0.7 ... cmsubsidence
starts
first
sinking
•1•
on the right side block
fault R'3 nucleates when
R'2 becomes reverse
Surface ]
.•:..i:-•i....-
I
subsidence = l cm [ ... .:::. ... . ... . ,.•.::.:.-.-.:::.-.,;..:: ... ZL;;..::;-::,-".-•R 3 \
...
•-•..:•;:•:.:•;a-:.•:•a•
...
•
"• ... "••• ... ... ••--•• t•:--:':•:'::-'-':•-'c.'.?..*.;•' "•'•'"'•-.z:'...•--.'-'•:::? ... '"'70
o. 70
•
...
...
'
...
':
......
...
: .... -..' '•'-i:i.t-"•½-. •-i•i•i• :•:•:•:•:: • ......
•;'--!' •--':-•'"' ... - ... ..:&....-: - :.•. ... •:•:-..':.• ... :.--.-;--: ... '..'"' ' ... •':::ii:.:ia• '"""'"-""::•? ..L...-::-.-*:-....: ... .... ' '-' ' ... ....-.:..-.:.: ' . . •' "•'"'"'"':•'"":"•:•:'"':/•••'•-'.••-:i:•:' ' -- -' •"':'•'"'••:- ... ... '•iE:---:::::::::::::::::::::::::::::::::::::::::::::::::::::::::::
•"•'•:....•.•.:•.:...•,.:.,...•,
... ,....•.
•.., •..:,
•.
Subsidence = 3.5 cm iii-:•: ... '" ,Ji ,,- 'i.%'-:v"-" •
... *-'•C•:•:.- :.- ... ..-•.-:.,!-..;.•a-::: --...-..: - ...
second sinking
block
Figure 8. Two-dimensional experiments. Roof aspect ratio of 4.5. (a) Experiment 10, (b) experiment 11. and (c)
experiment 9. The experiments represent a temporal evolution of the system, arrested at differe•lt stages. The
uppermost layer of black sand in the photographs was placed on the model after the experiment to protect the
ROCHE ET AL.: EXPERIMENTAL STUDY OF CALDERA FORMATION 403
normal fault
reverselfault
tilted
bloc•
subsiding
block
_•
lted
block
slides
on
migration
of
deformation
•
into
the
tilted
block
..._]--•
.:.123
::i•i•ii•i•i•:•ii•iiiiiiiiiili;•i•i!111111!ili:•11":"•i}:ii::•i•..:.!
"::i:::'•i•::•::•':
Figure
9. Low aspect
ratio,
2-D experiment.
Migration
of
reverse
fault
into the adjacent
tilted
block
during
subsidence.
collapse. Tests showed that subsidence always started where the
roof was thickest, even subtly so. At the lowest aspect ratio (0.2),
subsidence at depth was equal to that at the surface (Figure 5d),
whereas at the highest ratio (4.5) the former was >3 times greater.
In all experiments, the width of the final surface depression was
greater than that of the silicone reservoir. For a given subsidence
this effect increased with increasing roof aspect ratio.
7.2. Three-Dimensional Reservoir (Cylinder With Flat Roof)
These experiments were carried out to verify the basic
mechanisms described above and to study fault propagation and
surface deformation in three dimensions. The silicone reservoir
was cylindrical with a flat top. Roof aspect ratios of 0.2, 0.5, 1,
and 2 were investigated. Following subsidence, the sand was
serially sectioned (up to 30 sections, each 0.5 to 1 cm thick) to
study internal structures. Timed photographs of the surface
during the experiment permitted us to follow each surface fault as
it propagated around the deepening depression. The final
structures are summarized in Figure 10.
As in two dimensions, the collapse style depended on roof
aspect ratio. At low aspect ratios (0.2 and 0.5), subsidence began
by flexure, then continued as a coherent piston along reverse and normal ring faults (Figures 11 and 12). An annular ring of strata between the reverse and normal faults was rotated down and into the deepening depression (equivalent to the tilted blocks in two dimensions). In detail, a first reverse fault R I appeared on one side of the depression and a normal fault N'I on the other,
producing initial asymmetric collapse. Each fault then propagated
round the depression through 180 ø. With increasing subsidence a
second reverse fault R'I appeared and propagated round to meet
R I. At the same time, a second normal fault N I nucleated and
propagated round to N'I. In some cases the faults merged totally,
forming a complete ring fault (reverse or normal), and in others
they crossed at a shallow angle.
At higher aspect ratios, multiple ring faults sliced the subsiding block into a series of cones (Figures 13 and 14). The faults were subvertical at depth and either reverse or normal near
the surface. They formed progressively from the bottom to the
top, such that in Figure 14, R I is the oldest and R4 is the
youngest. Unlike at lower aspect ratios, each ring fault appeared
to nucleate
on just one side of the reservoir
and propagate
all the
way round.
Collapse in all cases was asymmetric,
with maximum
subsidence on the side of the first reverse lhult. The dips of
reverse faults at the surface ranged from 45 ø to 85 ø . In most
experiments
the dip of each reverse
fault became
steeper
as it
propagated
around
the reservoir.
An example
is shown
in Figure
10a, where R1 has a dip of 50 ø where it first nucleated, but 80-85" at its lateral extensions. The normal ring thults had almost
constant
dips
(50 ø to 65 ø) at the surface
but steepened
downward.
Small secondary
normal faults developed
between
the main
reverse and normal fault sets at the lowest aspect ratio (Figure
•).
In some cases a 5-mm-thick layer of sand-flour mixture (cohesion 6 to 8 Pa) was spread unitbrmly across the surface of
the sand prior to the experiment.
This made it possible
to
generate
open fractures
and to visualize
zones of surface
extension
and compression,
which
is otherwise
not possible
with
pure
sand.
The presence
of this layer
did not influence
internal
structure
or reproducibility
in the experiments.
It did, however,
permit
the formation
of small
vertical
cliffs (3 to 4 mm), which
scale to several hundreds of meters in nature. These experiments
showed that at low aspect ratios the annular ring of tilted strata
between the reverse and normal ring faults appears at the surface
as an annular zone of extension encircling the non-deformed
piston (Figures
11, 12, and 13). The extensional
zone also
developed
at higher
aspect
ratios.
In each case
the extensional
zone
migrated
outward
with time as subsidence
proceeded,
small
blocks
breaking
away
and sliding
into the depression
(Figures
13
and 14). An important
feature
is that the width
of the extensional
zone is almost
independent
of roof aspect
ratio (Figure
15). Thus
at low aspect
ratio the extensional
zone
is narrow
compared
with
the entire width of the surface depression, whereas at high aspectratios it dominates.
7.3. Three-Dimensional Reservoir (Various Shapes)
We carried out additional 3-D experiments to study the
influence of reservoir shape on subsidence geometry. Silicone reservoirs were constructed with either flat roofs (three different shapes in plan view: square, rectangular, and elliptical; Figures
404 ROCHE ET AL.: EXPERIMENTAL STUDY OF CALDERA FORMATION
(c)
0 5 cm :90: -,. , 85; ! .i. !Figure 10. Diagrams
summarising
the structures
of the 3-D experiments.
Aspect
ratios
of (a) 0.2, (b) 1, (c) 0.5,
and
(d) 2. Reverse
faults
are marked
R and
normal
faults
N. Fault
dips
and
lines
of cross
sections
(AB' Figures
11
to 14) are indicated.
and half spheres, Figure 18). The aspect ratio of a rounded roof
was defined using the minimum thickness. For each reservoir
shape we investigated just two end-member roof aspect ratios
(0.2 and 2).
Departure I¾om a simple flat-roofed, cylindrical reservoir
shape does not strongly influence the subsidence mechanism.
However, the experiments revealed some interesting variations of
fault geometry and propagation that lnight be relevant in nature.
Sharp corners (square, rectangle, half cylinder) acted to arrest
propagating faults. Square and rectangular cases showed similar
behavior. Foi' a low roof aspect ratio a first reverse fault (numbered I on each of the figures) nucleated in the middle of
one side and propagated sideways in each direction (Figures 16a
and 16c). It was then arrested by the corners, and subsidence
proceeded in a trapdoor fashion along one side of the reservoir.
Subsequently, a second reverse fault (numbered 2) formed on the
opposite side of the reservoir. The same was then repeated on the
two other sides. The associated normal faults showed similar
behavior.
The first reverse faults always nucleated along the long sides of an elongated reservoir (rectangle, ellipse, or half cylinder),
irrespective of roof aspect ratio. For the elliptical reservoir a first
reverse fault nucleated on one long side (numbered 1) followed
by a second one on the opposite side. The two faults then
propagated around and joined. Collapse into a reservoir with the
shape of a half-cylinder produced a strongly asymmetric
depression with a single large reverse fault parallel to the cylinder
axis (Figure 18a). A notable feature of this experiment was that
the dip of the sand layers increased progressively toward the
depression axis.
Collapse commonly generated complicated accommodation structures in the marginal tilted blocks. In the square and
rectangular cases the tilted block on the side of fault I was cut by
multiple outward dipping normal faults (Figures 16a and 16c).
For the half cylinder the tilted block was cut by multiple small
normal faults, forming a graben. At low aspect ratios the surface
depression had the same shape as the underlying reservoir,
ROCHE ET AL.: EXPERIMENTAL STUDY OF CALDERA FORMATION 405
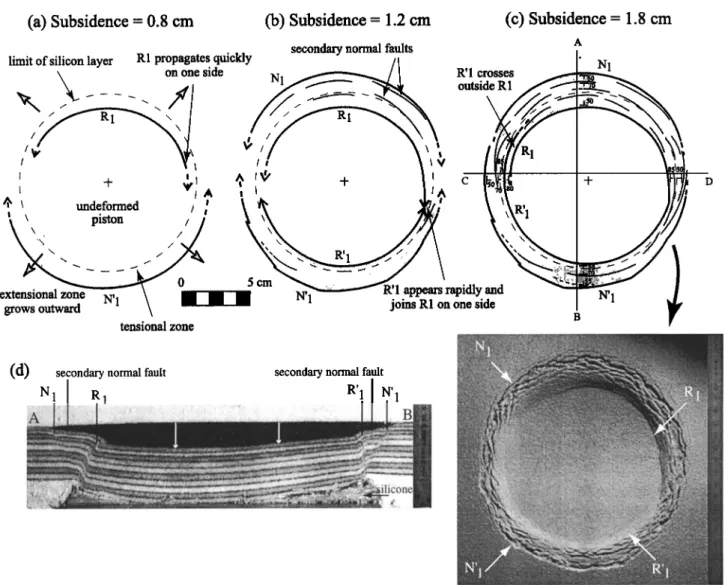
tensional zone
(a) Subsidence
= 0.8 cm
(b) Subsidence
= 1.2 cm
(c) Subsidence
= 1.8 cm
secondary
normal
faults
A
limit
of
silicon
layer R1
propagates
quickly
//
,
N1
N
on
one
side
N-
'
/ /
R 1 crosses
•x
x piston
//; 5•x•
' x
extensional
zo••
•
•
R'I
a e•sra
PP
P Y
idl
•d •
'• :'"'•
N' 1
•ows ou•d
'
jo•s
R1
on
one
side
B
(d)
secondary
normal
fault
secondary
normal
fault
...
.
...
..:
...
:..
Figure 11. Three dimensional
experiments.
Roof aspect
ratio of 0.2. (a-c) Temporal
evolution
of surface
deformation in experiment 45. R, reverse fault; N, normal fault. The limit of the silicone layer at depth is shown. The extensional zone at the surface is shown shaded. The photograph shows the final structure at the surface: anextensional
ring is delimited
by reverse
faults
inside
and normal
faults
outside.
The external
limit of the depression
is a scarp a few millimeters high that corresponds to the intersection of the normal ring faults with the surface. (d)Cross
section
AB. The uppermost
layer
of black sand
was placed
on the model
after the experiment
to protect
the
collapse depression.
8. Stress Fields in the Experiments
Stress fields present in the experiments can be reconstructed
qualitatively from the orientations and throws of observed faults
(Figure 19). Numerical simulations of the experiments are being
carried out to better constrain these patterns and will be reported
elsewhere. In this paper we assume that the maximum shear stress
'•max is vertical above the margins of the reservoir (Figure 20).
According to theory [Jaeger and Cook, 1971; Price and
Cosgrove, 1990], the angle between 'lJma x and the principal normal
stress o• is 45 ø. Furthermore, the angle ot between Ol and the fault created is ot=45ø-•/2, where • is the angle of internal
friction. In our case, qb=34 ø, so we obtain ot=28 ø. This predicts
that the first faults created should dip outward at 73 ø and agrees well with the dips (-70 ø) of reverse faults generated in the experiments
Given [1973] discusses the mechanism of subsidence above a
rectangular mining cavity. The cavity induces a redistribution of
the stress field above it. This produces an arch around which the
lines ot principal stress Ol are deflected (Figure 21). Here o•
beneath the arch is less than lithostatic (zone A, Figure 21).
Outside the arch there is a zone in which o• exceeds lithostatic
(zone B, Figure 21). The outer boundary of zone B is called the
limit of influence.
A deflected
(vault-shaped)
stress
field serves
to
generate
a maximum
shear stress
'rmax
near the cavity margins
[e.g., Bamberge•; 1997]. There is a competition between the vault effect, which tends to stabilize the edifice, and the shearstress, which disrupts it. Disruption of the cavity roof starts by
formation of extensional fractures that coalesce and evolve into
shear faults as they propagate upwards. These faults are reverse
![Figure 2. National Coal Board [1975] model Ibr subsidence, horizontal displacement, and strain at the surface caused by a rectangular cavity 2 m high and 200 m deep](https://thumb-eu.123doks.com/thumbv2/123doknet/13621527.425620/4.867.438.792.98.593/figure-national-board-subsidence-horizontal-displacement-surface-rectangular.webp)