HAL Id: hal-02413303
https://hal.archives-ouvertes.fr/hal-02413303
Submitted on 16 Dec 2019
HAL is a multi-disciplinary open access
archive for the deposit and dissemination of sci-entific research documents, whether they are pub-lished or not. The documents may come from teaching and research institutions in France or abroad, or from public or private research centers.
L’archive ouverte pluridisciplinaire HAL, est destinée au dépôt et à la diffusion de documents scientifiques de niveau recherche, publiés ou non, émanant des établissements d’enseignement et de recherche français ou étrangers, des laboratoires publics ou privés.
Tilting a Ground State Reactivity Landscape by
Vibrational Strong Coupling
Anoop Thomas, Thibault Chervy, Lucas Lethuillier-Karl, Kalaivanan
Nagarajan, Robrecht Vergauwe, Jino George, Atef Shalabney, Éloïse Devaux,
Cyriaque Genet, Joseph Moran, et al.
To cite this version:
Anoop Thomas, Thibault Chervy, Lucas Lethuillier-Karl, Kalaivanan Nagarajan, Robrecht Vergauwe, et al.. Tilting a Ground State Reactivity Landscape by Vibrational Strong Coupling. Science, Amer-ican Association for the Advancement of Science, 2019, 363 (6427), pp.615-619. �10.26434/chem-rxiv.7160789.v1�. �hal-02413303�
doi.org/10.26434/chemrxiv.7160789.v1
Tilting a Ground State Reactivity Landscape by Vibrational Strong
Coupling
Anoop Thomas, Lucas Lethuillier-Karl, Kalaivanan Nagarajan, Robrecht M. A. Vergauwe, Jino George, Thibault Chervy, Atef Shalabney, Eloïse Devaux, Cyriaque Genet, Joseph Moran, Thomas W. Ebbesen
Submitted date: 03/10/2018 • Posted date: 04/10/2018 Licence: CC BY-NC-ND 4.0
Citation information: Thomas, Anoop; Lethuillier-Karl, Lucas; Nagarajan, Kalaivanan; M. A. Vergauwe, Robrecht; George, Jino; Chervy, Thibault; et al. (2018): Tilting a Ground State Reactivity Landscape by Vibrational Strong Coupling. ChemRxiv. Preprint.
Site-selectivity is fundamental for steering chemical reactivity towards a given product and various efficient chemical methods have been developed for this purpose. Here we explore a very different approach by using vibrational strong coupling (VSC) between a reactant and the vacuum field of a microfluidic optical cavity. For this purpose, the reactivity of a compound bearing two possible silyl bond cleavage sites, at Si-C and Si-O, was studied as a function of VSC of its various vibrational modes in the dark. The results show that VSC can indeed tilt the reactivity landscape to favor one product over the other. Thermodynamic parameters reveal the presence of a large activation barrier and significant changes to the activation entropy, confirming the
modified chemical landscape under strong coupling. This study shows for the first time that VSC can impart site-selectivity for chemical reactions without the need for chemical intervention.
File list
(2)
download file view on ChemRxiv
Site Selectivity MS ChemRxiv.pdf (1.49 MiB)
download file view on ChemRxiv
1
Tilting a Ground State Reactivity Landscape by Vibrational Strong Coupling
A. Thomas1#, L. Lethuillier-Karl1#, K. Nagarajan1, R. M. A. Vergauwe1, J. George1‡, T.
Chervy1†, A. Shalabney2, E. Devaux1, C. Genet1, J. Moran1*, T. W. Ebbesen1* 1University of Strasbourg, CNRS, ISIS & icFRC,
5
8 allée G. Monge, 67000 Strasbourg, France.
2Braude College, Snunit Street 51, Karmiel 2161002, Israel
*Correspondence to: [email protected]; [email protected] #These authors contributed equally
10
Present Address:
‡Department of Chemistry. Indian Institute of Science Education and research Mohali, Mohali,
India.
†Department of Physics, ETH Zurich, Switzerland
Abstract:
15
Site-selectivity is fundamental for steering chemical reactivity towards a given product and various efficient chemical methods have been developed for this purpose. Here we explore a very different approach by using vibrational strong coupling (VSC) between a reactant and the vacuum field of a microfluidic optical cavity. For this purpose, the reactivity of a compound bearing two possible silyl bond cleavage sites, at Si-C and Si-O, was studied as a function of 20
VSC of its various vibrational modes in the dark. The results show that VSC can indeed tilt the reactivity landscape to favor one product over the other. Thermodynamic parameters reveal the presence of a large activation barrier and significant changes to the activation entropy, confirming the modified chemical landscape under strong coupling. This study shows for the first time that VSC can impart site-selectivity for chemical reactions without the need for 25
chemical intervention.
Over the years, synthetic chemists have mastered the art of designing and developing bond-, site- and stereo-selective chemical reactions using various functional moieties and catalysts (1–4). In light of the decisive nature of molecular vibrations in dictating the outcome of isomerization and other chemical processes (5–7), a physical approach based on the selective excitation of 30
vibrational modes using strong laser fields was also developed to impart control on chemical reactivity (8–11). This laser-induced mode-selective chemistry provided a way to move the system along the reaction coordinate, particularly for late barrier reactions (12–14). Interestingly, the vibrational excitation of the C-H bond of an early barrier reaction inhibited the formation of the typical product and modified the branching ratio (15), even though such an excitation was 35
predicted to have little influence on the outcome (16). An adiabatic transfer of excitation to the product stretching mode was also observed when the localized spectator mode of the reactant was pumped in the former experiments, further indicating the complexities of the reactive landscape (15,17). Although such mode-selective chemistry works well in the gas phase at cryogenic temperatures, intramolecular vibrational energy redistribution (IVR) limits its use for 40
2
reactions in solution involving large molecules. To overcome such challenges, we started exploring an alternative approach whereby the vibrational transition of a molecule is selectively hybridized with the vacuum electromagnetic field (zero-point energy) of a cavity by means of vibrational strong coupling (VSC) (18–21). VSC leads to splitting of the vibrational transition into two new vibropolaritonic states (P+ and P- in Fig. 1A) that should affect the Morse 5
potential. We predicted that this could lead to changes in the chemical reactivity and indeed in a first example, we demonstrated that the rate of silyl cleavage is reduced by the VSC of the Si-C stretching vibration (22). Most significantly, the reaction mechanism was also modified.
Changing the ground state reactivity landscape under such a weak field perturbation suggests that VSC could also be used for site-selectivity of a reaction. Here in a proof-of-10
principle study, we demonstrate that it is indeed possible to tilt the chemical landscape of a reactant to favor one product over another.
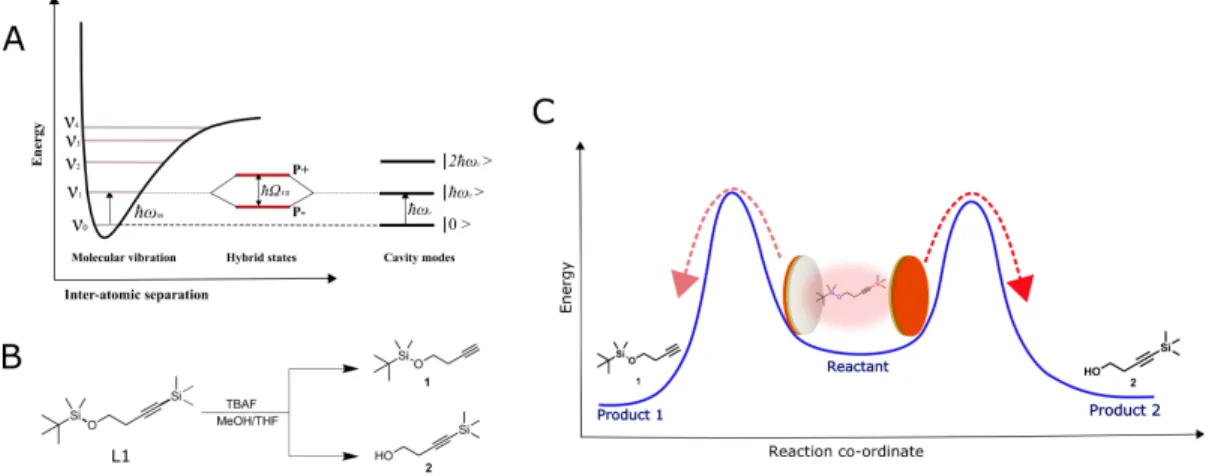
Fig. 1. (A) Schematic illustration of the light-matter strong coupling of a vibrational transition in
resonance with Fabry-Pérot cavity mode and the subsequent formation of hybrid polaritonic 15
states P+ and P- separated by Rabi splitting energy, ħΩR. (B) The scheme showing the two major
silyl cleavage pathways for the starting material L1, when reacted with TBAF in a mixture of methanol and THF. The structure of the C- (1) and O-deprotected product (2) are also given. (C) Schematic representation of a site selective reactive pathway upon the VSC of the reactant. To explore the above possibilities, the silane derivative, tert-butyldimethyl((4-20
(trimethylsilyl)but-3-yn-1-yl)oxy)silane called L1 hereafter, (structure given in Fig.1B), having two parallel silyl bond cleavage sites was synthesized (Supplementary Material for details). The nucleophilic attack of tetra-n-butylammonium fluoride (TBAF) on the Si atoms of L1 can result in the cleavage of the Si-C bond, yielding product 1, or the breakage of the Si-O bond, resulting in product 2 (Fig.1B). Since both the products are formed through similar mechanistic pathways, 25
first we explored whether the selective strong coupling of vibrational modes associated to Si-C and Si-O have similar or different influences on the reactivity. The second and most important point of the present study was to check whether changes in the reactivity landscape under VSC lead to site-selectivity and thereby in changes to the branching ratio of the products as schematically presented in Fig.1B and C.
3
It is recalled that light-matter hybridization is generally achieved by placing a molecule in liquid or solid form in a Fabry-Pérot optical cavity with a mode tuned in resonance with the chosen molecular transition (23). When the exchange of energy between the molecular transition and cavity mode is faster than any decay process, the system is said to be in a strong coupling regime manifested by the splitting of the molecular transition into two new states separated by a 5
Rabi splitting energy, ħΩR, as shown schematically in Fig. 1A with VSC as a specific example.
Under collective strong coupling conditions, the Rabi splitting can be so large that it results in significant modification of characteristic molecular and material properties beyond chemical reactivity such as work function (24), phase transition (25) and other physical processes including electrical conductivity (26), energy transfer (27–29) and reverse intersystem crossing 10
(30).
The Fabry-Pérot cavity used in the present experiments was made of two parallel metal mirrors (Au coated ZnSe) separated from each other by a Mylar spacer (6-8 um) having a hollow central channel designed to inject liquid samples (19). To ensure that the reaction dynamics are not affected by the presence of Au or ZnSe, an additional layer of 200 nm glass (SiO2) was
15
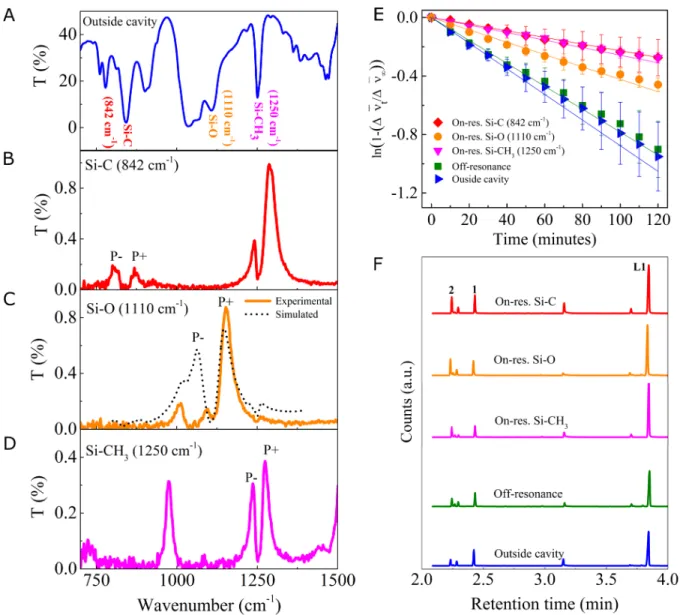
deposited on top of the metal coating in each of the windows. A homogenous solution of the starting material L1 (0.90 M) and TBAF (0.86 M) in a 1:1 (v/v) mixture of methanol and THF, optimized for strong coupling conditions, was used as the reacting medium throughout the experiments presented here. The IR spectrum of L1 (Fig. 2A) in this mixture recorded outside the cavity (a sample cell made of glass coated ZnSe windows separated by the same spacer 20
thickness as of the Fabry-Pérot cavity) shows the characteristic strong bands corresponding to the stretching mode of Si-C (842 cm-1) and Si-O (1110 cm-1) and the bending mode of CH3
4
Fig. 2. (A) FT-IR transmission spectrum of the starting material L1 in the reaction mixture
recorded outside the cavity. The characteristic peaks of L1 are noted in the plot. (B-D) The FT-IR transmission spectra showing the vibrational strong coupling with the formation of P+ and P- when the three different modes are coupled to the cavity: the C stretching mode in (B), the Si-5
O stretching in (C) together with a transfer matrix simulated transmission spectrum shown by black dotted line, and (D) Si-CH3 bending vibration. (E) Kinetics of the reactions in cavities
tuned to be on-resonance with the Si-C stretching (red diamonds), the Si-O stretching (orange circles) and the Si-CH3 bending modes (magenta triangles) together with an off-resonance cavity
(green squares) and outside the cavity (blue triangles), as extracted from the temporal shifts in 10
the higher-order cavity modes. (F) The GC-MS chromatograms of the reactions carried out in cavities tuned to be on-resonance with Si-C stretching (red), Si-O stretching (orange) and Si-CH3
bending modes (magenta), together with the data for an off-resonance cavity (green) and outside the cavity (blue). The unreacted starting material peak is marked as L1 and the peak corresponding to C- and O- deprotected products are marked as 1 and 2, respectively. The small 15
5
For VSC, it is important to tune the cavity mode to be in resonance with a specific IR transition of L1. This is achieved by carefully adjusting the spacer thickness by applying a pressure by tightening or loosening the screws holding the assembly (Supplementary Materials for details). The injection of the homogeneous reaction mixture into the flow cell Fabry-Pérot cavity, whose second mode (l) was precisely tuned to 842 cm-1, resulted in the strong coupling
5
of the Si-C stretching transition as shown in Fig. 2B. The appearance of P+ and P- peaks in the IR spectrum with a Rabi splitting energy of 70 cm-1, larger than the width of the cavity mode (30
cm-1) and the Si-C vibrational band (30 cm-1), showed that the system meets the strong coupling
criteria (23). Under these conditions, a largely detuned coupling was also observed for the bending mode of -CH3 groups bonded to Si (Si-CH3, 1250 cm-1) to the third mode of the cavity.
10
The role of strongly coupled Si-CH3 bending vibration towards the reactivity was analyzed
separately and is described later. In a different experiment, by tuning the third mode of the cavity to 1110 cm-1, VSC of Si-O stretching band was achieved (Fig. 2C solid line). The
presence of the intense and broad vibrational modes of solvents (1040-1060 cm-1), splits and
reduces the P- band intensity (Fig. 2C) and complicates the spectrum analysis. Therefore the 15
Rabi splitting energy in this case was calculated using the standard optics technique (transfer matrix simulation) and shown in Fig. 2C as a dotted line. The extracted value of 85 cm-1 is well
above the cavity and IR mode widths.
The rate of silyl cleavage of L1 under the influence of VSC as well as the product ratio between 1 and 2 was quantitatively estimated using spectroscopic and chromatographic methods 20
respectively. The sum rate of the two parallel reactions, carried out at room temperature (298 K), was determined from the ln plot of the temporal shift of a higher order cavity mode (from`n0
to`nt; see Supplementary Materials for details). Similar to the earlier experiment (22), this was
aided by the slight change in the refractive indices of the reactant and the products of the reaction. The linear ln plot (Fig. 2E) indicated that the kinetics is first order and from the slope 25
the rate constant corresponding to the disappearance of starting material was determined. Interestingly, when the Si-C stretching bond vibration was strongly coupled, the rate was retarded (Fig. 2E, red diamond) by a factor of 3.5 compared to the control measurements done outside the cavity (Fig. 2E, blue triangle) or inside the cavity under off-resonance conditions (Fig. 2E, green square). Off-resonant experiments correspond to the set of measurements done in 30
the Fabry-Pérot cavity, where the modes are not in resonance with any of the selected vibrational transitions of L1.
To better understand the reactivity and product formation, the reaction mixture was quantitatively analyzed by GC-MS after each experiment (see Supplementary Materials for details). The presence of the unreacted starting material peak (denoted as L1 in Fig. 2F) in the 35
chromatogram of all the experiments shows that the reaction has not gone to completion in the 3 h time period. The ratio between the concentration ([1]/[2]) of the products 1 and 2 of Fig. 1B was further quantified as shown in Fig. 2F. For outside cavity and off-resonance experiments, the ratio ([1]/[2]) between the C- (1) and O- (2) deprotected products was found to be 1.5±0.2 and 1.4±0.1 respectively. A remarkable increase in the peak area of product 2 was seen when the Si-40
C stretching vibration was strongly coupled (red chromatogram, Fig. 2F), changing the branching ratio [1]/[2] to 0.3±0.1. This value takes into account the fraction of the Fabry-Perot microfluidic cavity under strong coupling. This reversal of product ratio under VSC indicates that the reactive landscape is modified in favor of Si-O cleavage rather than the typical
6
kinetically favored Si-C bond breaking. A similar trend was observed when the Si-O stretching vibration was also subjected to light-matter hybridization. In this case where the overall rate of the reaction was slowed by a factor of 2.5 relative to the outside cavity/off resonant conditions (orange circle, Fig. 2E), the product ratio was estimated as 0.4±0.1. Thus, the VSC of the two stretching vibrations of the Si reactive center both tilt the reaction towards Si-O bond cleavage, 5
clearly imparting selectivity.
As discussed in the introduction, previous examples on the mode-selective chemistry experiments have shown that spectator modes, vibrations that are not directly linked to the reaction coordinate, also play a critical role in determining the outcome of reactions (14, 15, 31). In the present case, the strong IR band at 1250 cm-1, arising from the bending mode of the -CH
3
10
groups attached to the Si atom (32) may also be considered a spectator vibration. However, the appearance of this IR transition at 1250 cm-1, which in isolation should be at ca. 1460 cm-1,
already indicates that it is interacting with other vibrations associated with the Si center. By varying the spacer thickness, VSC of this bending mode alone (Fig. 2D) was achieved with a Rabi splitting energy of 43 cm-1, without simultaneously coupling either the Si-C or Si-O
15
stretching vibrations. The VSC of the 1250 cm-1 reduced the overall reaction rate by a factor of
3.5 (Fig. 2E, magenta triangle) with a ratio [1]/[2] of 0.3±0.1 between the products (Fig. 2F, magenta chromatogram), in a close similarity to the results obtained under the VSC of the Si-C stretching transition. A question which then naturally arises is whether the VSC of any vibrational mode of L1 would lead to similar results or whether the effects are only related to 20
those vibrations that are associated with the Si reactive center. To check this, the C-O stretching transition (at 1045 cm-1) of L1, a vibration that should have little influence on the reaction from a
mechanistic point of view, was chosen. Moreover, this mode is embedded in the broad region corresponding to the C-O vibration (1040-1060 cm-1, see Fig. 2A) of the solvents used (methanol
and THF). Therefore, the VSC of the C-O transition should also provide information on whether 25
coupling a solvent vibration influences the outcome of this chemical reaction. Interestingly, the rate as well as the ratio of the product concentration was not affected by the VSC of the C-O transition (Fig. S6). It shows that in the present experiment only those vibrations that are directly associated with the Si reaction center are influential in tilting the reaction landscape as one might expect. Although VSC of the C-O vibration of methanol did not influence the present study, 30
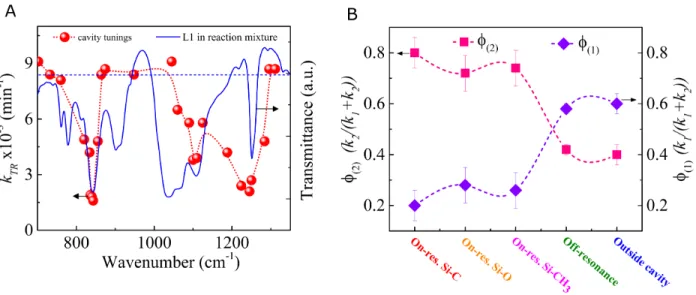
VSC of solvent could potentially lead to significant changes for reactions in which solvent plays a more crucial role. Further, through a series of experiments where the cavity tunings were varied throughout the IR spectrum of L1, an action spectrum was obtained (Fig. 3A) which clearly shows through which vibrational modes VSC act to influence the reaction. This plot of the overall rate constant (kTR) as a function of cavity tuning reflects the precise selectivity that
35
can be achieved by this weak field physical perturbation tool at room temperature.
Furthermore, by combining the observed overall rate constant (kTR) of the parallel
reaction and the product ratios ([1]/[2]) from GC-MS measurements, the individual rate constants corresponding to the Si-C (k1)and Si-O (k2) bond cleavage were estimated. From this
data, the respective product yields were calculated. The yields (f) of products 1 and 2 in and out 40
of strong coupling for various coupling conditions are shown in Fig. 3B. Outside the cavity and in off-resonance conditions, the k1 dominates over k2 resulting in preferential formation of
product 1 (Fig. 3B, violet diamond). Interestingly, the VSC reverses the selectivity, leading to an excess formation of product 2 (Fig. 3B, pink squares). This is again a direct proof-of-principle that the chemical landscape can be tilted by targeting the vibrational modes associated with the 45
7
reaction center. It should be noted that the value of both k1 and k2 under strong coupling
conditions are both lower than those observed outside the cavity indicating that a higher activation energy is required for the reaction under VSC. It should be noted that products 1 and 2 undergo further silyl bond cleavage, however the subsequent reactions appear to be much slower resulting in the accumulation of 1 and 2 in the GC-MS analysis. Nevertheless, it imparts a small 5
error in the yields but has no consequence on the overall results. As will be discussed further down, the change in yields under VSC are probably much higher if one takes into account physical parameters associated with the coupling process.
10
Fig. 3. (A) The overall reaction rate as a function of the cavity tuning for reactions inside the
cavity (red spheres). The blue solid line shows the IR absorption spectrum of L1 in the reaction medium. The red dotted line connecting the spheres is a guide for the eye. The blue dashed line represents the average rate of the reaction outside the cavity. (B) Plot showing the yield of the product 1 (f1, violet diamonds) and 2 (f2, pink squares) under VSC of various vibrational modes
15
of L1, together with the off-resonance and outside cavity conditions. The dashed lines are guides for the eye.
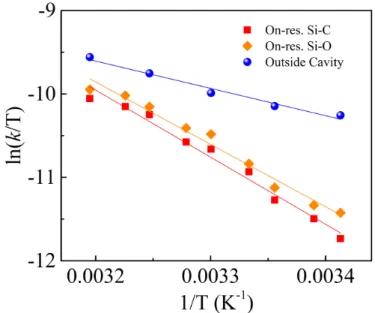
The thermodynamics of the reaction were determined by studying the reaction rate as a function of temperature under VSC by coupling of the Si-C and Si-O stretching vibrations and outside the cavity. By using transition state theory, the free energy of activation (DH‡) and the
20
entropy of activation (DS‡) were determined from the slope and intercept of the plot of ln (kTR)
against the inverse of temperature. Interestingly, the DH‡ values under VSC, 66.8 ±3 kJmol-1 (for
Si-C) and 62.1 ±3 kJmol-1 (for Si-O) were much higher than that observed for outside cavity
(27.2 ±3 kJmol-1) experiments. This high activation energy requirement reflects the observed
retardation of the bond breaking process for the selected reaction under VSC. The DS‡ values
25
were also distinctly different under VSC, -66.5 ± 11 Jmol-1K-1 for Si-C and -80.6 ±11 Jmol-1K-1
for Si-O while outside the cavity it is found to be -190.4±8 Jmol-1K-1. Since a typical fluoride
induced silyl cleavage is known to proceed through a pentacoordinate intermediate, a strained transition state with large negative value for DS‡ is expected as observed outside the cavity. A
8
sharp decrease of DS‡ to a lower value under VSC implies that the transition state under VSC is
significantly different. These changes in the DH‡ and the DS‡ are indeed an indication that
mechanism, and thereby the chemical landscape, changes under strong coupling conditions in agreement with our earlier study (22).
5
Fig. 4. Eyring plot showing the reaction rate as a function of temperature for reactions inside the
cavities tuned to be on-resonance with Si-C (red squares) and Si-O (orange diamonds) stretching modes and outside the cavity (blue spheres).
The above results show that VSC can modify the chemical landscape in such a way that it tilts the landscape from one product to another. An interesting aspect of chemical reactions under 10
VSC so far has been the high activation barrier seen towards the breaking of Si-C and Si-O bonds. A possible reason could be motional narrowing of the Morse curves in this collective coupling of many molecules to a given optical mode, akin to what occurs in J-aggregates (33), increasing the energy barrier. This barrier increase has also been seen in earlier experiments, whether occurring in the ground state (22) or via the excited state under electronic strong 15
coupling such as in the photoisomerization reaction of merocyanine (34). For the latter case, recent theoretical studies show that the collective response of molecules plays a role in widening the barrier at the conical intersection and thereby preventing the isomerization (35, 36). More experiments and theoretical studies are required to determine whether such features can be generalized or not. The high activation energy and the less negative DS‡ clearly indicates that the
20
reaction follows a dissociative mechanism under VSC, and also suggest that the transition state is product-like as in the case of late barrier reactions. Factors such as changes to the electrophilicity of the Si atom could be a reason for the enhanced rupture of the Si-O bond under VSC.
In conclusion, this proof-of-principle study is a first step towards controlling reaction selectivity at a given site through VSC. It is already clear that it requires that the VSC is applied to 25
vibrational transitions directly linked to the reaction center, in this case the Si atom. It should be noted that strong coupling is dependent on the orientation of the transition dipole moment
9
relative to the electric field of the cavity mode. Here the molecules were randomly oriented and the electric field is not uniform in the cavity, i.e. there are nodes where the field is essentially null. Hence, the five-fold increase in selectivity under VSC reported here is probably much larger if corrected for such features. For instance, experiments could be done in a tubular cavity to ensure a larger fraction of coupled molecules. Therefore, the selectivity and specificity 5
displayed by VSC in the current experiment shows the remarkable potential of light-matter strong coupling for enhancing site selectivity of organic and inorganic chemical reactions. More reactions must be studied to evaluate the generality of this phenomenon and to see to what extent the selectivity can be enhanced at a given site. As more and more studies show (18–22, 37–49), this weak field method that works at room temperature has the potential to become an everyday 10
tool for chemists to physically control chemical reactivity without catalysts, pre-functionalization or chemical changes to the reaction conditions.
References
15
1. A. H. Hoveyda, D. A. Evans, G. C. Fu, Chem. Rev. 93, 1307–1370 (1993).
2. N. A. Romero, K. A. Margrey, N. E. Tay, D. A. Nicewicz, Science. 349, 1326–1330 (2015). 3. Z. Huang, G. Dong, Acc. Chem. Res. 50, 465–471 (2017).
4. K. Godula, D. Sames, Science. 312, 67–72 (2006).
5. R. T. Hall, G. C. Pimentel, J. Chem. Phys. 38, 1889–1897 (1963). 20
6. Q. Wang, R. W. Schoenlein, L. A. Peteanu, R. A. Mathies, C. V. Shank, Science. 266, 422– 424 (1994).
7. M. Delor et al., Science. 346, 1492–1495 (2014).
8. H. Frei, L. Fredin, G. C. Pimentel, J. Chem. Phys. 74, 397–411 (1981). 9. A. Sinha, M. C. Hsiao, F. F. Crim, J. Chem. Phys. 94, 4928–4935 (1991). 25
10. R. N. Zare, Science. 279, 1875–1879 (1998). 11. F. F. Crim, Acc. Chem. Res. 32, 877–884 (1999).
12. S. Yan, Y.-T. Wu, B. Zhang, X.-F. Yue, K. Liu, Science. 316, 1723–1726 (2007). 13. D. R. Killelea, V. L. Campbell, N. S. Shuman, A. L. Utz, Science. 319, 790–793 (2008). 14. F. F. Crim, Proc. Natl. Acad. Sci. USA. 105, 12654–12661 (2008).
30
15. W. Zhang, H. Kawamata, K. Liu, Science. 325, 303–306 (2009). 16. J. C. Polanyi, Acc. Chem. Res. 5, 161–168 (1972).
17. K. Liu, Annu. Rev. Phys. Chem. 67, 91–111 (2016). 18. A. Shalabney et al., Nat. Commun. 6, 5981 (2015).
10
19. J. George, A. Shalabney, J. A. Hutchison, C. Genet, T. W. Ebbesen, J. Phys. Chem. Lett. 6, 1027–1031 (2015).
20. J. George et al., Phys. Rev. Lett. 117, 153601 (2016).
21. R. M. A. Vergauwe et al., J. Phys. Chem. Lett. 7, 4159–4164 (2016). 22. A. Thomas et al., Angew. Chem. Int. Ed. 55, 11462–11466 (2016). 5
23. T. W. Ebbesen, Acc. Chem. Res. 49, 2403–2412 (2016). 24. J. A. Hutchison et al., Adv. Mater. 25, 2481–2485 (2013). 25. S. Wang et al., Nanoscale. 6, 7243–7248 (2014).
26. E. Orgiu et al., Nat. Mater. 14, 1123–1129 (2015). 27. D. M. Coles et al., Nat. Mater. 13, 712–719 (2014). 10
28. X. Zhong et al., Angew. Chem. Int. Ed. 55, 6202–6206 (2016). 29. X. Zhong et al., Angew. Chem. Int. Ed. 56, 9034–9038 (2017).
30. K. Stranius, M. Hertzog, K. Börjesson, Nat. Commun. 9, 2273 (2018).
31. G. C. Schatz, M. C. Colton, J. L. Grant, J. Phys. Chem. 88, 2971–2977 (1984). 32. A. Grill, D. A. Neumayer, J. Appl. Phys. 94, 6697–6707 (2003).
15
33. M. Kasha, Radiation Research. 20, 55–70 (1963).
34. J. A. Hutchison, T. Schwartz, C. Genet, E. Devaux, T. W. Ebbesen, Angew. Chem. Int. Ed.
51, 1592–1596 (2012).
35. J. Galego, F. J. Garcia-Vidal, J. Feist, Nat. Commun. 7, 13841 (2016). 36. J. Galego, F. J. Garcia-Vidal, J. Feist, Phys. Rev. Lett. 119, 136001 (2017). 20
37. S. Gambino et al., ACS Photonics. 1, 1042–1048 (2014). 38. J. P. Long, B. S. Simpkins, ACS Photonics. 2, 130–136 (2015).
39. W. Ahn, I. Vurgaftman, A. D. Dunkelberger, J. C. Owrutsky, B. S. Simpkins, ACS
Photonics. 5, 158–166 (2018).
40. M. Hertzog et al., Chem. Eur. J. 23, 18166–18170 (2017). 25
41. O. Kapon, R. Yitzhari, A. Palatnik, Y. R. Tischler, J. Phys. Chem. C. 121, 18845–18853 (2017).
42. S. R. Casey, J. R. Sparks, J. Phys. Chem. C. 120, 28138–28143 (2016).
43. V. F. Crum, S. R. Casey, J. R. Sparks, Phys. Chem. Chem. Phys. 20, 850–857 (2018). 44. G. G. Rozenman, K. Akulov, A. Golombek, T. Schwartz, ACS Photonics. 5, 105–110 30
11
45. D. S. Dovzhenko, S. V. Ryabchuk, Y. P. Rakovich, I. R. Nabiev, Nanoscale. 10, 3589– 3605 (2018).
46. D. G. Baranov, M. Wersäll, J. Cuadra, T. J. Antosiewicz, T. Shegai, ACS Photonics. 5, 24– 42 (2018).
47. F. Herrera, F. C. Spano, Phys. Rev. Lett. 116, 238301 (2016). 5
48. L. A. Martínez-Martínez, R. F. Ribeiro, J. Campos-González-Angulo, J. Yuen-Zhou, ACS
Photonics. 5, 167–176 (2018).
49. J. Flick, C. Schäfer, M. Ruggenthaler, H. Appel, A. Rubio, ACS Photonics. 5, 992–1005 (2018).
10
Acknowledgments:
Funding: We acknowledge support of the International Center for Frontier Research in
Chemistry (icFRC, Strasbourg), the ANR Equipex Union (ANR-10-EQPX-52-01), the Labex NIE projects (ANR-11-LABX-0058 NIE) and CSC (ANR-10-LABX- 0026 CSC) within the 15
Investissement d’Avenir program ANR-10-IDEX-0002-02.
Competing interests: Authors declare no competing interests
Data and materials availability: All data is available in the main text or the supplementary
materials.
Supplementary Materials:
20
Materials and Methods Figures S1-S6
25
30
download file view on ChemRxiv
12
Supplementary Materials for
Tilting a Ground State Reactivity Landscape by Vibrational Strong Coupling
A. Thomas1#, L. Lethuillier-Karl1#, K. Nagarajan1, R. M. A. Vergauwe1, J. George1‡, T.
5
Chervy1†, A. Shalabney2, E. Devaux1, C. Genet1, J. Moran1*, T. W. Ebbesen1* 1University of Strasbourg, CNRS, ISIS & icFRC,
8 allée G. Monge, 67000 Strasbourg, France.
2Braude College, Snunit Street 51, Karmiel 2161002, Israel
10
*Correspondence to: [email protected]; [email protected] #These authors contributed equally
Present Address:
‡Department of Chemistry. Indian Institute of Science Education and research Mohali, Mohali,
India. 15
†Department of Physics, ETH Zurich, Switzerland
This PDF file includes:
20
Materials and Methods Figs. S1 to S6
25
Materials and Methods
Unless otherwise noted, all reagents and solvents were purchased from commercial suppliers and used without further purification.
The IR transmission spectra of the Fabry-Pérot cavities and the ‘outside the cavity’ cells were acquired by 30
standard FT-IR (Fourier transform infrared) spectrometer (Bruker Vertex70) in transmission mode. The transmission was recorded by DTGS (deuterated triglycine sulfate) detector with 2 cm−1 resolution over 64 scans.
GC-MS analysis was performed on a GC System 7820A (G4320) connected to a MSD block 5977E (G7036A), using Agilent High Resolution Gas Chromatography Column: PN 19091S – 433UI, HP – 5MS UI, 28m×0.250 mm, 0.25 Micron, SN USD 489634H. All samples were prepared in 2-propanol (200 µL sample 35
volume). The analysis was carried out on a splitless 1 µL injection volume with an injection port temperature 250 °C. Column oven temperature program was as follows: 60 °C for 1 min, ramped at 30 °C min-1 to 310 °C with 3 min
13
the electron ionization mode with quadrupole temperature of 150 °C. Data acquisition was performed in the full-scan mode (50-500). Hydrogen (99.999 % purity) was used as carrier gas at a constant flow rate of 1.5 mL min-1.
1H NMR spectrum of starting material L1 in CDCl3 was recorded on a Bruker Avance 400 (400 MHz)
spectrometer at ambient temperature and is reported in ppm scale using the residual solvent resonance as the internal reference (CHCl3 at 7.26 ppm). Coupling constants J are reported in Hz, as determined using the software (NMR
5
Notebook v2.80). 13C NMR spectrum was recorded on a Bruker Avance 400 (100 MHz) spectrometer and is reported
in ppm using the residual solvent resonance as the internal standard (CDCl3 at 77.0 ppm).
Synthesis of tert-butyldimethyl((4-(trimethylsilyl)but-3-yn-1-yl)oxy)silane (L1)
To a stirred solution of 4-(trimethylsilyl)but-3-yn-1-ol (3.50 mmol, 0.585 mL) in DMF (5 mL) at 0 °C were added imidazole (8.75 mmol, 0.596 g) and tert-butylchlorodimethylsilane 10
(4.38 mmol, 0.658 mg). The mixture was allowed to warm to room temperature and was stirred for 24 hours. The reaction was quenched by the addition of aq. saturated NH4Cl (15 mL). The
organic layer was collected and extracted with diethyl ether through repeated washings. The combined organic fractions were then washed with water, dried over Na2SO4 and concentrated
under reduced pressure to give the crude product as a pale yellow liquid. The crude product was 15
purified by column chromatography on silica using a mixture of ethyl acetate and petroleum ether (1:9; v/v) as the eluent to give the pure product L1 (0.754 g; 84%) as a colourless liquid.
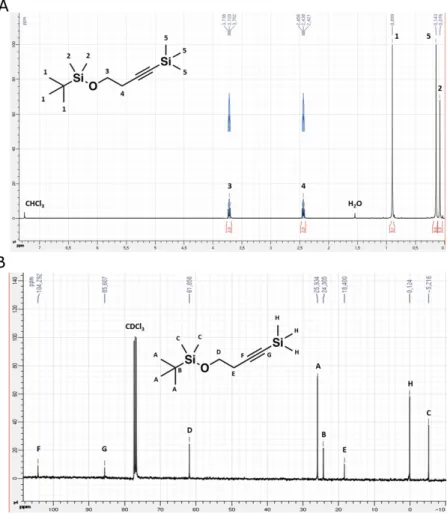
1H NMR (400 MHz, CDCl 3) δ 3.72 (t, J = 7.0 Hz, 2H, 3), 2.44 (t, J = 7.0 Hz, 2H, 4), 0.90 (s, 9H, 1), 0.14 (s, 9H, 5), 0.08 (s, 6H, 2) 13C NMR (101 MHz, CDCl 3) δ 104.29 (F), 85.61 (G), 61.86 (D), 25.93 (A), 24.31 (B), 18.40 (E), 0.12 (H), -5.22 20 (C)
14
Fig. S1. (A) shows the 1H NMR spectrum of the reactant L1 with its various 1H signals labelled from 1 to 5 on the
schematic structure of L1 given in the inset. (B) Shows the 13C NMR spectrum with its various 13C signals marked
from A to H.
Preparation of the Fabry-Pérot cavity
5
The IR cell (demountable flow cell) compatible for temperature controlled measurements was purchased from Specac. The ZnSe (2 mm) were used as the IR-transmitting window substrates. The metal mirrors for the Fabry-Pérot cavity were prepared by evaporating Au (10 nm) on to the ZnSe windows. To ensure chemical insulation during the reaction from both the metal and ZnSe, each windows were coated with 200 nm of glass. To obtain the FabryPérot cavity, the Au coated windows were placed in the IR cell, sandwiched by Mylar spacers (~6 -10
12 µm) and tightened with the screws. The on- as well as off- resonance cavities were prepared by varying the spacer thickness.
For reference experiments, mentioned as outside the cavity, the liquid cells were prepared in a similar manner as explained above but replacing the metal mirror with glass (200 nm) coated ZnSe windows.
Tuning the Fabry-Pérot cavities:
15
15
such an “empty” cavity of length L, will show a transmission spectrum with a series of resonances. The frequency of these modes, which are multiples of the fundamental cavity mode, in wavenumber units is given by the equation
(S1)
where m is the mode order, n is the refractive index of the medium and L is the thickness of the cavity in micrometer. The spacing between each mode, called the free spectral range (FSR), gives the frequency 5
corresponding to the fundamental mode. For a given spacer thickness and metal mirrors, the FSR of such an “empty” cavity will be a constant and the injection of the sample will further change the cavity mode spacing as a function of the refractive index n of the injected sample. As a general procedure, to prepare an on-resonance cavity with respect to a given vibrational transition, we first calculate the refractive index n of the medium to be injected. Subsequently, the “empty” cavity is tuned to get the required the FSR, such that when the sample is injected, one of 10
the cavity mode is in resonance with the chosen vibrational transition. For example, in the present experiments, to make an on-resonance cavity with Si-C stretching transition at 842 cm-1, we first tuned our “empty” cavity to attain
the FSR of 586 cm-1 as shown in Fig. S2A. Therefore the injection of our reaction mixture, whose n is 1.395, will
modify the FSR to 420 cm-1 and result in the strong coupling of the Si-C stretching transition with the second mode
of the cavity as shown in Fig. S2b. 15
Fig. S2. Measured optical resonances of a microfluidic Fabry-Pérot cavity of length 8.5 µm before (A) and after (B) the injection of reaction mixture
nL m cm 2 104 ) ( -1 = n
16
Preparation of the reaction mixture and injection into the Fabry-Pérot cavities
Once the desired “empty” cavity was obtained, the liquid sample cell was inserted in the variable temperature mount and was kept for 2 hours to stabilise and equilibrate to the experimental temperature (25 oC,
except if noted otherwise).
The sample injection into the cavities and liquid cells were done as follows. A stock solution of TBAF (3 5
M) was prepared using a mixture of MeOH and THF in 1:1 ratio (v/v). For the reaction medium, the starting material L1 (0.31 mmol, 100 µL) was mixed MeOH (75 µL) and THF (75 µL) in a 5 mL glass vial followed by the addition of TBAF stock solution (100 µL). The mixture was shaken to obtain a homogeneous solution and was then directly injected into the microfluidic Fabry-Pérot cavity making sure that the cavity is filled without any air-bubbles.
10
Rate of the reaction
The rate of the reaction was calculated from the shift in the higher order cavity mode. The reactant and the products have slightly different reactive indices resulting in a change of the background refractive index (n) of the reactive medium as the reaction progresses. It will lead to shift of the cavity modes, as evident from Eq. S1. The use of ZnSe windows for making the sample cells for outside the cavity experiments resulted in a very weak interference 15
fringes as shown in Fig. S3C. This is due to the relatively large difference between the n of ZnSe and the reactive medium. These weak interference fringes also shifted in the same was as that of the cavity mode, indicating the progress of the reaction.
To calculate the rate of the reaction, the temporal shift (Dν̅t) of a higher order cavity mode peak for all on-
as well as off-resonance experiments with respect to the starting value (ν̅0) was recorded. For experiments outside
20
the cavity, the peak of a weak interference fringe was considered. For all these experiments a mode at ~5000 cm-1,
well isolated from the molecular vibrational modes were monitored as shown in Fig.S3. The maximum shift (Dν̅¥)
corresponding to the completion of the reaction was determined separately from an outside the cavity experiment. The ln plot of the temporal shift (ln(1-Dν̅t/Dν̅¥ )) gave a straight line, indicating the first order reaction and from the
slope the rate constant for the total reaction (kTR) was calculated. 25
17
Fig. S3. FT-IR transmission spectrum of the on-resonance cavity (A), off-resonance cavity (B),
and outside the cavity (C) immediately after injection of the reaction mixture (red curve) and after 2h (blue curve). (D-G) Shows the temporal shift of the higher cavity order mode during the reaction (0 to 2h) for cavities on-resonance with the Si-C (D) and the Si-O stretching mode (E), 5
18
Products identification and quantitative GC-MS analysis
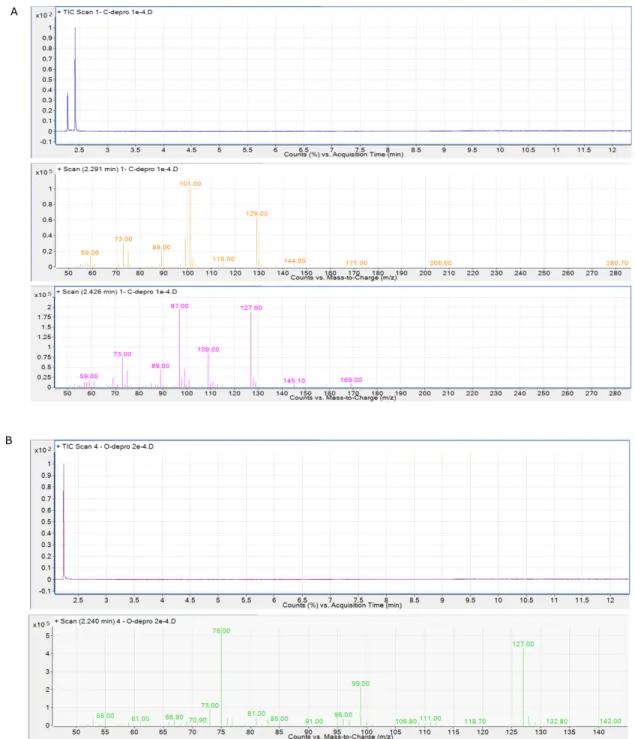
Reaction products 1 and 2 were identified by comparing the mass spectra and retention times against commercially available samples of 1 and 2 (Fig. S4)
Fig. S4. GC trace and mass spectra of commercially available product 1 (A) and 2 (B)
19
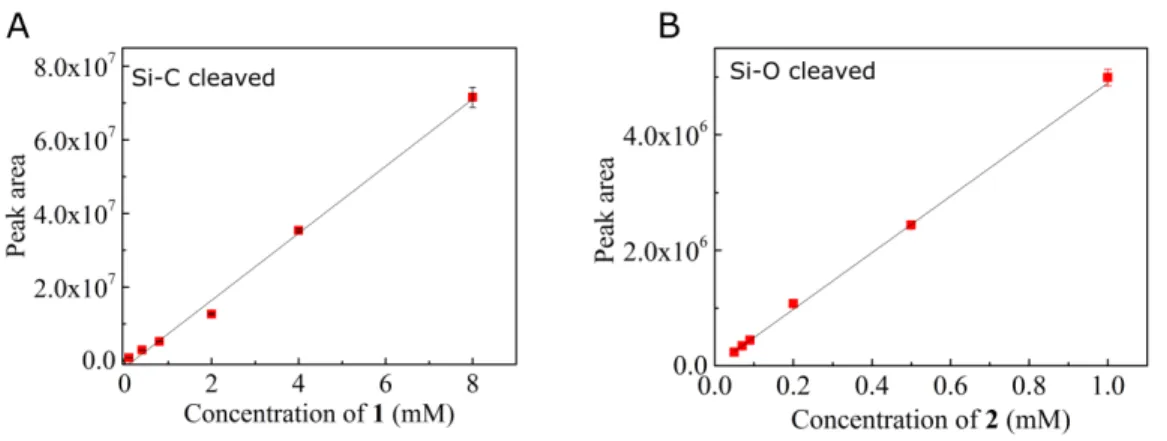
GC-MS calibration curves and the analysis of the products
200 µL solutions of compound 1 and 2 at different concentrations (0.1 to 10 mM) were prepared by diluting stock solutions of these compounds in isopropanol. For each compound, a six-point graph was plotted; correlating the characteristic GC peaks (as integrated automatically by the Agilent MassHunter Workstation v.B.06.00 software) with substrate concentration (Fig. 5
S5). Each data point was the mean of three independent measurements and the correlation line was obtained from the least-squares fitting (intercept = 0). Error bars on graphs are shown as ± standard deviation for each data point.
Fig. S5. Correlation between the concentration of the products in isopropanol and the measured
10
gas chromatography peak areas. The calibration curve for C- and O-deprotected products are shown in (A) and (B) respectively.
After 3h of reaction, the microfluidic Fabry-Pérot cavity (for on- and off-resonance measurements) as well as the liquid cells of the outside the cavity experiments was opened and the reaction mixture was extracted with 15
isopropanol (1mL). 200 µL of this solution were directly injected in GC-MS. The concentrations of 1 and 2 in the reaction mixture were calculated by comparing the product peak area with the calibration line and the ratio between the two products (1 over 2) was determined. The reported ratios are an average of multiple runs, with an error corresponding to the mean (±) absolute deviation.
20
25
20
Kinetics of reactions strongly coupled to the C-O stretching vibration of L1 and solvents
5
Fig. S6. (A) FT-IR transmission spectrum of the starting material L1 in the reaction mixture consisting of MeOH
and THF, recorded outside cavity with the C-O stretching vibration noted in the plot. (B) The FT-IR transmission spectra showing the vibrational strong coupling of the C-O stretching vibration of L1, MeOH and THF. (C) Kinetics of the reactions in cavities tuned to be on-resonance with the C-O stretching mode of L1 (violet circles) together with an off-resonance cavity (green squares) and outside the cavity (blue triangles).
10 15 20 25 30 35
download file view on ChemRxiv