HAL Id: hal-00316965
https://hal.archives-ouvertes.fr/hal-00316965
Submitted on 1 Jan 2002
HAL is a multi-disciplinary open access
archive for the deposit and dissemination of
sci-entific research documents, whether they are
pub-lished or not. The documents may come from
teaching and research institutions in France or
abroad, or from public or private research centers.
L’archive ouverte pluridisciplinaire HAL, est
destinée au dépôt et à la diffusion de documents
scientifiques de niveau recherche, publiés ou non,
émanant des établissements d’enseignement et de
recherche français ou étrangers, des laboratoires
publics ou privés.
signatures of magnetopause reconnection during a
changing IMF Bz polarity
S. E. Pryse, A. M. Smith, L. Kersley, I. W. Mccrea
To cite this version:
S. E. Pryse, A. M. Smith, L. Kersley, I. W. Mccrea. EISCAT Svalbard radar observations of ionospheric
signatures of magnetopause reconnection during a changing IMF Bz polarity. Annales Geophysicae,
European Geosciences Union, 2002, 20 (4), pp.477-486. �hal-00316965�
Annales Geophysicae (2002) 20: 477–486 c European Geophysical Society 2002
Annales
Geophysicae
EISCAT Svalbard radar observations of ionospheric signatures of
magnetopause reconnection during a changing IMF B
Z
polarity
S. E. Pryse1, A. M. Smith1, 3, L. Kersley1, and I. W. McCrea2
1Department of Physics, University of Wales, Aberystwyth, SY23 3BZ, UK
2Rutherford Appleton Laboratory, Department of Space Science, Didcot, OX11 0QX, UK 3Now at DERA, Malvern, WR14 3PS, UK
Received: 15 January 2001 – Revised: 20 July 2001 – Accepted: 12 September 2001
Abstract. Observations by the EISCAT Svalbard radar are
presented that show the response of the spatial structure of the ionosphere in the dayside cusp region to a rotational trend in the IMF clock angle. Over a period of one hour, the clock angle increased from about 45◦ to some 150◦, mov-ing the likely location of the magnetopause reconnection site from the high-latitude lobe to near the equatorial plane. In-creased topside electron temperatures measured by the ESR identified footprints of the reconnection process. Tempo-ral changes in the spatial distribution of the temperature re-flected the change from lobe to equatorial reconnection. Dis-crete spatial enhancements in ion temperature were found resulting from ion-neutral frictional heating in the fast flows where it was likely that field lines were being convected from the reconnection locations. The corresponding electron den-sity structuring is interpreted in terms of the particle precipi-tation, field-aligned currents and convection flows driven by the IMF.
Key words. Ionosphere (ionosphere – magnetosphere
inter-actions; plasma temperature and density; polar ionosphere)
1 Introduction
The coupling of the solar wind to the Earth’s environment is generally accepted to occur by reconnection between the in-terplanetary magnetic field (IMF) and the geomagnetic field (Dungey, 1961). The location of the reconnection site de-pends on the orientation of the IMF. Reconnection occurs preferentially at low magnetopause latitudes near the equato-rial plane for negative BZwith the newly opened field-lines
being swept anti-sunward, while a strongly positive BZtends
to cause reconnection at high latitudes in the magnetospheric lobes with the opened field lines initially moving sunward (Lockwood, 1998). The magnetospheric processes occur throughout a very large volume of space and can be sampled in situ at only limited positions and at times set by spacecraft
Correspondence to: S. E. Pryse (sep@aber.ac.uk)
trajectories. However, when the processes are mapped down the converging geomagnetic field lines in the cusp region to ionospheric altitudes, their signatures are brought into closer proximity, enabling their study over an extended spatial ex-tent using ground-based instrumentation. The observation of the ionospheric footprints of magnetic reconnection pro-vides a powerful tool for understanding the magnetospheric process.
Optical signatures of reconnection have been classified ac-cording to the clock angle of the IMF (Sandholt et al., 1998). Type 1 aurora occur at latitudes of ∼70◦–74◦MLAT un-der conditions of equatorial reconnection with clock angles greater than 90◦. Type 2 aurora, at ∼78◦–79◦MLAT,
rep-resent signatures of lobe reconnection when the clock an-gle is less than 45◦. Co-existing type 1 and type 2
auro-ral forms occur at clock angles between 45◦and 90◦. Sig-natures of reconnection in low-altitude satellite precipitat-ing particle measurements have also been classified (Newell and Meng, 1995) according to their velocity-filter dispersion (Rosenbauer et al., 1975). For equatorial reconnection, the fastest ions from the reconnection site enter the ionosphere at the lowest latitudes, with the slower ions arriving slightly later when the newly opened field lines have convected anti-sunward to higher latitudes. Under conditions of lobe recon-nection, where the initial motion of the newly-opened field lines is sunward, the dispersion signature is reversed with the faster particles arriving at the higher latitudes. Tomo-graphic images have been used to identify spatial structures in the ionospheric electron density related to both equatorial (Walker et al., 1998) and lobe (Pryse et al., 1999) reconnec-tion. Both studies revealed signatures of ion dispersion, with the altitude of the F-layer peak being the lowest at the leading edge of the dispersion and increasing in the tail of softer pre-cipitation. Signatures of equatorial reconnection have been identified by the EISCAT mainland radar, when it was ob-serving north of the radar site (Lockwood 1993). The EIS-CAT radar has also been used to observe spatial structures of enhanced electron temperature in regions that map to satel-lite ion dispersion signatures (Pryse et al., 2000a). These
- 1 0 - 5 0 5 1 0 0 9 : 0 0 : 0 0 0 9 : 3 0 : 0 0 1 0 : 0 0 : 0 0 - 1 0 - 5 0 5 0 9 : 0 0 : 0 0 0 9 : 3 0 : 0 0 1 0 : 0 0 : 0 0 - 4 0 4 8 0 9 : 0 0 : 0 009:00 0 9 : 3 0 : 0 009:30 1 0 : 0 0 : 0 010:00 Time (UT) 0 -5 8 4 0 -4 5 -10 -5 0 5 10 -10 Bx G SM (n T) By G SM (n T) Bz G SM (n T) 0 40 80 120 160 09:00:0009:00 09:15 09:30:0009:30 09:45 10:00:0010:00 Time (UT) 160 140 120 100 80 60 40 20 0 Cl oc k A ng le (d eg .)
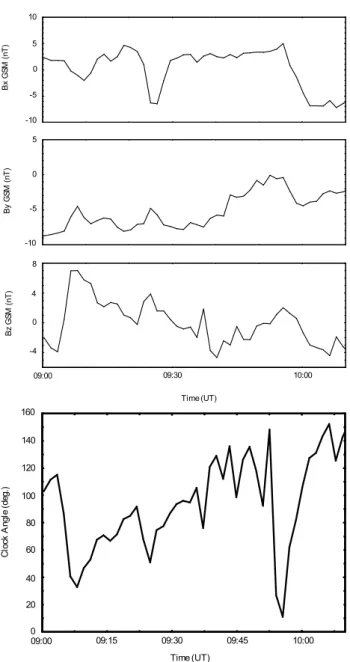
Fig. 1. (a) The three components of the IMF measured by the WIND satellite between 09:00 UT and 10:10 UT on 24 January 1999, and (b) the corresponding clock angle.
increased temperatures extended through the topside iono-sphere to the F-layer peak and had a steep latitudinal ent on their equatorward edge. The sharp temperature gradi-ent was related to the open-closed magnetic field boundary with the particles being able to enter the ionosphere along the open field to the north and deposit their energy. On the poleward side of the gradient, mapping to the ion dispersion region where the energy of the incoming ions decreased with increasing latitude, the altitude of the bottomside boundary of the enhanced temperatures appeared to increase with lat-itude. On the wider scale, reconnection drives the plasma convection over the entire polar cap. Equatorial reconnec-tion gives rise to a two-cell high-latitude convective flow, with anti-sunward cross-polar flow and return sunward flows
at lower latitudes in the dawn and dusk sectors (Reiff and Burch, 1985; Cowley, 1998). In contrast, lobe reconnec-tion is believed to generate a pair of lobe convecreconnec-tion cells in the polar cap, with sunward cross-polar flow. Tension forces caused by the IMF BY component tend to distort the
sym-metry of the convection cells, displacing the cross-polar flow dusk-ward or dawn-ward from the solar meridian (Cowley et al., 1991).
While markers of the equatorward edge of equatorial re-connection have been observed by the EISCAT mainland radar, the location of the radar at 69.5◦N is normally too far south to observe the complete reconnection signature. More-over, this radar is not able to observe the ionospheric foot-prints of lobe reconnection, which are found at higher lati-tudes. The location of the EISCAT Svalbard Radar (ESR) at 78.2◦N is more favourable for observations in the vicinity of the cusp. Signatures of equatorial reconnection have been seen by this radar when observing along the magnetic field (Pryse et al., 2000a) and spatial structures of increased elec-tron temperatures within the reverse ion-dispersion of lobe reconnection have been identified in a multi-instrument in-vestigation of the ionosphere under steady northward IMF (Pryse et al., 2000b). The current paper develops the use of the ESR to investigate the spatial signatures of reconnection processes in the ionospheric plasma. It presents results from a period near magnetic noon on 24 January 1999 when the IMF clock angle changed in a steady trend, from small an-gles favouring lobe reconnection, through intermediate con-ditions, to angles associated with equatorial reconnection. The radar observations are interpreted in terms of the precip-itation, the convection patterns and the field-aligned currents that are likely to occur under the prevalent IMF conditions.
2 Observations
2.1 Interplanetary magnetic field
At about 09:00 UT on 24 January 1999 the GSE co ordinates of the WIND satellite were X ≈ −7.0 RE, Y ≈ −72.9 RE
and Z ≈ 2.8 RE, placing the satellite near the equatorial
plane and on the far side of the Earth from the Sun. The large relative magnitude of the Y co ordinate ensured that the satellite was located beyond the magnetopause in the so-lar wind. The satellite measured a plasma flow of between 580 km/s and 620 km/s during the time interval of interest. A simple calculation based on the geometry and solar wind velocity gives a negative delay of ∼ 3 min between the ob-servation of the interplanetary magnetic field (IMF) and the time of impact at an assumed location of X ∼ 10 RE for
equatorial reconnection. This estimate is reduced to ∼ 1 min for reconnection in the magnetospheric lobe. With uncertain-ties in the propagation delay across the magnetopause and in the resultant ionospheric response, it is unlikely that such small time delays would be of significance in the observa-tions. Furthermore, in the current study, where the emphasis was on the interpretation of the ionospheric response to a
S. E. Pryse et al.: EISCAT Svalbard radar observations during changing IMF BZ 479 72 74 76 78 80 82 500 400 300 200 72 74 76 78 80 82 500 400 300 200 72 74 76 78 80 82 500 400 300 200 72 74 76 78 80 82 500 400 300 200 Latitude (degrees) Ti (K) Vi (ms-1) Te (K) Ne (m-3) A lti tu de (k m ) A lti tu de (k m ) A lti tu de (k m ) A lti tu de (k m ) a) c) d) b)
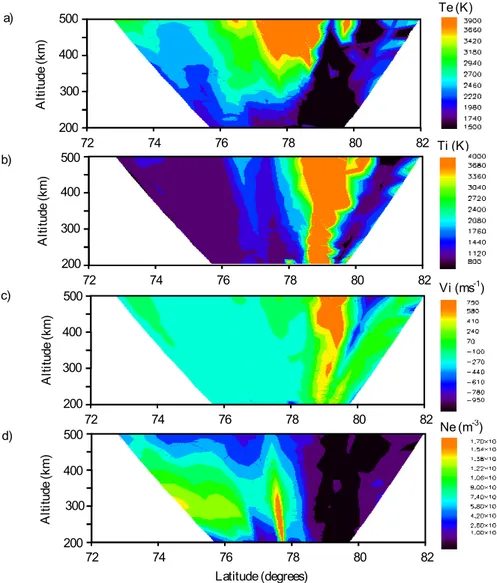
Fig. 2. (a) Electron temperatures, (b) ion temperatures, (c) line-of-sight ion drift velocities and (d) electron densi-ties measured by the ESR radar during a NOON scan between 09:10 UT and 09:30 UT.
trend over a period of about 1 h using three radar scans each of some 20 min duration, an ambiguity of ∼ 3 min was con-sidered unimportant.
The three components of the IMF measured by the WIND satellite during the period of interest between 09:10 and 10:10 UT are shown in Fig. 1a. There was a general transi-tion in the BZcomponent from about +7 nT to almost −4 nT
at the end, while the BY component was negative throughout,
starting at about −7 nT but decreasing in magnitude sub-sequently. The corresponding clock angle, estimated from the two components and important to the identification of the type of reconnection for the period 09:00 to 10:10 UT, is shown in Fig. 1b. During the interval of interest, subse-quent to about 09:10 UT, the clock angle shows a gradual trend from less than 45◦ to some 150◦, commensurate with a transition in the location of the ongoing reconnection from the magnetospheric lobe to the equatorial plane. The tran-sient excursion to low angles between 09:54 and 09:57 UT is not expected to have a significant effect on the results that focus on the response of the ionosphere on temporal scales of tens of minutes.
Corroboration is provided by the ACE satellite which observed a decreasing positive BZ component between
08:22 UT and 08:32 UT followed by negative BZ for the
re-mainder of the time of interest, with the exception of a pos-itive excursion between 09:00 and 09:05 UT that may relate to the transient measured by WIND just before 10:00 UT. An ionospheric delay of 43 min was estimated by simple calcu-lation, based on the satellite position that is well upstream and the measured plasma flow of about 580 km/s, with fur-ther allowance of a few minutes needed for the ionospheric response.
2.2 EISCAT Svalbard Radar (ESR)
The ESR radar (78.2◦N, 16.1◦E, 75.0◦MLAT, 113.1◦MLON) was observing in the UK NOON Spe-cial Programme mode. In this mode the radar performs scans of 20 min in duration in the geographic meridian, from an elevation of about 45◦ to the north to about 35◦ to the south with latitudinal steps of 0.32◦at an altitude of 300 km, with a dwell time of 60 s at each pointing direction.
72 74 76 78 80 82 500 400 300 200 72 74 76 78 80 82 500 400 300 200 72 74 76 78 80 82 500 400 300 200 72 74 76 78 80 82 500 400 300 200 Latitude (degrees) Ti (K) Vi (ms-1) Te (K) Ne (m-3) A lti tu de (k m ) A lti tu de (k m ) A lti tu de (k m ) A lti tu de (k m ) a) c) d) b)
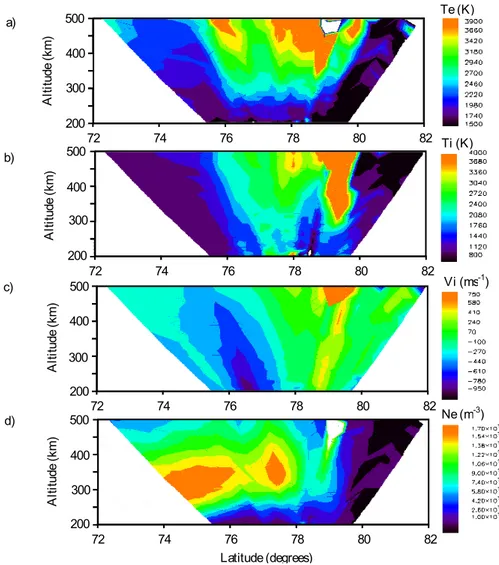
Fig. 3. (a) Electron temperatures, (b) ion temperatures, (c) line-of-sight ion drift velocities and (d) electron densi-ties measured by the ESR radar during a NOON scan between 09:30 UT and 09:50 UT.
The electron and ion temperatures, line-of-sight ion-drift velocities and electron densities, measured during the scan between 09:10 UT and 09:30 UT, corresponding to a clock angle regime of less than 90◦, are shown in the four panels of Fig. 2. The electron temperatures in the topside (Fig. 2a) show elevated values in mid-scan, with a sharp poleward boundary at about 79◦N. A small, detached region of high temperatures at the highest altitudes occurs further south near 76.5◦N. There are high ion temperatures (Fig. 2b) in excess
of 4000 K in a band extending vertically through the iono-sphere centred around 79◦N, in a region where the line-of-sight ion velocities were measured to be several hun-dreds of metres per second, while a much weaker band of marginally raised temperatures can also be seen to the south near 77◦N. The higher ion temperatures correspond to re-gions of depleted electron densities (Fig. 2d) one to the north and one equatorward of a very narrow field-aligned enhance-ment seen just south of 78◦N. The significance of these ob-servations, with high electron temperatures in the top-side providing markers for precipitation and high ion tempera-tures, indicating fast plasma flows, will be discussed in detail later.
Measurements during the period 09:30 UT to 09:50 UT, when the clock angle was about 90◦, are shown in Fig. 3. These correspond to a changing ionosphere during the tran-sition of the IMF from BZ positive-to-negative, and are
in-cluded for completeness. Of particular note is the increase in the extent of the enhanced electron temperatures near 76.5◦N (Fig. 3a) when compared to the previous scan.
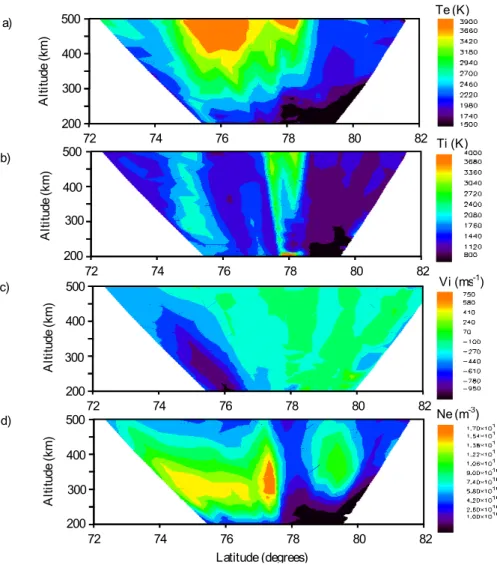
The results from the scan made between 09:50 UT and 10:10 UT, when the clock angle was greater than 90◦, are shown in Fig. 4. There is now a dominance of a region of high electron temperatures in the topside to the south, with an equatorial edge in the vicinity of 75◦N (Fig. 4a), broadly
coincident with a band of raised ion temperatures (Fig. 4b). A second discrete region with ion temperatures above the background can be seen near 78◦N, though the magnitudes of these temperatures are much lower than those observed at the higher latitudes in the earlier scan. The electron densities show reduced values near 78◦N, with a blob of enhanced densities to the south (Fig. 4d). However, it should be noted that the elevated values of the blob no longer extend to the lowest altitudes as they did at the time of the first scan. A detailed description of the salient features and their changing
S. E. Pryse et al.: EISCAT Svalbard radar observations during changing IMF BZ 481 72 74 76 78 80 82 500 400 300 200 72 74 76 78 80 82 500 400 300 200 72 74 76 78 80 82 500 400 300 200 72 74 76 78 80 82 500 400 300 200 Latitude (degrees) Ti (K) Vi (ms-1) Te (K) Ne (m-3) A lti tu de (k m ) A lti tu de (k m ) A lti tu de (k m ) A lti tu de (k m ) a) c) d) b)
Fig. 4. (a) Electron temperatures, (b) ion temperatures, (c) line-of-sight ion drift velocities and (d) electron densi-ties measured by the ESR radar during a NOON scan between 09:50 UT and 10:10 UT.
balance in response to the reconnection processes is given in the discussion section that follows.
2.3 Ionospheric plasma convection
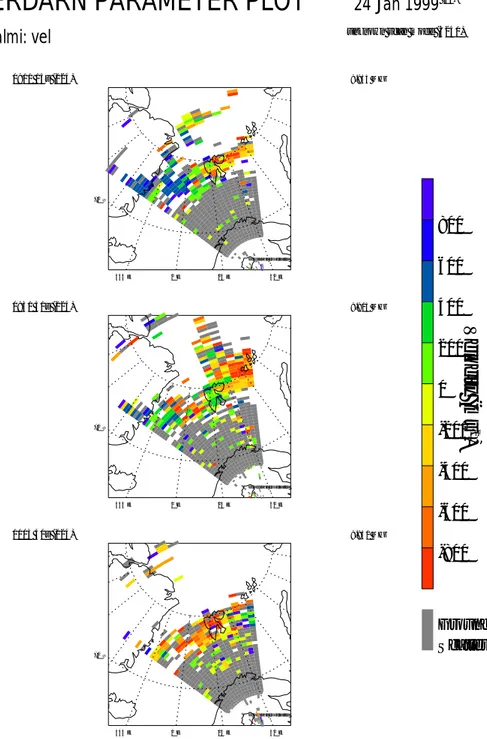
An indication of the convective flows in the vicinity of the ESR radar can be obtained from observations by the Finland CUTLASS SuperDARN radar that was observing in a spe-cial programme mode unrelated to the current experiment at the time of interest. While the scanning pattern was not ideal for the present work, nevertheless the observations serve to give some indication of the broad patterns of the plasma drift. Line-of-sight observations for three selected times are shown on a geographic grid in Fig. 5. The towards flow (blue) on the western side of the first panel, at about 09:11 UT and rep-resentative of conditions early in the period under study, is in keeping with a sunward cross-polar flow, while the away drift on the eastern side (orange) is consistent with an anti-sunward flow. The second panel shows that by 09:32 UT the flow into the polar cap from lower latitudes, in the east-ern side of the field-of-view, had strengthened and extended westwards with a weakening of the sunward flow in the
west-ern field-of-view. The third panel, at about 10:06 UT and rep-resentative of conditions near the end of the time of interest, reveals a flow that is away from the radar above Svalbard, consistent with an anti-sunward drift in the magnetic noon sector under conditions of equatorial reconnection.
3 Discussion
Interpretation of the results presented above requires un-derstanding of the reconnection processes driving the iono-spheric convective flow patterns at the different times. The clock angle of the IMF changed from less than 45◦ near
09:10 UT to about 150◦at the end of the period of interest. It is thus likely that while reconnection at the lobe was the dominant process in the early stages of the observations, by the end the reconnection site would be expected to be equa-torial. In the middle of the time period, when the IMF clock angle lay between 45◦ and 90◦, it is anticipated that there was simultaneous reconnection at both locations (Sandholt et al., 1998). The results from ESR thus reflect the differ-ent balances as the dominance of the two reconnection
pro-Geographic coordinates 0911 15s (024) 9.955 MHz 70°N 0°E 15°E 30°E 345°E Geographic coordinates 0931 31s (024) 9.905 MHz 70°N 0°E 15°E 30°E 345°E Geographic coordinates 1005 40s (024) 9.950 MHz 70°N 0°E 15°E 30°E 345°E -800 -600 -400 -200 0 200 400 600 800
Velocity (ms
-1)
Ground ScatterSUPERDARN PARAMETER PLOT
Hankasalmi: vel
24 Jan 1999
(24)unknown scan mode (5241)
Fig. 5. Representative line-of-sight plasma flow velocities measured by the Finland CUTLASS SuperDARN radar at selected times during the time interval of interest.
cesses changes, with important consequences for the convec-tion patterns driving the flow and the signatures seen in the ionosphere.
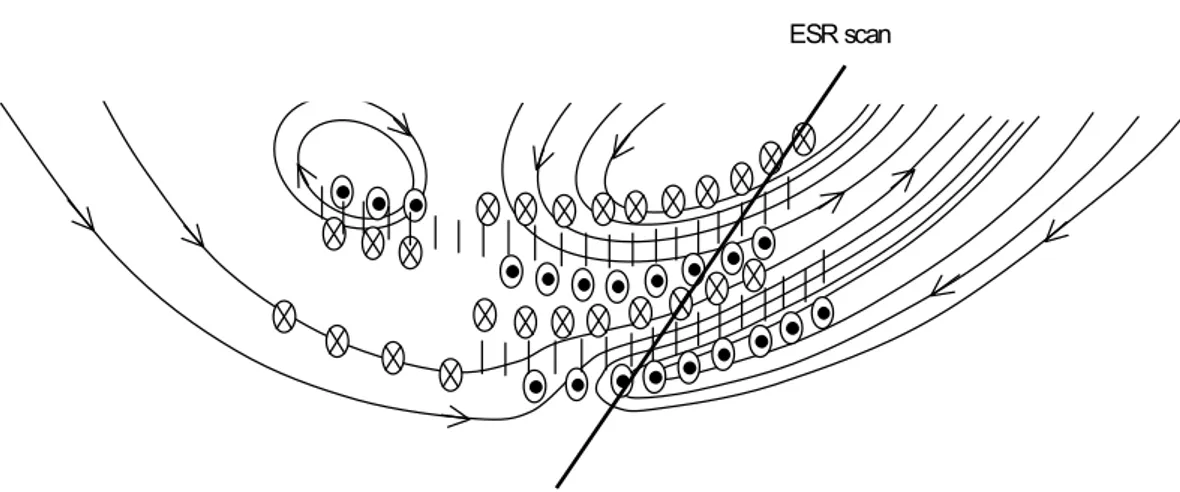
A schematic diagram of the general flow on the dayside and the corresponding field-aligned currents, anticipated dur-ing conditions of mid-clock angles, when there is simultane-ous reconnection at both lobe and equatorial sites, is shown in Fig. 6. The pattern is broadly reminiscent of that shown in Fig. 10 of the paper by Sandholt et al. (1998), but it has been drawn for the BY negative conditions applicable here
rather than for the BY positive of their study. The likely
ori-entation of the ESR scan in the geographic meridian, with respect to this pattern, is also shown on the diagram. In deriving their current systems, Sandholt et al. (1998) noted that E-region ionospheric conductivity in the midwinter cusp is determined significantly by cusp particle precipitation and has a two-banded structure. The conductivity gradients when combined with the flow then yield a multi-layer FAC sys-tem with a downward FAC near the poleward edge of the equatorial reconnection footprint and an upward FAC near
S. E. Pryse et al.: EISCAT Svalbard radar observations during changing IMF BZ 483
ESR scan
Fig. 6. Schematic diagram showing the anticipated general flow on the dayside under conditions of mid clock angle as a function of MLT and magnetic latitude. The MLT noon meridian extends down the centre of the figure with latitude decreasing from top to bottom. The arrowed curves show possible flow streamlines, and the circled dots and arrows represent the anticipated upward and downward field-aligned currents, respectively. Likely regions of auroral precipitation are shown by the hatched regions. A possible location of the ionospheric intersection of the ESR scan is shown by the straight line.
the equatorward edge of the lobe reconnection. Also shown in Fig. 6 are the likely locations of the two precipitation re-gions (hatched areas) for lobe reconnection in the north and equatorial reconnection at lower latitudes.
The general features of the flow illustrated in Fig. 6 are supported by the line-of-sight velocities that were available from the CUTLASS Finland radar and shown in Fig. 5. Early in the period, when the IMF clock angle indicated that lobe reconnection would be dominant, the towards flow seen in the west is in keeping with the sunward cross-polar flow of strong lobe cells, displaced west of 12 MLT in accord with BY < 0, as illustrated by the poleward part of Fig. 6. The
away drift to the east of Svalbard is consistent with the anti-sunward flow between the dusk lobe cell and the correspond-ing viscous cell. By 09:32 UT, under IMF mid-clock angles, the flow into the polar cap from lower latitudes in the eastern side of the field-of-view has strengthened under the influence of the equatorial reconnection, and is displacing the weaken-ing sunward flow in the west. The third panel of Fig. 5 for 10:06 UT is consistent with anti-sunward drift in the noon magnetic sector for equatorial reconnection under small neg-ative BY.
In interpreting the ESR radar results, it is perhaps useful to consider first the two extreme circumstances of an iono-sphere driven by solely lobe or by equatorial reconnection, but remembering that in reality, the observations reflected a changing balance between the dominance of the two circum-stances.
3.1 Predominant lobe reconnection
At the beginning of the interval of interest, with a clock an-gle less than 45◦and a likely reconnection site in the lobe, the flow in the polar cap is expected to be dominated by twin lobe cells, with BY < 0 causing the dusk cell to be
enlarged relative to the dawn cell (Cowley, 1998). The
sig-nature of lobe reconnection can be identified by the location of the enhanced electron temperatures with the sharp pole-ward boundary around 79◦N at the northern extremity of
the region of heated plasma (Fig. 2a). This is reminiscent of that identified by Pryse et al. (2000a) in observations by the EISCAT mainland radar, though in that example, it was the ion dispersion region under equatorial reconnection. The steep gradient in electron temperature in the topside found in the current study is broadly identified with the footprint of a reconnection site in the magnetospheric lobe. However, it must be kept in mind that the rather poor temporal and spa-tial resolutions of the radar in the scanning mode used here and the consequent integration of the data and interpolation of the plots do not bring out the fine details anticipated at this edge. Increased electron temperatures south of this gra-dient are likely to be the manifestation of the precipitation expected on the newly-reconnected field lines, in the more northern part of the hatched areas illustrated in Fig. 6. The ion temperatures in Fig. 2b show a band of values in excess of 4000 K between 78.5◦N and 79.5◦N. This broadly coincides with the expected lobe reconnection ionospheric mapping and is likely to have been caused by the ion-neutral frictional heating in the fast plasma flows on the newly-reconnected field lines in the dusk lobe convection cell as they are ac-celerated away from the reconnection site. The occurrence of fast flows in this region is supported by the line-of-sight ion-drift velocities measured by the ESR to be of several hun-dreds of metres per second (Fig. 2c). The possibility that the measurements are contaminated by non-Maxwellian spectra arising from toroidal distributions (Winser et al., 1989) in these large velocities has been ruled out.
Interpretation of the corresponding electron density struc-turing (Fig. 2d) requires consideration of precipitation, plasma flow and field-aligned currents (FACs). In the north-ern field-of-view, the plasma is depleted, with the low
den-sities broadly corresponding to the regions of enhanced ion temperatures, where the increased recombination rate due to ion-frictional heating may be counterbalancing any ioni-sation production by soft precipitation. Low densities also extend northward into the polar region. Increased densities occur south of about 78.5◦N, where the electron tempera-tures are increased. The narrow field-aligned density struc-ture near 77.5◦N coincides with the region of lower ion tem-peratures, where the horizontal plasma flows are likely to be slower. It lies near to the equatorial edge of the lobe pre-cipitation and is broadly coincident with the anticipated up-ward FAC of the double current sheet associated with the lobe reconnection (Fig. 6). Indeed the extension to the low-est altitudes may be indicative of increased ionisation due to electrons penetrating to low altitudes in the region of the current. Unfortunately, there were no green-line optical ob-servations available to provide confirmatory evidence of the upward FAC, and while, in principle, the alternating code of the radar mode used for the observations would allow E-region observations, in practice the low altitude data were too noisy to infer the presence or absence of energetic electrons. Reduced densities to the south of the enhancement coincide with a weaker region of ion heating, almost certainly rep-resenting the effect of the onset of equatorial reconnection discussed later, while the plasma at the southern extreme of the field-of-view is the extension of the solar-produced mid-latitude ionosphere.
3.2 Predominant equatorial reconnection
At the time of the ESR radar scan between 09:50 UT and 10:10 UT (Fig. 4), the trend in the IMF clock angle revealed values greater than 90◦, generally satisfying the conditions
for equatorial reconnection. It can be seen from Fig. 4 that there is now a region of high electron temperatures to the south, with a sharp equatorward edge near 75◦N. There is also a coincident band of increased ion temperatures between about 74.5◦N and 75.5◦N (Fig. 4b) that is linked to a region of strong flow toward the radar seen in the line-of-sight ve-locities (Fig. 4c). Elevated ion temperatures associated with the lobe reconnection persist near 78◦, although their values are substantially lower than the corresponding region of fric-tional heating in Fig. 2b.
3.3 Simultaneous lobe and equatorial reconnection In reality, the observations presented here show the simulta-neous effects of both lobe and equatorial reconnection. Even during the 20-minute duration of the first north-to-south scan, the effective IMF clock angle increased into the 45◦to 90◦ range for which reconnection may take place simultaneously at both sites (Sandholt et al., 1998). While the plasma fea-tures to the north, already described and presented in Fig. 2, represent signatures of lobe reconnection, later in the same scan the radar was interrogating a region that was beginning to show the effects of reconnection near the equatorial plane. The electron temperatures show a region of hotter plasma
be-ginning to develop from the highest altitudes between 76◦N
and 77◦N that can be related to the precipitation associated
with the equatorial reconnection shown by the lower latitude hatching on Fig. 6. Furthermore, the discrete band of slightly raised ion temperatures between 76◦N and 77◦N may mark the fast flows of plasma on the newly-reconnected field lines being drawn initially eastward under BY <0 and then into
the polar cap. The consequent erosion of the electron den-sities in this region by the enhanced recombination rate can also be noted in Fig. 2d.
The increasing importance of low-latitude reconnection over that at the lobe, as the IMF clock angle increases, can be inferred from the later ESR scans. Signatures of the transi-tion are evident in the results for the intermediate scan start-ing at 09:30 UT. The electron temperatures for this scan were presented in Fig. 3a. They showed an intermediate stage, with the growing effects of equatorial reconnection, but with the emphasis still being on the lobe. In addition, careful com-parisons of Fig. 3a and Fig. 4a show that the signatures of the equatorial reconnection have moved to lower latitudes be-tween the time of their observation in the two scans, near 09:45 UT and 10:05 UT, respectively. This equatorward pro-gression may be attributed to a slight increase in the magni-tude of BZbetween the two times.
The band of increased ion temperature between 75◦N and 76◦N, seen in Fig. 4b, may be attributed to the strengthening flow into the polar cap as the newly-opened field lines are accelerated away from the equatorial reconnection site. The electron densities in Fig. 4d show a depletion near 78◦N, cor-responding to the more northern band of increased ion tem-peratures where ion-neutral frictional heating was increas-ing the plasma recombination rate. It is also likely that the band of higher ion temperatures in the southern field-of-view removes some of the increasing solar-produced ionisa-tion. Similar features are observed in the electron densities in Fig. 2d and Fig. 4d. The blob between 77◦N and 78◦N is broader in latitudinal extent in the latter, possibly reflecting the diminishing influence of the upward FAC of the current sheet, while that of the downward current is increasing. It must be noted that the high densities in the blob now do not extend to low altitudes in the later observations. It can be recalled that the initial appearance of the field-aligned blob in this region (Fig. 2d) was attributed to precipitating elec-trons in the region of the upward FAC of the lobe recon-nection. However, by the time of the observations shown in Fig. 4d, the reduced densities at lower altitudes reflect the growing importance of the downward FAC associated with the equatorial reconnection process (Fig. 6). The downward FAC is driven by diverging electric fields, with resultant up-ward motion of ionospheric electrons. The situation here may be similar to that proposed for auroral ionospheric cav-ities (AIC) for which modelling studies have shown that the closure of field-aligned currents in the ionosphere may be responsible for density depletions that maximise at altitudes of about 140 km where the Pedersen conductivity is largest (Doe et al., 1995). The cavity forms where ionospheric elec-trons move upward as the charge carriers for a downward
S. E. Pryse et al.: EISCAT Svalbard radar observations during changing IMF BZ 485
FAC. The mechanism has been used by Nilsson et al. (1998) to explain electron density cavities observed by incoherent scatter radar in the E and lower F-regions and to discuss the possible occurrence of localised density holes that may de-velop in regions of black aurorae (Marklund, 1997). The co-located narrow band of increased ion temperatures, extend-ing upwards at about 77.5◦N (Fig. 4b) in the present study, may then relate to heating in regions of sheared field-aligned flows and currents (Shukla and Stenflo, 1999). It is proba-ble that the cold density enhancement seen at the high alti-tude between 78◦N and 80◦N in Fig. 4d is a polar feature of a long lifetime that has been carried into the field-of-view along the dusk lobe cell, and is not of direct relevance to the current study.
4 Conclusions
Observations by the ESR radar have been presented with ionospheric signatures of magnetospheric processes active during a period of about 1 hour when the clock angle of the IMF rotated through a steady trend from ∼ 45◦to ∼ 150◦, with a consequent transition in the location of the dominant magnetopause reconnection site from the high-latitude lobe to near the equatorial plane. It is important to note that the study has focused on the response to the general trend in the IMF clock angle, rather than on the details of individual ex-cursions in the record, due to the limitations of the ESR mode of operation. The NOON scanning programme used for the radar was designed to provide measurements of the horizon-tal spatial structure of the plasma, but over a time interval of 20 min necessary for each scan. It must be recognised that during this time the fine detail in the ionospheric parame-ters will change to some extent, making the scan unsuitable for investigation of a detailed response to IMF rotations at high temporal resolution. In addition, the horizontal resolu-tion of the radar scan, of some 0.32◦latitude in the F-region, was insufficient to reveal the detailed consequences of the re-connection processes, as seen in the earlier study of Pryse et al. (2000a) by the EISCAT mainland radar, where the resolu-tion in the F-region was 0.125◦latitude. However, the paper has demonstrated that gross features can be identified and their response to a trend in the IMF clock angle investigated. The electron temperatures in the topside ionosphere show hotter regions with a sharp latitudinal boundary that are linked to the dispersed incoming precipitation from the re-connection site. The ion temperatures demonstrate the effect of plasma convection as the field lines are accelerated away from the reconnection location, with the fast flows causing pronounced regions of ion-neutral frictional heating. It is clear that the increased recombination rate due to the heat-ing plays an important role in the structurheat-ing of the plasma density, with the rapid flows possibly inhibiting the increase in density due to the particle precipitation. Density signa-tures consistent with the FAC double current sheets have been identified, with the effect of the upward FAC dimin-ishing and that of the downward FAC growing as the IMF
clock angle increased during the period of simultaneous lobe and equatorial reconnection.
Acknowledgements. Financial support for the project has been
pro-vided by the UK Particle Physics and Astronomy Research Council under grant PPA/G/O/1999/00071. EISCAT is an international fa-cility supported by the national science councils of Finland, France, Germany, Japan, Norway, Sweden and the United Kingdom. The CUTLASS radar is a UK national facility funded by the Particle Physics and Astronomy Research Council; the data used here have been supplied by Prof. Sato of NIPR, Japan. The data provider for the WIND data was R. Lepping and the data were obtained from the CDAWeb. AMS acknowledges receipt of a PPARC postgradu-ate studentship.
Topical Editor G. Chanteur thanks S. W. H. Cowley and W. Denig for their help in evaluating this paper.
References
Cowley, S. W. H., Morelli, J. P., and Lockwood, M.: Dependence of convective flows and particle precipitation in the high-latitude dayside ionosphere on the X and Y -components of the interplan-etary magnetic field, J. Geophys. Res., 96, 5557–5564, 1991. Cowley, S. W. H.: Excitation of flow in the Earth’s
magnetosphere-ionosphere system: observations by incoherent scatter radar, in: Polar Cap Boundary Phenomena, (Eds) Moen, J., et al., NATO Advanced Science Institute Series, Kluwer Academic Press, Dor-drecht, The Netherlands, 509, 127–140, 1998.
Doe, R. F., Vickrey, J. F., and Mendillo, M.: Electrodynamic model for the formation of auroral ionospheric cavities, J. Geophys. Res., 100, 9683–9696, 1995.
Dungey, J. W.: Interplanetary magnetic field and the auroral zones, Phys. Rev. Lett., 6, 47–48, 1961.
Lockwood, M.: Identifying the open-closed field line boundary, in: Polar Cap Boundary Phenomena, (Eds) Moen, J., et al., NATO Advanced Science Institute Series, Kluwer Academic Press, Dor-drecht, The Netherlands, 509, 73–90, 1998.
Lockwood, M., Denig, W. F., Farmer, A. D., Davda, V. N., Cow-ley, S. W. H., and Luhr, H.: Ionospheric signatures of pulsed re-connection at the Earth’s magnetopause, Nature, 361, 424–428, 1993.
Marklund, G. T.: Auroral phenomena related to intense electric fields observed by the Freja satellite, Plasma Phys. and Con-trolled Fusion, 39, 195–226, 1997.
Newell, P. T. and Meng, C.-I.: Cusp low-energy ion cutoffs: A sur-vey and implications for merging, J. Geophys. Res., 100, 21 943– 21 951, 1995.
Nilsson, H., Kirkwood, S., and Moretto, T.: Incoherent scatter radar observations of the cusp acceleration region and cusp field-aligned currents, J. Geophys. Res., 103, 26 721–26 730, 1998. Pryse, S. E., Smith, A. M., Walker, I. K., and Kersley, L.:
Multi-instrument study of footprints of magnetopause reconnection in the summer ionosphere, Ann. Geophysicae, 18, 1118–1127, 2000a.
Pryse, S. E., Smith, A. M., Kersley, L., Walker, I. K., Mitchell, C. N., Moen, J., and Smith, R. W.: Multi-instrument probing of the polar ionosphere under steady northward IMF, Ann. Geophysi-cae, 18, 90–98, 2000b.
Pryse, S. E., Smith, A. M., Moen, J., and Lorentzen, D. A.: Foot-prints of lobe reconnection observed in ionospheric electron
den-sity under steady northward IMF, Geophys. Res. Lett., 26, 25–28, 1999.
Reiff, P. H. and Burch, J. L.: IMF BY-dependent plasma flow and Birkeland currents in the dayside magnetosphere: 2. A global model for northward and southward IMF, J. Geophys. Res., 90, 1595–1609, 1985.
Rosenbauer, H., Gruenwaldt, H., Montgomery, M. D., Paschmann, G., and Sckopke, N.: Heos-2 plasma observations in the distant polar magnetosphere: the plasma mantle, J. Geophys. Res., 80, 2723–2737, 1975.
Sandholt, P. E., Farrugia, C. J., and Cowley, S. W. H.: Pulsating cusp aurora for northward interplanetary magnetic field, J.
Geo-phys. Res., 103, 26 507–26 520, 1998.
Shukla, P. K. and Stenflo, L.: Velocity-gradient-drift electrostatic ion-cyclotron-drift waves and associated ion acceleration in the auroral ionosphere, Plasma Physics Reports, 25, 355–357, 1999. Walker, I. K., Moen, J., Mitchell, C. N., Kersley, L., and Sand-holt, P. E.: Ionospheric effects of magnetopause reconnection observed using ionospheric tomography, Geophys. Res. Lett., 25, 293–296, 1998.
Winser, K. J., Lockwood, M., Jones, G. O. L., and Suvanto, K.: Observations of nonthermal plasmas at different aspect angles, J. Geophys. Res., 94, 1439–1449, 1989.