HAL Id: hal-01512920
https://hal.sorbonne-universite.fr/hal-01512920
Submitted on 24 Apr 2017
HAL is a multi-disciplinary open access
archive for the deposit and dissemination of
sci-entific research documents, whether they are
pub-lished or not. The documents may come from
teaching and research institutions in France or
abroad, or from public or private research centers.
L’archive ouverte pluridisciplinaire HAL, est
destinée au dépôt et à la diffusion de documents
scientifiques de niveau recherche, publiés ou non,
émanant des établissements d’enseignement et de
recherche français ou étrangers, des laboratoires
publics ou privés.
Distributed under a Creative Commons Attribution - NonCommercial| 4.0 International
the North Atlantic branch of the Thermohaline
Circulation
Andrés Cózar, Elisa Martí, Carlos Duarte, Juan García-De-Lomas, Erik van
Sebille, J Ballatore, Victor Eguíluz, J Ignacio González-Gordillo, Maria
Pedrotti, Fidel Echevarría, et al.
To cite this version:
Andrés Cózar, Elisa Martí, Carlos Duarte, Juan García-De-Lomas, Erik van Sebille, et al.. The
Arctic Ocean as a dead end for floating plastics in the North Atlantic branch of the Thermohaline
Circulation. Science Advances , American Association for the Advancement of Science (AAAS), 2017,
3 (4), pp.e1600582. �10.1126/sciadv.1600582�. �hal-01512920�
W A T E R P O L L U T I O N 2017 © The Authors, some rights reserved; exclusive licensee American Association for the Advancement of Science. Distributed under a Creative Commons Attribution NonCommercial License 4.0 (CC BY-NC).
The Arctic Ocean as a dead end for floating plastics
in the North Atlantic branch of the
Thermohaline Circulation
Andrés Cózar,1* Elisa Martí,1 Carlos M. Duarte,2,3Juan García-de-Lomas,1Erik van Sebille,4,5 Thomas J. Ballatore,6,7Victor M. Eguíluz,8J. Ignacio González-Gordillo,1Maria L. Pedrotti,9 Fidel Echevarría,1Romain Troublè,10Xabier Irigoien11,12
The subtropical ocean gyres are recognized as great marine accummulation zones of floating plastic debris; however, the possibility of plastic accumulation at polar latitudes has been overlooked because of the lack of nearby pollution sources. In the present study, the Arctic Ocean was extensively sampled for floating plastic debris from the Tara Oceans circumpolar expedition. Although plastic debris was scarce or absent in most of the Arctic waters, it reached high concentrations (hundreds of thousands of pieces per square kilometer) in the northernmost and easternmost areas of the Greenland and Barents seas. The fragmentation and typology of the plastic suggested an abundant presence of aged debris that originated from distant sources. This hypothesis was corroborated by the relatively high ratios of marine surface plastic to local pollution sources. Surface circulation models and field data showed that the poleward branch of the Thermohaline Circulation transfers floating debris from the North Atlantic to the Greenland and Barents seas, which would be a dead end for this plastic conveyor belt. Given the limited surface transport of the plastic that accumulated here and the mechanisms acting for the downward transport, the seafloor beneath this Arctic sector is hypothesized as an important sink of plastic debris.
INTRODUCTION
Growing evidence of the magnitude and impacts of marine plastic pol-lution has led to efforts to assess loading and distribution across the world’s oceans (1–3). The convergence zones of each of the five sub-tropical ocean gyres (SOGs) have been reported to act as accumulation zones of floating plastic debris. These accumulation zones are primarily due to the Ekman transport induced by the easterly wind flow in the tropics (approximately 0° to 30° latitude) and the westerly winds in the mid-latitudes (30° to 60° latitude), which pump surface water and floating debris to the centers of the ocean basins at around 30° latitude in each hemisphere (4–6). In addition, models predict potential plastic accumulation in semienclosed seas that support high human density (5), something recently demonstrated for the Mediterranean Sea (7).
Although human population north of 60° latitude is relatively low, an oceanic circulation model by van Sebille and co-workers predicts a plastic accumulation zone within the Arctic Polar Circle, specifically in the Barents Sea (6). This sector of the Arctic Ocean plays a key role in the global Thermohaline Circulation (THC) through the formation of deep water by cooling (8). As the THC actively advects warm surface water from low to high latitudes across the North Atlantic Ocean to the Arctic, it could collect buoyant plastic from highly populated latitudes,
leading to accumulation in the Greenland and Barents seas, where the landmasses, together with the polar ice cap, would constitute a dead end for the surface transport of floating debris.
Recent analyses of four ice cores collected across the Arctic Circle pointed to a considerable abundance of microplastics into the sea ice (9). In contrast, available measurements of plastic debris in the Arctic surface waters have shown low to moderate concentrations, with none finding evidence of the hypothesized floating plastic accumulation (2, 10, 11). However, the lack of an extensive survey of plastic loads in the Arctic Ocean precludes testing of the efficacy of the proposed mechanism of poleward transfers of floating plastic waste. Here, we an-alyze the magnitude, distribution, and sources of the plastic pollution on the surface waters of the Arctic Ocean based on the Tara Oceans 2013 circumpolar expedition. The abundance and nature of the net-collected plastic in 42 sites along the circumarctic track were analyzed in relation to the plastic that accumulated in the SOGs and the Mediterranean Sea, as well as to the pollution sources for each basin.
RESULTS AND DISCUSSION
Most of the surface ice-free waters in the Arctic Polar Circle were slight-ly polluted with plastic debris, with 37% of the surface net tows of the circumpolar track being free of plastic (accounting for items larger than 0.5 mm only and excluding fibers). However, plastic debris was abun-dant and widespread in the Greenland and Barents seas (Fig. 1). As reference, maximum concentrations of floating plastic measured in this sector of the Arctic Ocean were considerably lower than those in the subtropical accumulation zones, but the median values were similar, es-pecially in units of number of items (Table 1). The total load of floating plastic for the ice-free waters of the Arctic Ocean was estimated to range from around 100 to 1200 tons, with 400 tons composed of an estimated 300 billion (1011) plastic items as a midrange estimate. This wide range must be considered as a preliminary first-order approximation, requir-ing an increased samplrequir-ing resolution to reduce the confidence interval
1Departamento de Biología, Facultad de Ciencias del Mar y Ambientales, Universidad
de Cádiz, Campus de Excelencia Internacional del Mar, E-11510 Puerto Real, Spain.
2King Abdullah University of Science and Technology, Red Sea Research Center,
Thuwal 23955-6900, Saudi Arabia.3Arctic Research Centre, Department of Bioscience,
Aarhus University, C.F. Møllers Allé 8, DK-8000 Århus C, Denmark.4Grantham Institute and Department of Physics, Imperial College London, London, U.K.5Institute for Marine and Atmospheric Research, Utrecht University, 3584 CC Utrecht, Netherlands.6Lake Basin
Action Network, Moriyama 524-0063, Japan.7John A. Paulson School of Engineering and
Applied Sciences, Harvard University, Cambridge, MA 02138, USA.8Instituto de Física Inter-disciplinar y Sistemas Complejos (CSIC-UIB), E-07122 Palma de Mallorca, Spain.9Sorbonne
Universités, UPMC Universitè Paris 06, CNRS UMR 7076, Laboratoire d’oceanographie de Villefranche, Villefranque-sur-mer, France.10Tara Expéditions, 75004 Paris, France.
11AZTI–Marine Research, Herrera Kaia, Portualdea z/g, 20110 Pasaia (Gipuzkoa), Spain. 12IKERBASQUE, Basque Foundation for Science, Bilbao, Spain.
*Corresponding author. Email: andres.cozar@uca.es
on April 24, 2017
http://advances.sciencemag.org/
associated with the variability in the spatial concentrations of plastic and the effect of the wind-induced vertical mixing. Nevertheless, the macro-scale pattern along the circumpolar track was highly consistent, with 95% of the plastic load estimated for the Arctic being confined in the Greenland and Barents seas. Hence, the Northeastern Atlantic sector of the Arctic Ocean can be characterized as the single, dominant high-accumulation zone for floating plastic debris, confirming in 2013 the long-term predictions provided by ocean circulation models (6).
Compared with other accumulation zones of floating debris (Fig. 2), the Arctic Ocean showed the lowest relative abundances for plastic sizes
larger than 12.6 mm, whereas the highest proportion of large plastic de-bris was found in the Mediterranean Sea, resulting in significant differ-ences between these two plastic size distributions (c2test, P < 0.01; no statistically significant differences were found between the Arctic and SOGs). The typology of plastic items in the Arctic was also similar to that found for the SOGs and diverged from the plastic composition in the Mediterranean Sea, which had a higher proportion of film-type plastic. These results support the hypothesis that a significant fraction of the plastic accumulation in the Arctic came from distant sources. Assuming that photodegradation and fragmentation of floating plastic
Fig. 1. Environmental conditions and concentrations of floating plastic debris in the Arctic Ocean. (A) At-sea vessel density. (B) Human population and Arctic sea ice extent. Annual minimum and maximum ice extents correspond to the monthly mean of September and March, respectively. Historic data account for the 1981 to 2010 median. (C) Remote-sensed sea surface salinity for August 2013 at the mid-sampling period. The seasonal cycle is shown in fig. S1. psu, practical salinity units. (D) Locations and plastic concentrations of the sites sampled. The summer extension of the polar ice cap in August 2013 is shown in white area, and the classical schematic drawing of the North Atlantic SOG and the THC poleward branch is indicated by green curves (8). The northern passage from Barents Sea to Kara Sea is zoomed in, with contour lines describing salinity measured at a depth of 5 m. (E) Plastic concentrations as total weight (upper graph) and abundances per plastic type (lower graph) along the circumpolar track, from the Greenland Sea to the Labrador Sea, as indicated in the left map by the black line connecting the sampling sites. Salinity at depths of 5 and 20 m is also shown in the upper graph, and two dashed lines are used as reference for 34.5 salinity and the median of plastic concentrations measured in the inner accumulation zones of SOGs [175 g·km−2(2)]. The correlation between plastic and salinity is shown in fig. S2. Note that the plastic fibers, presented in the lower graph as a dotted line, were excluded from all our analyses, including total plastic concentrations and load estimates in both weight and number. The Arctic Polar Circle (66.34°N) is marked in all maps.
on April 24, 2017
http://advances.sciencemag.org/
Table 1. Range of floating plastic concentrations in the Arctic compared to accumulation and nonaccumulation zones in tropical and temperate oceans. The minimum, median, and maximum concentrations in number and weight are shown separately for the Greenland and Barents seas (the Arctic sector from 35°W to 74°E longitude) and the rest of the Arctic Ocean. Plastic concentrations in the inner accumulation zone of the SOGs and tropical/temperate nonaccumualation zones were obtained from a previous global report (2). The total number of samples for each zone (n) is also shown.
×103items·km−2 g·km−2
n
Min Median Max Min Median Max
Greenland and Barents seas 0 6.3 × 101 3.2 × 10² 0 6.5 × 101 4.6 × 10² 17
Rest of the Arctic Ocean 0 0 2.7 × 101 0 0 5.1 × 101 21
Subtropical accumulation zones 0 4.4 × 101 1.3 × 10³ 0 1.8 × 10² 6.8 × 10³ 275 Tropical/temperate nonaccumulation zones 0 1.9 × 100 1.9 × 10² 0 3.6 × 100 3.4 × 10² 629
Fig. 2. Typology and size distribution of the floating plastic debris collected in the Arctic Ocean compared to the plastic accumulation zones in the SOGs and the Mediterranean Sea. In the pie charts, the percentages of plastic types are shown in relation to weight (charts showing the number of items and surface area are presented in fig. S3). The size distributions are presented in the lower graph. Horizontal axes indicate both log-transformed and nontransformed size limits of the bins. Plastics in the interval from 0.32 to 0.50 mm are graphed using open circles because these abundances are possibly underestimated for the Arctic due to the sampling net with combined 0.5- and 0.33-mm meshes for the body and cod end, respectively. Sample collections for the SOGs (4173 items) and the Mediterranean (3854 items) are described in previous reports (2, 7). The total number of items used for the analyses in the Arctic was 796; absolute abundances for each size bin are provided in table S1. The number of large items (>12.6 mm) in relation to the total was 2.1% (17 items), 3.2% (134 items), and 4.4% (170 items) for the Arctic Ocean, the SOGs, and the Mediterranean Sea, respectively.
on April 24, 2017
http://advances.sciencemag.org/
debris are directly related to exposure time in the environment, the paucity of large-sized plastic in the Arctic waters in relation to the Mediterranean Sea (with the shortest pathway to the coastal areas of release) is indicative of a low proportion of recently introduced plastic objects. However, we must note that the shape of the uppermost part of the plastic size distribution is the most poorly determined because of the low abundance of large items (2 to 5% of the total; Fig. 2). In addition, other reasonable hypotheses, such as an accelerated frag-mentation by the cycles of freezing and melting at high latitudes, could explain the relative scarcity of large items. The relatively low percent-age of film-type plastic debris in the Arctic Ocean also suggests that an important fraction of the Arctic plastic pollution is aged debris that is released from distant sources. Film-type plastics may undergo a faster removal from the ocean surface than other plastic types because its higher surface-to-volume ratio favors ballasting by epiphytic growth and subsequent sinking (12).
The number of persons living near the coastline normalized by the marine surface area was extremely low for the Arctic Ocean, being out of the range estimated for the rest of the world’s ocean basins (Table 2). The density of vessels per marine surface area was within the global range, albeit relatively low, with lower values being observed only in the South Pacific. The paucity of land-based population into the Arctic Circle resulted in a ratio of marine surface plastic to coastal inhabitant of 3.4 × 10²g per person for the Arctic, whereas these ratios were on the order of 101or 100g of plastic per person for all other ocean basins. The ratio of surface plastic to vessel density fell into the global range, with values into the upper range despite the expected low contribution of the land-based inputs to the surface plastic load (Table 2). The surface plastic–to–coastal inhabitant and surface plastic–to–vessel density ra-tios calculated separately for the Northeastern Atlantic sector of the Arctic (Greenland and Barents seas) were even higher (3.6 × 10²g per person and 3.5 × 10³g per vessel, respectively), stressing the hy-pothesis that much of the plastic in the Arctic is likely to derive from distant sources.
On the basis of the world ratios of vessels per coastal inhabitant, we can state that the sea-based sources of pollution in the Arctic region must be particularly relevant in relation to the land-based sources (Table 2). The reduction of Arctic sea ice due to climate change opens up access to new shipping routes and resources, which has increased the shipping activity in the Arctic waters during the last decade (13). How-ever, there was no spatial correspondence between surface plastic con-centrations and on-site vessel presence in the Arctic Ocean (R = 0.05, P = 0.74, n = 42), mainly because the maritime traffic was alongside the Eurasian continental shelf, whereas the highest plastic concentrations were further north in the Greenland and Barents seas, with waters vir-tually unpolluted beyond the Barents Sea (Fig. 1, A and D). On the other hand, the Greenland and Barents seas are the main entrance routes of vessels to the Arctic Ocean, matching the sector with the highest plastic concentrations. However, to date, the spatial density of vessels in Arctic waters has not been particularly high in comparison to other regions of the ocean, and there is no reason to think that the plastic dumping rates per vessel are higher in the Arctic. The shipping activity in the Arctic is particularly dominated by fishing vessels, which account for 34% of the total in contrast to 2 and 4% of the Mediterranean Sea and other oceans, respectively (14). However, fishing lines were not especially abundant in the Arctic samples compared with other regions (Fig. 2). If we assume the percentage of fishing lines as a proxy for the relative weight of the inputs associated to Arctic vessel activity, the results would not suggest a special contribution from this local source to the surface plastic load.
The oceanic route followed by the plastic reaching the Arctic surface waters has the North Atlantic Ocean as its recent (1 to 3 years) origin (Fig. 3). Buoyant particle transport models predict drifting plastic debris entering the Arctic Ocean through the passage between Scotland and Iceland, along the pathway typically described for the Atlantic branch of the THC (8). The branch of Atlantic water flowing to the north of the Scotland-Iceland passage bifurcates to reach the Greenland and Barents seas (15, 16). Accordingly, we found increasing plastic concentrations northward in the Greenland Sea, and particularly high concentrations near the St. Anna Trough, in the northeastern edge of the Barents Sea, a zone where important formation of deep water has been reported (17). The surface layer of Atlantic water cools as it flows northward, be-coming progressively denser to finally move downward, which likely implies the release of buoyant plastic load and its buildup toward the northernmost borders of the Greenland and Barents seas.
The Novaya Zemlya islands (dividing the Barents and Kara seas), together with the ice sheet, impose a frontier for further transport of floating plastic debris toward the interior Arctic Ocean. However, the intense summer reduction in sea ice coverage over recent years has re-sulted in wide openings of the northern passage to the Kara Sea, as happened during our survey of summer 2013 (Fig. 1B). The sampling resolution was increased in this zone, where we found the highest plastic concentrations, followed by a marked decline coincident with a decline in water salinity (Fig. 1, C to E). Floating plastic pollution increased northward up to the 34.5 isohaline and was practically absent from areas with salinity below 33.5 (fig. S2). The freshwater surface layer released from the ice melt blocked up the surface advance of the polluted Atlan-tic water. Floating plasAtlan-tic debris seems to be left afloat as the incoming branch of saline Atlantic water is forced to subduct below the front of the plastic-depleted freshwater layer. In addition, depending on the difference in density between the plastic items and the freshwater layer, a fraction of the plastics floating in the denser Atlantic waters could sink to the bottom or be placed at mid-depths in the pycnocline when they cross the Atlantic-Arctic front. In any case, the Northeastern Atlantic Table 2. Ratios of surface plastic load to local pollution sources in the
Arctic and other ocean basins. Land-based pollution sources (L) were esti-mated from a population in a 50-km coastal strip, and sea-based pollution sources (S) were estimated from at-sea vessel density. Surface plastic loads (P) were obtained from the present work and previous reports (2, 7). L and S are expressed in persons or vessels per square kilometer of ice-free waters, respectively. S:L ratios are expressed in vessels per person, P:L ratios are expressed in grams of plastic per person, and P:S ratios are expressed in grams of plastic per vessel. Global estimates do not include the Southern Ocean because of the lack of plastic pollution data for that basin.
L S S:L P:L P:S Arctic 1.5 × 10⁻¹ 1.7 × 10⁻² 1.1 × 10⁻¹ 3.4 × 10² 3.1 × 10³ Mediterranean 7.6 × 101 3.1 × 10⁻¹ 4.1 × 10⁻³ 5.5 × 100 1.3 × 10³ North Atlantic 8.8 × 100 6.7 × 10⁻² 7.6 × 10⁻³ 6.9 × 100 9.1 × 10² North Pacific 9.6 × 100 4.7 × 10⁻² 4.9 × 10⁻³ 6.6 × 100 1.3 × 10³ Indian 7.6 × 100 3.2 × 10⁻² 4.2 × 10⁻³ 4.0 × 100 9.5 × 10² South Atlantic 2.4 × 100 1.8 × 10⁻² 7.4 × 10⁻³ 2.6 × 101 3.5 × 10³ South Pacific 9.4 × 10⁻¹ 7.1 × 10⁻³ 7.5 × 10⁻³ 2.7 × 101 3.6 × 10³ Global 6.2 × 100 3.4 × 10⁻² 5.5 × 10⁻³ 7.8 × 100 1.4 × 10³ on April 24, 2017 http://advances.sciencemag.org/ Downloaded from
sector of the Arctic Ocean appeared as a dead end for the surface transport of plastic pollution.
Significant transport of plastic debris into the Arctic Ocean by the THC, in addition to the inputs associated to the increasing human ac-tivity in the region, is the most parsimonious explanation for the high plastic loads in the Northeastern Atlantic sector of the Arctic and the high ratios of plastic to local pollution sources, consistent with the size and typology of the plastic found. The floating plastic imported into the Arctic Ocean could be supplied from the maritime routes alongside the Norwegian coast or from the North Sea, but also from more distant re-gions (Fig. 3). The subsurface waters along the Scotland-Iceland transect, identified here as a major gateway for the delivery of Atlantic plastic to the Arctic, has been sampled since 1960 (18). Microplastics in these oceanic samples were more abundant than in the coastal waters near Scotland. Moreover, historic analysis reveals a significant rise and stea-dying of the microplastic abundance from 1980s, tracking the trend of plastic concentrations reported for the North Atlantic SOG (1). It is likely that plastic debris is released from the North Atlantic SOG and the west coast of North America, with a fraction of this ferried toward the Arctic Ocean between Scotland and Iceland (Fig. 3). Plastic
release from the subtropical plastic accumulation zones due to eddy mixing and other mesoscale processes is supported by hydrodynamic modeling of the spread of persistent buoyant particles across the ocean (5, 6). The plastic loads transported poleward with North Atlantic may be supplemented with inputs from the busy shipping lanes between North America and Europe. Using the Hybrid Coordinate Ocean Model (HYCOM), the mean net flow of surface water (depth, 1 m) through the Scotland-Iceland passage is estimated to be 0.06 sverdrup for the last decade (19). Assuming a moderate surface plastic concen-tration of 10mg·m−3(10 g·km−2), 100 tons of plastic debris would be transported through this route in 5 years, which would be an important contribution for the formation of a plastic accumulation zone in the Arctic Ocean.
The ocean circulation models predicted that the formation of a plastic accumulation zone within the Arctic Polar Circle would require a few decades (6). Our survey found an important plastic accumulation in the Arctic in 2013, although this accumulation is certainly smaller than that reported for the SOGs or the Mediterranean. On the basis of plastic loads estimated from comparable scale-up methods for other seas and oceans [excluding the Southern Ocean (2, 7)], the amount of
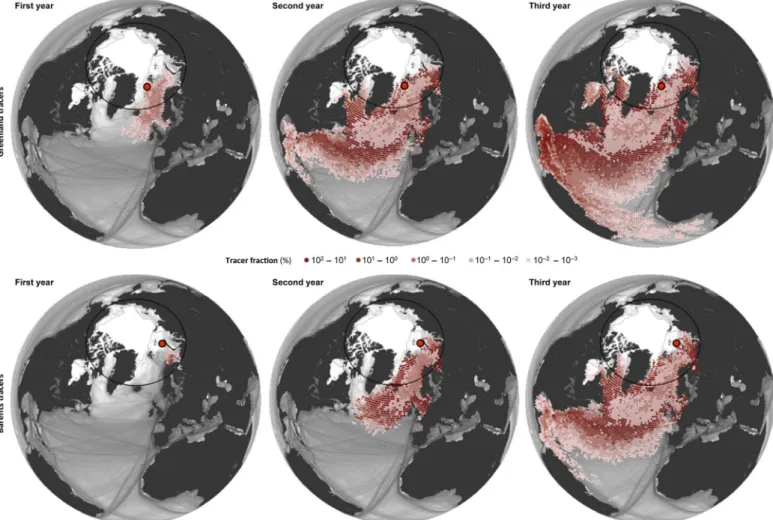
Fig. 3. Oceanic pathway of the plastic accumulations in the Greenland Sea (upper maps) and the Barents Sea (lower maps) obtained by simulations backward in time. Tracers were released at the locations of maximal plastic concentrations in Greenland and Barents seas (red circles), and their surface transport was modeled for the previous years (1 to 3 years). Units are expressed as percentage of tracers in each pixel. The background image for the ocean shows the vessel density in gray scale. Note the close agreement between the modeled plastic pathway and the THC route described in the literature (Fig. 1). Likewise, the tracers released in the Northeastern Barents Sea were placed 1 year before into a zone where high plastic concentrations were also measured.
on April 24, 2017
http://advances.sciencemag.org/
floating plastic that accumulated in the Arctic accounts for less than 3% of global standing stock. Nevertheless, it is likely that Arctic plastic loads continue to increase even after plastic inputs into the ocean are discon-tinued because this accumulation partly feeds from the plastic adrift at lower latitudes. Moreover, because of the limited surface transport of the plastic entrapped in the Northeastern Atlantic sector of the Arctic and because the surface layer is not the ultimate fate for the floating plastic (7, 12), we hypothesize that an important plastic transference to the ocean interior and floor should be occurring in this sector, especially in the northernmost and easternmost areas of the Greenland and Barents seas.
The present data demonstrate that high concentrations of plastic de-bris extend up to remote Arctic waters, emphasizing the global scale of marine plastic pollution and the role that global oceanic circulation patterns play in the redistribution of these persistent pollutants. The uniqueness of the Arctic ecosystem makes the potential ecological im-plications of exposure to plastic debris of special concern. Plastic inges-tion by northern fulmars (Fulmarus glacialis) from the Svalbard Islands, between the Greenland and Barents seas, has already been reported to exceed the recommendations for an acceptable ecological status (20). The trophic concentration of microplastics has been demonstrated for fur seals in the southwest Pacific Ocean, with an estimated biocon-centration factor of plastic particles from fish to seals ranging from 22 to 160 times (21). On the other hand, the significance of the transfer of plastic-associated pollutants to organisms through ingestion is still un-der discussion (22–24). Either way, the possibility that plastic pollution affects the Arctic food web is worthy of further consideration. The growing level of human activity in an increasingly warm and ice-free Arctic, with wider open areas available for the spread of microplastics, suggests that high loads of marine plastic pollution may become prev-alent in the Arctic in the future.
MATERIALS AND METHODS
Floating plastic debris were sampled onboard the R/V Tara from June to October 2013 during the Arctic circumpolar leg of Tara Oceans (http:// oceans.taraexpeditions.org). From the Greenland Sea, the expedition circumnavigated the Arctic Ocean to the Labrador Sea. All samples were collected from 60° to 80° latitude north. Two additional sites sampled over 60° in the Labrador Sea onboard Pakea Bizkaia in June 2011 were added to the data set (2). Overall, 42 sites were sampled with surface tows of manta nets across the seas of Greenland, Barents, Kara, Laptev, East Siberian, Chukchi, and Beaufort; the Canadian Archipelago; Baffin Bay; and the Labrador Sea. Salinity and temperature were measured with a portable profiler (CTD SBE19, Sea-Bird Electronics, Inc.) at depths of 0.5 and 20 m at each sampling site during the survey.
Samples of floating plastic debris were collected from surface tows navigating in a straight line at a duration of about 20 min, corresponding to an average distance of 1.7 ± 0.5 km, using a manta net submerged at 15 cm depth with a mouth opening 86 cm in width. The collection net (2.5 m long) used a 500-mm mesh and a 330-mm mesh for the cod end. Thus, a fraction (2%) of the plastic items collected by the net ranged from 330 to 500mm, although items smaller than 500 mm were likely underestimated in our samples. The small-sized material collected in each tow was resuspended in 20-mm-filtered seawater, and floating plastic debris was carefully picked from the water surface with the aid of a dissecting stereomicroscope. This examination was repeated twice to ensure the detection of all of the smallest plastic particles. Plastic material extracted from each sample were washed with deionized water
and dried at room temperature before they were weighed. We aimed to minimize the risk of sample contamination with textile fibers by using a clean airflow cabinet during processing in the laboratory.
Size and typology of the plastic items
The size of the plastic items was measured under an optical microscope using the image-processing NIS-Elements software, whereas large plastic objects were measured from the image analysis of calibrated photographs. A total of 796 plastic items were measured and separated into 21 size classes according to their linear length (that is, longest caliper length) to build a size distribution. Size limits of the bins were set following a 0.1-log series of linear length, using progressively wider bins for classification of larger plastic sizes. The width of the upper-most bin (i = n) extended from 32 to 860 mm (the width of the net mouth) as a result of the particularly low abundance of large plastic items found in the Arctic. The size distribution was presented in relative density of plastic per size (Di) to be comparable to those reported for the SOGs and the Mediterranean Sea, with different sample sizes (2, 7). Thus, the abundance of plastic items of i (ai) was normalized by the width of the size class interval (wi) to render plastic counts independent of the bin width. These normalized abundances were divided by the sum of normalized abundances across the size interval studied (i = 1, 2,…, n; from 500 mm to 860 mm in this work) to obtain Di, being independent of the number of items used in the size distribution (
∑
ni¼1Di¼ 1) and dimensionless. Mathematically, this can be expressed asDi¼ ai=wi
∑
ni¼1ðai=wiÞ
Plastic items were also classified according to their shape and probable origin. We used five plastic type categories: raw industrial pellets and granules (likely derived from cosmetic and cleansing products), films (mostly derived from discarded bags and wrappings), foamed plastic, rig-id manufactured items or pieces of them (all termed“fragments”), and fishing lines (fig. S4). Thin fibers, likely being of a textile origin (2), were also separated and counted but were finally excluded from all our analysis because of the risk of sample contamination. The contribution of the dif-ferent plastic categories to total load was graphed in relation to relative abundances, surface area measured from image analysis, and weights. Samples of floating plastic debris collected in the SOGs and the Mediter-ranean during previous surveys (2, 7) were also processed for comparative purposes.
Spatial concentrations and estimates of total loading Plastic concentrations per water surface area (as items per square kilometer or grams per square kilometer) were calculated by dividing the total number or dry weight of plastics collected in each tow by the area towed, estimated as the product of the trawling distance (derived from the starting and ending coordinates) and the width of the net open-ing. On the basis of the wind speed measured during net trawling, plastic concentrations derived from tows carried out with an average friction ve-locity in water (u*) of >0.5 cm·s−1(62% of the tows) were adjusted following the method proposed by Kukulka et al. (25) to account for the effect of the wind stress on the vertical distribution of plastic debris. Wind-adjusted abundances were converted to mass concentrations using an empirical correlation based on simultaneous measurements of total weight and abundance of 609 worldwide tows (7). Concentrations of plastic, together with geographical coordinates and sampling dates, are reported in table S2.
on April 24, 2017
http://advances.sciencemag.org/
To provide a first assessment of the plastic load in the Arctic surface waters, the Arctic Polar Circle was divided into two more uniform sectors in relation to the plastic pollution: a highly polluted sector from the 35° meridian of west longitude to the 74° meridian of east longitude (Greenland and Barents seas; including 17 net tows) and a less-polluted sector accounting for the rest of the Arctic Circle (including 21 net tows). This partition aims at decreasing the SD of the regional averages because of the macroscale variability in the plastic pollution pattern of the Arctic, reducing errors in the total load estimates. Midrange regional concentrations were calculated from the average of the wind-adjusted plastic concentrations within each sector. High-range concentrations were calculated from the 90th percentile of the wind-adjusted concen-trations, and low-range concentrations were calculated from the average of concentrations uncorrected for mixing by wind. The surface plastic load for the Arctic Ocean was estimated from the high, mid, and low concentrations per sector, multiplied by the corresponding spatial area of each sector. The wide confidence interval used for the load estimate aims to address variability and possible inaccuracies in the spatial con-centrations of plastic as well as the limitations of the available models to account for the effect of the wind stress on the vertical distribution of plastic (26). Spatial areas of the sectors were calculated for ice-free water in August 2013 (mid-sampling period) and northward of the Arctic Circle, at 66.34° latitude, in agreement with the northern latitudinal bor-der used for the Pacific and Atlantic oceans in the plastic pollution as-sessment of a previous work (2).
Sources of plastic pollution
Ratios of surface plastic load to local pollution sources for the Arctic Ocean and other world basins were used to examine the relevance of in situ sources on the surface plastic loads. For the North and South Atlantic, North and South Pacific, Indian, and Mediterranean, we used the surface plastic loads previously estimated from methods similar to those applied here for the Arctic (2, 7). Coastal population and density of vessels in each basin were used as proxies for the magnitude of the pollution sources, deriving independent ratios for land- and sea-based sources, respectively. Population was estimated from gridded global population data from the 2008 LandScan data set (http://web.ornl. gov/sci/landscan/datasets/LS2008.ris) for a 50-km coastal strip, as defined using the Natural Earth Coastline data (www.naturalearthdata. com/downloads/10m-physical-vectors/10m-coastline). The presence of vessels at sea was measured as the monthly unique occurrences averaged for the full-year 2014 in a global quarter-degree grid, as reported by the Automated Identification System (AIS) and provided by exactEarth (14). The international regulation only requires AIS to be fitted aboard vessels equal to or higher than 300 tons of gross tonnage and all passenger vessels regardless of size (International Maritime Organization; revised chapter V of Regulation 19 of SOLAS, Convention for the Safety of Life at Sea). The European Community also implemented the AIS require-ment for any fishing vessel with an overall length of more than 15 m, flying the flag of a member state and registered in the community, or operating in the internal waters or territorial sea of a member state (Article 6 of Directive 2009/17/EC).
Ocean surface circulation, sea salinity, and ice extent The oceanic pathways followed by the floating debris found in the Arc-tic were explored using a surface transport model based on data from the Global Drifter Program (27). Using satellite observations provided by the National Snow and Ice Data Center (NSIDC; http://www.nsidc.org) and the Aquarius Mission (http://aquarius.umaine.edu; NASA and
Space Agency of Argentina), we analyzed the extent of the Arctic ice cap and the spatial distribution of sea surface salinity to infer boundaries for the patterns of surface circulation.
SUPPLEMENTARY MATERIALS
Supplementary material for this article is available at http://advances.sciencemag.org/cgi/ content/full/3/4/e1600582/DC1
Supplementary Text
fig. S1. Seasonal cycle of ocean surface salinities for 2013 provided by the Aquarius Mission (NASA and Space Agency of Argentina; http://aquarius.umaine.edu).
fig. S2. Relationship between salinity (depths, 5 and 20 m) and surface plastic debris measured in the present study.
fig. S3. Pie charts in number of items (upper) and surface area (lower) of the plastic types found in the Mediterranean Sea (left), SOGs (center), and Arctic Ocean (right).
fig. S4. Images of different categories of microplastics found in the Arctic Ocean. fig. S5. Relationship between the estimates of total surface plastic load [(2, 7); this work], coastal population, and presence of vessels per great basins: Arctic, Mediterranean (Med), North Atlantic (N Atl), South Atlantic (S Atl), North Pacific (N Pac), South Pacific (S Pac), and Indian Ocean.
table S1. Size distribution of floating plastic debris collected for the present study. table S2. Number of items per tow (fibers, nonfibers, and total items) and concentrations in abundance and weight per square kilometer (excluding fibers).
References (28, 29)
REFERENCES AND NOTES
1. K. L. Law, S. Morét-Ferguson, N. A. Maximenko, G. Proskurowski, E. E. Peacock, J. Hafner, C. M. Reddy, Plastic accumulation in the North Atlantic subtropical gyre. Science 329, 1185–1188 (2010).
2. A. Cózar, F. Echevarría, J. I. González-Gordillo, X. Irigoien, B. Úbeda, S. Hernández-León, Á. T. Palma, S. Navarro, J. García-de-Lomas, A. Ruiz, Plastic debris in the open ocean. Proc. Natl. Acad. Sci. U.S.A. 111, 10239–10244 (2014).
3. M. Eriksen, L. C. M. Lebreton, H. S. Carson, M. Thiel, C. J. Moore, J. C. Borerro, F. Galgani, P. G. Ryan, J. Reisser, Plastic pollution in the World’s oceans: More than 5 trillion plastic pieces weighing over 250,000 tons afloat at sea. PLOS ONE 9, e111913 (2014). 4. N. Maximenko, J. Hafner, P. Niiler, Pathways of marine debris derived from trajectories of
Lagrangian drifters. Mar. Pollut. Bull. 65, 51–62 (2012).
5. L. C.-M. Lebreton, S. D. Greer, J. C. Borrero, Numerical modelling of floating debris in the world’s oceans. Mar. Pollut. Bull. 64, 653–661 (2012).
6. E. van Sebille, M. H. England, G. Froyland, Origin, dynamics and evolution of ocean garbage patches from observed surface drifters. Environ. Res. Lett. 7, e044040 (2012). 7. A. Cózar, M. Sanz-Martín, E. Martí, J. I. González-Gordillo, B. Ubeda, J. Á. Gálvez, X. Irigoien,
C. M. Duarte, Plastic accumulation in the Mediterranean sea. PLOS ONE 10, e0121762 (2015).
8. T. Kuhlbrodt, A. Griesel, M. Montoya, A. Levermann, M. Hofmann, S. Rahmstorf, On the driving processes of the Atlantic meridional overturning circulation. Rev. Geophys. 45, RG2001 (2007).
9. R. W. Obbard, S. Sadri, Y. Q. Wong, A. A. Khitun, I. Baker, R. C. Thompson, Global warming releases microplastic legacy frozen in Arctic Sea ice. Earth’s Future 2, 315–320 (2014). 10. A. L. Lusher, V. Tirelli, I. O’Connor, R. Officer, Microplastics in Arctic polar waters:
The first reported values of particles in surface and sub-surface samples. Sci. Rep. 5, 14947 (2015).
11. M. Bergmann, N. Sandhop, I. Schewe, D. D’Hert, Observations of floating anthropogenic litter in the Barents Sea and Fram Strait, Arctic. Polar Biol. 39, 553–560 (2016). 12. P. G. Ryan, Does size and buoyancy affect the long-distance transport of floating debris?
Environ. Res. Lett. 10, e084019 (2015).
13. V. M. Eguíluz, J. Fernández-Gracia, X. Irigoien, C. M. Duarte, A quantitative assessment of Arctic shipping in 2010–2014. Sci. Rep. 6, 30682 (2016).
14. exactEarth Ltd.,“ExactAIS Archive” (exactEarth Ltd., 2015); www.exactearth.com. 15. B. Rudels, Arctic Ocean circulation, processes and water masses: A description of
observations and ideas with focus on the period prior to the international polar year 2007–2009. Prog. Oceanogr. 132, 22–67 (2015).
16. K. A. Orvik, P. Niiler, Major pathways of Atlantic water in the northern North Atlantic and Nordic seas toward Arctic. Geophys. Res. Lett. 29, 2-1–2-4 (2002).
17. V. S. Lien, A. G. Trofimov, Formation of Barents Sea branch water in the north-eastern Barents Sea. Polar Res. 32, e18905 (2013).
18. R. C. Thompson, Y. Olsen, R. P. Mitchell, A. Davis, S. J. Rowland, A. W. G. John, D. McGonigle, A. E. Russell, Lost at sea: Where is all the plastic? Science 304, 838 (2004).
on April 24, 2017
http://advances.sciencemag.org/
19. E. P. Chassignet, L. T. Smith, G. R. Halliwell, R. Bleck, North Atlantic simulations with the Hybrid Coordinate Ocean Model (HYCOM): Impact of the vertical coordinate choice, reference density, and thermobaricity. J. Phys. Oceanogr. 33, 2504–2526 (2003). 20. A. M. Trevail, G. W. Gabrielsen, S. Kühn, J. A. Van Franeker, Elevated levels of ingested
plastic in a high Arctic seabird, the northern fulmar (Fulmarus glacialis). Polar Biol. 38, 975–981 (2015).
21. C. Eriksson, H. Burton, Origins and biological accumulation of small plastic particles in fur seals from Macquarie Island. Ambio 32, 380–384 (2003).
22. D. Herzke, T. Anker-Nilssen, T. H. Nøst, A. Götsch, S. Christensen-Dalsgaard, M. Langset, K. Fangel, A. A. Koelmans, Negligible impact of ingested microplastics on tissue concentrations of persistent organic pollutants in northern fulmars off coastal Norway. Environ. Sci. Technol. 50, 1924–1933 (2016).
23. R. Lenz, K. Enders, T. G. Nielsen Microplastic exposure studies should be environmentally realistic. Proc. Natl. Acad. Sci. U.S.A. 113, E4121–E4122 (2016).
24. C. M. Rochman, in Hazardous Chemicals Associated with Plastics in the Marine Environment, H. Takada, H. K. Karapanagioti, Eds. (Springer International Publishing, 2016). 25. T. Kukulka, G. Proskurowski, S. Morét-Ferguson, D. W. Meyer, K. L. Law, The effect of wind
mixing on the vertical distribution of buoyant plastic debris. Geophys. Res. Lett. 39, L07601 (2012).
26. K. Brunner, T. Kukulka, G. Proskurowski, K. L. Law, Passive buoyant tracers in the ocean surface boundary layer: 2. Observations and simulations of microplastic marine debris. J. Geophys. Res. Oceans 120, 7559–7573 (2015).
27. E. van Sebille, Adrift.org.au—A free, quick and easy tool to quantitatively study planktonic surface drift in the global ocean. J. Exp. Mar. Biol. Ecol. 461, 317–322 (2014). 28. J. R. Jambeck, R. Geyer, C. Wilcox, T. R. Siegler, M. Perryman, A. Andrady, R. Narayan,
K. L. Law, Plastic waste inputs from land into the ocean. Science 347, 768–771 (2015). 29. P. G. Ryan, S. Musker, A. Rink, Low densities of drifting litter in the African sector of the
Southern Ocean. Mar. Pollut. Bull. 89, 16–19 (2014).
Acknowledgments: This study is the outcome of collaborative research between two global research programs Tara Oceans and Malaspina. We thank J. Fernández-García, L. Stemmann, J. B. Cohuet, M. Picheral, S. Pesant, and the captain and crew of R/V Tara for help with the sample collection and data analysis; the NSIDC, the Aquarius Mission (NASA and Space Agency of Argentina), MERCATOR-CORIOLIS, and ACRI-ST for providing satellite information; the National Ocean Partnership Program, the Office of Naval Research, the U.S. Navy, and the U.S. Department of Defense High Performance Computing Modernization Program for developing the HYCOM and making the output publicly available; Natural Earth for the coastline data; and UT-Battelle and the U.S. Department of Energy for providing the high-resolution global population data set. This last product was created using the LandScan 2008 High Resolution global Population Data Set copyrighted by UT-Battelle LLC, operator
of the Oak Ridge National Laboratory under contract no. DE-AC05-00OR22725 with the U.S. Department of Energy. The U.S. Government maintains certain rights to use of this data set. Neither UT-Battelle LLC nor the U.S. Department of Energy, nor any of their employees, makes any warranty, express or implied, or assumed any legal liability or responsibility for the accuracy, completeness, or usefulness of the data set. Funding: Tara Oceans particularly acknowledges the commitment of the following sponsors: the CNRS (in particular Groupement de Recherche GDR3280), the European Molecular Biology Laboratory, Genoscope/CEA, French Government“Investissements d’Avenir” programs OCEANOMICS (ANR-11-BTBR-0008) and FRANCE GENOMIQUE (ANR-10-INBS-09-08), Agence Nationale de la Recherche, and European Union FP7 (Micro B3 no. 287589). We appreciate the support and commitment of agnès b. and E. Bourgois, Veolia Environment Foundation, Region Bretagne, Lorient Agglomeration, World Courier, Illumina, Eléctricité de France Foundation, Fondation pour la recherche sur la biodiversité, Prince Albert II de Monaco Foundation, Tara Foundation, its schooner, and its teams. We are also grateful to the French Ministry of Foreign Affairs for supporting the expedition and to the countries that granted sampling permissions. Tara Oceans would not exist without continuous support from 23 institutes (http://oceans.taraexpeditions.org/en/m/science/les-labos-impliques/). This article is contribution number 52 of Tara Oceans. This study is funded by Tara Oceans and the Malaspina 2010 Expedition project (Spanish Ministry of Economy and Competitiveness, CSD2008-00077) and has received additional support from the King Abdullah University of Science and Technology through baseline funding to X.I. and C.M.D., Campus de Excelencia Internacional del Mar (CEIMAR), and PLASTREND (BBVA Foundation) and MIDaS (CTM2016-77106-R, AEI/FEDER/UE) projects. Author contributions: R.T., M.L.P., and X.I. participated in the design and coordination of the field survey; A.C., E.M., C.M.D., J.G.-d.-L., E.v.S., T.J.B., V.M.E., J.I.G.-G., F.E., and X.I. analyzed the data; A.C. wrote the manuscript; all authors read and commented on the manuscript. Competing interests: The authors declare that they have no competing interests. Data and materials availability: All data needed to evaluate the conclusions in the paper are present in the paper and/or the Supplementary Materials. All of the samples, analyses, publications, and ownership of data are free from legal entanglement or restriction of any sort by the various nations whose waters the Tara Oceans expedition sampled in.
Submitted 18 March 2016 Accepted 31 March 2017 Published 19 April 2017 10.1126/sciadv.1600582
Citation:A. Cózar, E. Martí, C. M. Duarte, J. García-de-Lomas, E. van Sebille, T. J. Ballatore, V. M. Eguíluz, J. I. González-Gordillo, M. L. Pedrotti, F. Echevarría, R. Troublè, X. Irigoien, The Arctic Ocean as a dead end for floating plastics in the North Atlantic branch of the Thermohaline Circulation. Sci. Adv. 3, e1600582 (2017).
on April 24, 2017
http://advances.sciencemag.org/
doi: 10.1126/sciadv.1600582 2017, 3:.
Sci Adv
Echevarría, Romain Troublè and Xabier Irigoien (April 19, 2017) Eguíluz, J. Ignacio González-Gordillo, Maria L. Pedrotti, Fidel García-de-Lomas, Erik van Sebille, Thomas J. Ballatore, Victor M. Andrés Cózar, Elisa Martí, Carlos M. Duarte, Juan
this article is published is noted on the first page.
This article is publisher under a Creative Commons license. The specific license under which
article, including for commercial purposes, provided you give proper attribution.
licenses, you may freely distribute, adapt, or reuse the
CC BY
For articles published under
.
here
Association for the Advancement of Science (AAAS). You may request permission by clicking for non-commerical purposes. Commercial use requires prior permission from the American
licenses, you may distribute, adapt, or reuse the article
CC BY-NC
For articles published under
http://advances.sciencemag.org. (This information is current as of April 24, 2017): The following resources related to this article are available online at
http://advances.sciencemag.org/content/3/4/e1600582.full
online version of this article at:
including high-resolution figures, can be found in the Updated information and services,
http://advances.sciencemag.org/content/suppl/2017/04/17/3.4.e1600582.DC1
can be found at: Supporting Online Material
http://advances.sciencemag.org/content/3/4/e1600582#BIBL
5 of which you can access for free at: cites 27 articles,
This article
trademark of AAAS
otherwise. AAAS is the exclusive licensee. The title Science Advances is a registered York Avenue NW, Washington, DC 20005. Copyright is held by the Authors unless stated
New published by the American Association for the Advancement of Science (AAAS), 1200
(ISSN 2375-2548) publishes new articles weekly. The journal is Science Advances
on April 24, 2017
http://advances.sciencemag.org/