Dynamics of Water and Aqueous Protons studied using
Ultrafast Multi-dimensional Infrared Spectroscopy
by
Krupa Ramasesha
B.S. Chemistry
University of Wisconsin, Madison, 2006
Submitted to the Department of Chemistry
in partial fulfillment of the requirements for the degree of
Doctor of Philosophy
at the
MASSACHUSETTS INSTITUTE OF TECHNOLOGY
February 2013
© Massachusetts Institute of Technology 2013. All rights reserved.
Signature of Author: _
_t_._
_
_
_
Krupa Ramasesha Dpcember 17, 2012
Certified by:
Accepted by:
Andrei Tokm koff
Professor of Chemistry
Thesis Supervisor
Robert W. Field
Professor of Chemistry
Chairman, Department Committee on Graduate Theses
ARCHIVE.
MASSACHUSETTS INSTITUTEOF TECHNOLOGY
APR 1 1
2013
This doctoral thesis has been examined by a Committee of the Department
of Chemistry that included,
Professor Keith A. Nelson
Chair
Professor Troy Van Voorhis
Professor Andrei Tokmakoff
Thesis
pervisor
Dynamics of Water and Aqueous Protons studied using
Ultrafast Multi-dimensional Infrared Spectroscopy
by
Krupa Ramasesha
Submitted to the Department of Chemistry on December 17, 2012 in partial fulfillment of the requirements for the degree of
Doctor of Philosophy
Abstract:
Liquid water consists of a highly dynamic network of hydrogen bonds, which evolves on timescales ranging from tens of femtoseconds to a few picoseconds. The fast structural evolution of water's hydrogen bond network is at the heart of numerous fundamental aqueous processes, such as proton transport, solvation, the hydrophobic effect and protein folding. In this thesis, I present our efforts in understanding the dynamics governing hydrogen bond switching and vibrational energy dissipation in water, and the transport of excess protons in strong acid solutions. We use ultrafast nonlinear infrared spectroscopy to study hydrogen bond and proton transfer dynamics in water and acids since vibrational frequencies, intensities and line shapes are closely associated with chemical structure and dynamics. We employed and characterized a new source of ultrafast broadband infrared pulses that span the entire mid-infrared region from 4000 cm-1 down to hundreds of cm-I, with <70 fs pulse duration. We have demonstrated the use of these pulses in studying ultrafast vibrational dynamics in water and aqueous proton transfer dynamics in acids, where broad and feature-less vibrational transitions are present across the mid-infrared.
Rearrangements of the hydrogen bond network in liquid water involve rapid switching of hydrogen bonds, which is believed to be a concerted process where a water molecule undergoes large angle molecular reorientation as it exchanges hydrogen-bonding partners. To test this picture of hydrogen bond dynamics, we performed ultrafast 2D IR spectral anisotropy on the OH stretching vibration of HOD in D20 to directly track the reorientation of water molecules as they change hydrogen bonding environments. Interpretation of the experimental data is assisted by modeling drawn from molecular dynamics simulations, and we quantify the degree of molecular rotation on changing local hydrogen bonding environment within the framework of restricted rotation models. Our results show evidence for concerted motions involving large angular deviations in the molecular dipole when a water molecule evolves from a strained configuration to a stable hydrogen bonded geometry.
In addition to its rapidly evolving hydrogen bonding network, the ability of liquid water to efficiently dissipate energy through ultrafast vibrational relaxation processes plays a key role in the stabilization of reactive intermediates and the outcome of aqueous chemical reactions. The ability of liquid water to efficiently dissipate energy through
intermediates and the outcome of aqueous chemical reactions. The vibrational couplings that govern energy relaxation in liquid H20 remain difficult to characterize due to the
complex interplay of inter- and intramolecular forces present in the liquid and the limitations of current methods to visualize these ultrafast motions simultaneously. Using ultrafast broadband infrared pulses, we performed 2D IR spectroscopy, pump-probe
spectroscopy, and polarization anisotropy of H20 by exciting the OH stretchin transition
in water and characterizing the response of the liquid from 1350-4000 cm~ with <70 femtosecond time resolution. These spectra reveal vibrational transitions at all frequencies simultaneous to the excitation, including cross peaks to the bend vibration and a continuum of induced absorptions to previously unobserved combination bands that are not present in linear spectra. These observations provide evidence for strong mixing of inter- and intra-molecular character and delocalization of the vibrations in liquid H20.
Unlike traditional weak coupling models, it appears that excitation of OH stretch motion simultaneously drives bending and intermolecular motions as a result of strong anharmonic mixing. These delocalized vibrations, or excitons, have mixed stretch and bend character and evolve over several hundred femtoseconds, giving rise to a complex network of vibrational energy relaxation processes.
Protons are known to exhibit very high mobility in water compared to other ions due to the Grotthuss proton hopping mechanism, which describes proton transfer as a process where displacement of charge takes place through breaking and forming of O-H covalent bonds in water. Infrared spectra of strong acids are marked by broad and featureless transitions that span the entire mid-infrared due to a large distribution of rapidly exchanging solvated proton configurations. While previous research efforts have assigned different regions of the mid-infrared spectrum of acids to vibrations of the Eigen (H904*)
and the Zundel (H502+) limiting structures of the solvated proton, experimental evidence for these assignments in solution and the dynamics that underlie the broad transitions have been largely absent. Using ultrafast broadband infrared pulses in pump-probe and 2D IR spectroscopy, we studied the evolution of frequency correlations across the entire mid-infrared spectrum of concentrated HCl in H20. Our results provide experimental
evidence for the existence of Eigen and Zundel configurations of the solvated proton in HCl/H20 with persistence times of at least 0.8 to 1 ps and 250 fs, respectively, and show that fleeting excursions of the proton from the Eigen configuration towards shared configurations are stabilized in less than 100 fs by electric field fluctuations of the solvating water molecules.
Thesis Supervisor: Andrei Tokmakoff Title: Professor of Chemistry
To my parents...
Acknowledgements
I could not have asked for a better graduate school experience than the last six and a half years in the Tokmakoff group. As I sit here writing this final part of my thesis, I am
overwhelmed by nostalgia and a strong urge to hold on to my life here at MIT. I have
many people to thank for making my time here so memorable. It was during the summer
after my sophomore year as an undergraduate in UW-Madison when I heard Andrei
Tokmakoff speak at the CMDS conference there. It was very clear that the work in his
group was far too exciting to pass up and I instantly knew that I wanted to do graduate
research in his group. Now, many years later, I feel truly fortunate to have had Andrei as
my graduate research advisor. In addition to all the science that I have learnt from him,
his courage to pursue some of the toughest problems through high-risk experiments has
made the most impression on me. His optimism and support have been crucial in helping
me cope with frustrating days in lab, and have been instrumental in allowing me to see
some difficult experiments through. I am very grateful for his guidance and
encouragement throughout graduate school.
I would like to thank the past and present members of "Team Water", who have been extremely helpful over the last few years. Sean Roberts and Poul Petersen were
remarkable teachers, who patiently taught me the nuts and bolts of nonlinear infrared
spectroscopy and helped me learn the skills necessary to appease the Water Lab. Sean
also introduced me to molecular dynamics simulations, which was crucial for the analysis
of 2D IR anisotropy of water presented in Chapter 5 of this thesis, and Poul put together
the broadband IR generation scheme in our lab, which kick-started our most recent work
early anisotropy experiments. I admired her attention to detail and perfection, and she was always my go-to person for questions on water literature. Over the last couple of years, I have had the pleasure of working with Aritra Mandal and Luigi De Marco, who
have been instrumental in helping me set up broadband IR spectroscopy in the Water Lab. I have enjoyed discussing some cricket and Indian politics with Aritra over the years. Luigi and I work extremely well together, and I am thankful for all the lighthearted moments he has brought to some of the most frustrating days in lab.
Interacting with the protein folks has been both educative and very helpful. I would like to thank Adam Smith, Lauren DeFlores, Benjamin Dietzek, Ziad Ganim, Kevin Jones, Josh Lessing, Sam Peng, Mike Reppert, Paul Stevenson and Ann Fitzpatrick for all that they have taught me. Conversations with them have often led to a better understanding of my own project. They are wonderful people who have made working in the Tokmakoff group that much more memorable.
Thanks also go to friends from my year in the Chemistry department at MIT
-Johanna, Harold, Misha, Tony, Nate, Barratt, Jeremy, Kit, Brian, Hee-Sun, Lee-Ping, Elise and Eric, with whom I have enjoyed discussing science, sharing frustrations and simply hanging out. I would also like to thank my closest friends at MIT outside the Chemistry department - Arvind, Sowmya, Ganesh, Anuja, Karthik, Murali, Aruna and
Anna, for making my time at MIT so wonderful.
My parents are the reason I have made it this far. Being academics themselves, they have always put education at the forefront. My father, Ramasesha, is by far the best teacher I know, which surely stems from his innate passion for science. He made learning math and science a lot of fun, and always emphasized deep understanding of concepts.
He is a wonderful person, a great teacher and a fantastic scientist - truly a role model. I
would consider myself lucky if I turned into half the academic that he is. My mother,
Sheela, was the first woman to graduate with a Ph.D. from the Department of Chemistry
at the Indian Institute of Science, during a time when women would rarely go to college.
Her perseverance in the face of enormous hurdles and set-backs that often accompany a
fundamental change in social mindset is a constant source of inspiration for me. It makes
me realize that if one has the drive and focus like she does, nothing can deter. I am
thankful for people like her who have opened doors for people like me. The courage,
grace and the resolute optimism that she exhibits is truly inspiring. I dedicate this thesis
to my parents for their unwavering support and encouragement, and for all that they have
given up in order to make sure that I am never short of opportunities. My husband,
Srihari, is my rock and source of inner peace. He has heroically stood by my side
throughout graduate school. He has helped me through the many testing days, and has
been the first to celebrate with me the occasional, but intense successes along the way.
His love and support have been invaluable in helping me get here, and I consider myself
extremely lucky to have him by my side. I am very grateful to my grandmothers, aunts
Shamala, Tara and Shobha, and uncles Mouli and Rajagopal, for all their support and
encouragement throughout my life. My closest cousins Mahesh, Prajit and Anand have
always placed a high standard for academic success, which has driven me to do well.
Table of Contents
List of Figures
1. Introduction
1.1 Water's unique properties
1.2 Probes of hydrogen bond dynamics in water
1.3 Vibrational relaxation in liquid H20
1.4 Aqueous proton transport in acids
1.5 Thesis outline References
2. Calculation of the third-order nonlinear response function
2.1 Introduction
2.2 Nonlinear response function
2.3 Approximations to the third-order response function 2.3.1 Condon approximation
2.3.2 Semiclassical approximation 2.3.3 Second cumulant approximation 2.4 Third-order nonlinear spectroscopy
2.4.1 Three pulse vibrational echo peak shift (PS) 2.4.2 Two-dimensional infrared spectroscopy (2D IR) 2.4.3 Pump-probe spectroscopy (PP) Acknowledgements
14
23 23 30 35 38 45 47 53 53 55 63 63 64 68 69 72 74 78 80References
3. A phenomenological approach to modeling chemical dynamics in nonlinear and two-dimensional spectroscopy
3.1 Introduction 3.2 Approach
3.2.1 Approximations to the response function 3.2.2 Trajectory construction
3.3 The non-Condon effect: Nonlinear IR spectroscopy of HOD/D20
3.4 Range of applicability of trajectory mapping method
3.4.1 Non-Gaussian dynamics: Spectroscopy of strong hydrogen bonds 3.4.2 Chemical exchange
3.5 Discussion and conclusions Acknowledgements
References
4. Generation and utilization of ultrafast mid-infrared pulses in nonlinear infrared spectroscopy
4.1. Introduction
4.2 Overview of experimental set-up
4.3 Generation and characterization of 45 fs 3 pLm pulses
80
83
83 86 86 90 93 98 98 104 106 108 109113
113 117 1204.4 Acquisition of 2D IR and pump-probe spectra in the pump-probe beam geometry 125
4.4.1 Data acquisition in the pump-probe geometry 125
4.4.3 Processing of raw 2D IR data
4.4.4 Extracting imaginary and phase 2D IR spectra
4.5 Polarization scheme for 2D IR anisotropy measurements 4.6 Summary
Acknowledgements
References
5. Ultrafast 2D IR Anisotropy of Water Reveals Reorientation during Hydrogen-Bond Switching
5.1 Introduction 5.2 Methods
5.2.1 Experimental
5.2.2 Simulations and modeling 5.3 Results and discussion
5.3.1 Pump-probe anisotropy of HOD/D20 5.3.2 2D IR anisotropy of HOD/D20 5.3.3 Comparison to MD simulations 5.4 Conclusions
Acknowledgements
References
5.A. Appendix: Time-evolving angular-frequency correlations in HOD/D20 from MD simulations
5.B. Appendix: Temperature-dependent pump-probe anisotropy of HOD/D20
137 138 142 143 143 45 145 148 148 151 152 152 158 168 176 177 178 182 188 134
6. Generation of ultrafast broadband infrared pulses and measurement
of broadband nonlinear spectra6.1 Introduction
6.2 Overview of the experimental set-up
6.3 Generation of BBIR pulses via filamentation in air 6.3.1 BBIR spectral and spatial characterizations 6.3.2 BBIR temporal characterization
6.3.3 BBIR polarization characterization 6.4 Spectroscopy with broadband infrared pulses
6.5 Conclusions Acknowledgements
References
7. Water vibrations have strongly mixed intra- and inter-molecular character
7.1 Introduction
7.2 Experimental methods 7.3 Results and discussion 7.4 Summary Acknowledgements References
189
189 193 197 205 209 212 213 221 223 223 227 227 229 233 245 246 2468. Fleeting excursions of protons in water give rise to the short-lived acid continuum and drive the exchange of Eigen and Zundel
configurations
8.1 Introduction
8.2 Experimental methods 8.3 Results and discussion 8.4 Conclusions
Acknowledgements
References
8.A. Appendix: Concentration dependence of third-order signal in HCl/H20
Curriculum Vitae
249
249 259 261 277 279 280 283285
List of Figures
Figure 1-1: Geometric definition of a hydrogen bond... 25 Figure 1-2: Correlation between OH and Roo and Wo and a (top), extracted from MD
simulations of SPC/E water. The infrared spectrum of HOD/D20 (bottom)... 31
Figure 1-3: Large angle reorientation of a water molecule about a hydrogen bond switching event from molecular dynamics simulations of SPC/E water. ... 34
Figure 1-4: Illustrations of the Zundel (H502*) and the Eigen (H904*) complexes of the
hydrated proton. ... 39
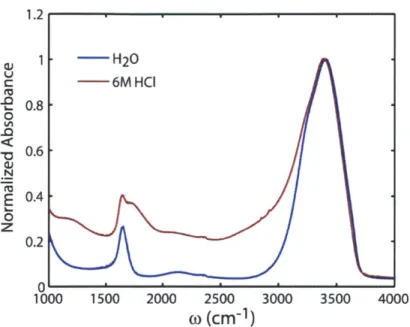
Figure 1-5: Linear infrared spectra of H20 (blue) and 6M HCl in H20 (red), normalized
to the peak maximum at 3400 cm'...44
Figure 2-1: Variation of the transition dipole (in Debye) of the v = 0 to 1 transition of the OH stretch in HOD/D20 with the fundamental OH stretching frequency (in cm-)...64
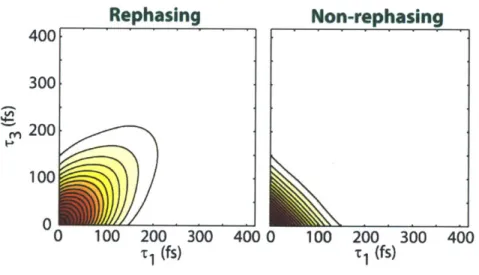
Figure 2-2: Rephasing (left) and non-rephasing (right) contributions as a function of t1
and T3 for a two-level system. The carrier frequency is neglected here, and the plot shows
only the time-domain envelope for the two contributions...71
Figure 2-3: The pulse sequence used in measuring the three-pulse vibrational echo for a waiting time T2. This is a homodyne measurement, where the third-order signal is not
interfered with a reference pulse, and hence lacks phase information...73
Figure 2-4: a) Three-pulse echo plotted as a function of T1 at different waiting times,
calculated for correlated frequency and dipole trajectories. b) Three pulse echo peak shift calculated from the data in a), by finding the peak of the echo and plotting it as a function of w aiting tim e... 74
Figure 2-5: Pulse sequence for 2D IR spectroscopy. The third-order signal is overlapped with the local oscillator (ELo) and the square of the sum of the signal and local oscillator is detected ... . . 75
Figure 2-6: Rephasing (left), non-rephasing (middle) and correlation (right) spectra of the OH stretch of HOD/D20 from MD simulations, calculated for t2 = 120 fs. Only the v = 0 and v = 1 vibrational states of the OH stretch were included in this calculation...76
Figure 2-7: Pulse sequence for pump-probe spectroscopy. Two interactions with Epump creates a population state that evolves during the waiting time. Eprobe interrogates the sample after T2, and acts to heterodyne the third-order signal, which can then be detected using a spectrometer or a single-channel detector...79
Figure 3-1: Procedure for calculating spectra using the trajectory mapping method...91 Figure 3-2: Comparison of the normalized three-pulse echo peak shift calculated from our model, which includes the non-Condon effect, with the normalized experimental peak shift measurement (top left) of HOD/D20. The correlation functions that went into the peak shift calculations, which gave us the best fit with experimental results for both the Condon and non-Condon response function calculations (top right). The corresponding 2D IR spectra of HOD/D20 with (bottom right) and without (bottom left) including the non-C ondon effect...97
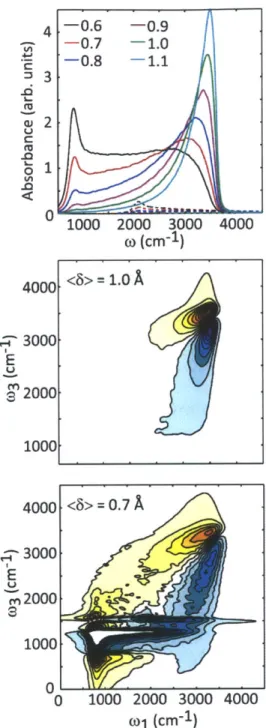
Figure 3-3: (Top) Linear IR spectrum of aqueous hydroxide for different values of (6) (in
A),
with constant distribution width of Y = 0.3A.
Below, 2D IR spectra of hydroxide for two (6) values of 1.0A
(middle) and 0.7A
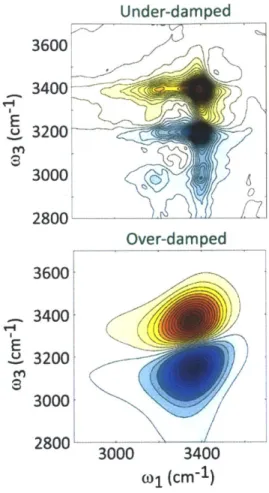
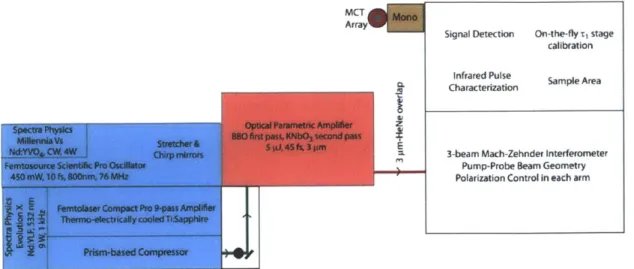
(bottom)...102 Figure 3-4: 2D IR spectra calculated for the under-damped (top) and over-damped (bottom) cases for the coupling of the OH stretch to the bath...104 Figure 3-5: Waiting time series of 2D IR spectra calculated from Langevin simulations show the evolution of the diagonal peaks from being inhomogeneously broadened to being symmetric, along with the growth of the cross peaks signifying chemical ex ch an ge ... 105Figure 4-1: Overview of the experimental set-up. Arrows represent the direction of beam propagation and the filled circle is a periscope...118
Figure 4-2: Spectra of the seed (red), the amplified 800 nm pulse (green) and the compressed laser output (blue), normalized to their maximum intensity...119
Figure 4-3: Tunability of the 3 ptm spectrum from the home-built BBO/KNbO3 OPA... .... ... 122 Figure 4-4: Second harmonic autocorrelation of the 3 pim pulses in AgGaS2. The x-axis displays the relative time delay between two 3 pm pulses...123
Figure 4-5: Transient grating FROG of the 3 pm pulses from the third-order non-resonant response of CaF2, dispersed on a MCT array detector...124
Figure 4-6: 2D IR spectroscopy in the box geometry (top) and in the pump-probe geometry (bottom). Subscripts a, b and c represent the three interactions of the sample with the infrared pulses... .... 127
Figure 4-7: Detailed diagram of the set-up for acquiring 2D IR spectra in the pump-probe geometry. All the mirrors in the set-up are protected gold plane mirrors. BS: 3 mm thick CaF2 beamsplitters; WP: k/2 MgF2 tilt waveplates, P: CaF2 wire-grid polarizers, S: sam ple, LO : local oscillator...130
Figure 4-8: Interferogram of the 3 pm pulses through a monochromator set at 3400 cm' (left). Fourier transform of the interferogram (right) shown in blue, while the red trace is the Gaussian fit to the transform to extract the center frequency...133
Figure 4-9: Projection of the 2D IR spectrum of HOD/D20 at T2 = 250 fs (red) onto the
(03 dimension compared to the dispersed pump probe spectrum of the same sample at 250
fs (blue). To match this pair of spectra, the error in timing Ati was found to be -2.2 fs...---... 134
Figure 4-10: a) Time-frequency (TI-o3) surface of HOD/D20 at t2 = 250 fs, upon
correcting for errors in t1 and subtracting the constant pump-probe offset (left). A slice at
time of the OH stretch in HOD/D20 of ~150 fs. b) The Fourier transformed (o1-o3) 2D IR spectrum at t2= 250 fs...136
Figure 4-11: The real (top left), imaginary (top right), absolute value (bottom left) and phase (bottom right) 2D IR spectra of HOD/D20 at T2= 250 fs...137
Figure 4-12: a) Beam diagram for 2D IR anisotropy measurements. b) Detection set-up for 2D IR anisotropy m easurem ents...139
Figure 4-13: Left: Absorptive (top) and absolute-value (bottom) 2D IR spectra of HOD in D20 at T2 = 250 fs, for ZZZZ and YYZZ polarizations. Right: Corresponding 2D IR
anisotropy calculated from real absorptive and power spectra are shown on the right... 142
Figure 5-1: (a) Raw ZZZZ and YYZZ dispersed pump-probe of HOD/D20 plotted against waiting time (T12), before TSGS correction; (b) 3400 cm-I slice of the ZZZZ and
YYZZ dispersed pump-probe, after correcting for TSGS. A three-point rolling average was performed for waiting times of <400 fs...154
Figure 5-2: Experimental (left) and simulated (right) normalized pump-probe anisotropy of HOD/D20 and the specified probe frequencies. Lower panel shows the amplitude of the inertial decay as a function of probe frequency...155
Figure 5-3: Cartoon of restricted rotation model (top left). Potential of mean force for the hard cone (blue) and the harmonic cone (red) models (top right). Average angles and two standard deviations of the half-cone angle calculated from the inertial decay of measured and simulated pump-probe anisotropy (bottom), based on harmonic cone analysis...157
Figure 5-4: 2D IR surfaces of HOD in D20 in the ZZZZ and YYZZ polarization
geometries, normalized to their maximum amplitudes, with linearly spaced contours. The ratio of the maximum amplitude of ZZZZ to ZZYY at 150 fs was 2.94...159
Figure 5-5: Absorptive (left) and power (right) 2D IR spectra of HOD in D20 at T2 = 250
anisotropy calculated from real absorptive (bottom left) and power (bottom right) sp ectra ... 16 0
Figure 5-6: 2D IR anisotropy spectra of HOD/D20 calculated from absorptive ZZZZ and YYZZ 2D IR spectra from (a) experiment and (b) simulations, at four different waiting tim es. ... 16 1
Figure 5-7: 2D IR anisotropy spectra for HOD in D20 from (a) experiment and (b) sim ulation, at various waiting tim es...162
Figure 5-8: (a) Experimental and (b) simulated waiting time behavior of the four quadrants of the 2D IR anisotropy calculated from 2D IR power spectra. ... 165
Figure 5-9: Average angular deviations extracted from oi = "red" and o, = "blue" slices of 2D IR anisotropy from experiment (left) and simulation (right), at U2=100 fs using the harmonic cone model. Average angles (top row) and two standard deviations (middle row) were calculated based on 2D IR anisotropy from power spectra. Average angles from 2D IR absorptive spectra are also shown (bottom row)...167
Figure 5-10: Comparison of different representations of 2D IR anisotropy from sim ulations at -12= 300 fs. ... 172
Figure 5-Al: Time-evolution of the mean reorientation angle of the OH bond as a function of o1 and os plotted for six characteristic waiting times t2. Angles are evaluated in degrees...183
Figure 5-A2: Time-evolution of the standard deviation in reorientation angle of the OH bond as a function of (o1 and o3. Angles are evaluated in degrees...184
Figure 5-A3: Time-evolution of the second Legendre polynomial orientational correlation function, P2, of the OH bond as a function of oi and 03. Here, P2 is multiplied by 0.4 to convert it into anisotropy units...186 Figure 5-Bi: Pump-probe anisotropy of HOD/D20 at different temperatures (left), calculated for the OH stretch fundamental. The decays were fit to a double exponential
plus offset, with long timescales (trot) showing the following temperature dependence: 5 OC - 7 ps; 13 OC - 5.3 ps; 22 oC - 3.7 ps; 50 oC - 3.2 ps; 72 oC - 1.6 ps. Arrhenius plot of the temperature dependence of trot (in picoseconds) (right), with error bars representing the standard deviation across three independent measurements...188 Figure 6-1: Typical spectra from OPAs (shown in purple) compared to the many vibrational features present in H20 (blue) and N-methylacetamide in dimethyl sulfoxide
(red )...19 1
Figure 6-2: Overview of the experimental set-up for measuring broadband nonlinear spectra. Arrows represent the direction of beam propagation and the bold circles are p eriscop es...194
Figure 6-3: Spectra (normalized to maximum intensity) of the 800 nm pulses at various stages in the laser are shown: after the Femtosource Oscillator (green), after the Coherent SSF spectral filter (red), after the stretcher (blue) and the compressed amplified final spectrum (black)...195
Figure 6-4: The o/2o/3o broadband infrared generation scheme...203 Figure 6-5: Spectrum of the BBIR dispersed onto a 64 element liquid N2 cooled HgCdTe
array detector, with a 6 tm blazed 50 grooves/mm grating. The drop in intensity on the red edge of the spectrum is detector-limited, the feature at approximately 2300 cm-1 is due to absorption from atmospheric C0 2, and absorption lines between 1400 cm-1 and
1800 cm~1 are due to atmospheric H20...205
Figure 6-6: Dependence of the BBIR integrated intensity on the 800 nm power (left) for a BBIR spectrum resembling the one displayed in Figure 6-5...206 Figure 6-7: Dependence of the BBIR integrated intensity and the noise on the medium used to purge the plasm a (left). ... 208
Figure 6-8: BBIR spectrum detected on the HgCdTe array detector after passing through 50 ptm pinhole placed at different points about the focal point at the sample position.. .209
Figure 6-9: Cross-correlation of the BBIR pulses with 45 fs 3 ptm pulses in 500 pim thick In S b ... 2 10
Figure 6-10: Cross-correlation of the BBIR pulses with 3 ptm pulses in a 1 mm thick CaF2 window, showing a linear chirp across the mid-IR (left). The same cross-correlation is shown after numerically correcting for the chirp (right). The dotted blue line tracks the maximum of the cross correlation at every o3 to guide the eye...211
Figure 6-11: a) Spectrum of the broadband IR pulses at different polarization angles, unnormalized (left) and normalized (right). The polarization angles are relative to the polarization of the BBIR. b) Polarization dependence to the intensity of the BBIR at
different frequencies, normalized to the value at 0' polarization angle...213
Figure 6-12: Beam diagram for the broadband 2D IR experiment (top). A cartoon of a broadband 2D IR spectrum of coupled oscillators at zero waiting time...214
Figure 6-13: The broadband 2D IR experimental set-up...216 Figure 6-14: Interferometric cross-correlation of the blue side of the BBIR and the 3 jim p u lses... .... ... 2 19
Figure 7-1: Spectra of the 3400 cm' pump and the broadband infrared probe pulses overlaid on the linear infrared spectrum of H20. The dip in the BBIR spectrum at ~2300 cm' is due to the atmospheric CO2. . . . . . . . . . . ..229
Figure 7-2: a) Broadband 2D IR spectrum of H20 at T2 = 50 fs using excitation pulses
centered at 3400 cm', with a ~400 cm' bandwidth. Color-coded arrows represent transitions illustrated in b). The grey bar represents response from atmospheric CO2. b) Intramolecular and intermolecular energy level diagrams representative of the bend-stretch coupling and vibrational delocalization pictures, respectively...235
Figure 7-3: Broadband 2D IR spectra at waiting times of 50 fs, 100 fs, 250 fs and 500 fs. The spectra are normalized to the maximum of the 50 fs surface. The low frequency parts
of the spectra at 03 < 2000 cm-1 are magnified by a factor of four. The FTIR spectrum of
H20 is aligned with the os axis to guide the eye...238
Figure 7-4: a) Broadband dispersed pump-probe spectrum of H20 taken under magic
angle polarization conditions (left). The feature at 03 ~ 2300 cm-1 is due to the
atmospheric CO2. Color bar represents a change in absorbance in units of AmOD. b) The
first two components from a constrained singular value decomposition of the data presented in a) from 100 fs to 5 ps...240
Figure 7-5: Slice at o3 = 3610 cm' through the broadband dispersed pump-probe spectrum of H20. The line represents a double exponential fit through the data, which yielded tim escales of 250 fs and 1 ps...242
Figure 7-6: a) Broadband dispersed pump-probe spectra of H20 at parallel and
perpendicular polarizations, normalized to the maximum of the parallel spectrum. b) Time trace of pump-probe anisotropy as a function of waiting time integrated in o3 betw een 2900 cm - and 3000 cm -... 243
Figure 8-1: Illustration of the Grotthuss proton hopping mechanism...250 Figure 8-2: Infrared spectra of H20 and 6M HCl are shown along with spectra of the
3100 cm-I and 3400 cm-1 excitation pulses and the BBIR probe pulse. Displayed on top of the spectra are cartoons of the Eigen (or hydronium), bend vibrations and the corresponding O---O separation (Roo) distances. Cartoons of double-well proton transfer potentials are shown at the very top to illustrate the correlation between proton displacement and the corresponding vibrational frequencies...255 Figure 8-3: a) 2D IR spectra of H20 (left) and 6M HCl (right) at t2 = 50 fs and 100 fs
taken for pump pulses centered at 3200 cm-I with a bandwidth of 400 cm-'. b) ioi = 3350 cm-1, 3200 cm-' and 3100 cm-1 slices of the 2D IR broadband spectra of H20 (top) and
6M HCl (bottom) at a waiting time of 100 fs. ... 262 Figure 8-4: 2D IR spectra of 6M HCl at waiting times of 50 fs, 100 fs, 250 fs and 500 fs,
Figure 8-5: Broadband dispersed pump-probe spectra of H20, 2M HCl, 4M HCl and 6M HCl using excitation pulses centered at 3400 cm' (left) and 3100 cm-1 (right) at Tr2 = 60 fs. The linear infrared spectra of H20 and 6M HCl, after subtracting the continuum
absorption in the 6M HCl spectrum, are plotted on top to guide the eye. The grey dotted lines identify the position of the relevant bend peaks...265
Figure 8-6: Broadband dispersed pump-probe spectra of H20, 2M HCl, 4M HCl and 6M
HCl plotted from t2 = -100 fs to 500 fs, for excitation pulses centered at 3100 cm4 with 400 cm -1 bandwidth at FW HM ... 267
Figure 8-7: Time traces at 03 = 3000 cm' (top) and 03 = 1750 cm-1 (bottom) of H20 and
6M HCl for excitation pulses centered at 3100 cm '...268 Figure 8-8: Broadband dispersed pump-probe spectra of H20, 2M, 4M and 6M HCl solutions plotted from T2 = -100 fs to 500 fs, for excitation pulses centered at 3400 cm-'.
... . . . .. 2 69 Figure 8-9: a) Polarization dependent dispersed pump-probe of 6M HCl (left) and H20
(right) using excitation pulses centered at 3100 cm-, normalized to the maximum of the parallel surfaces, respectively. b) Parallel minus perpendicular difference pump-probe spectra of 6M HCl (left) and H20 (right). The difference spectra are normalized to their
respective maxima... ...270
Figure 8-10: A simple illustration to point out the different mechanisms by which the Eigen and Zundel species can exchange. Our data suggest the presence of the Eigen-to-Zundel-to-Eigen mechanism for proton transfer in acids, but does not show evidence for the absence of the Eigen-to-Eigen or Zundel-to-Zundel processes...276
Figure 8-Al: Dispersed pump-probe signals for 3100 cm' excitation at 03 = 2000 cm'
(top) and 03 = 1745 cm' (bottom) as a function of acid concentration, normalized to the maximum of the induced absorption for each concentration, at the specified waiting times... ... 283
Chapter 1
Introduction
1.1 Water's unique properties
Water is the most abundant liquid on earth, owing partly to the fact that it is made of two of the three most common elements in the universe - hydrogen and oxygen. Water
covers 70% of the earth's surface area, and is credited for creating and sustaining the rich flora and fauna both in the oceans as well as on land. The human body is also made up of as much as 65% water, which has proven to be an important solvent for biochemical reactions in all living organisms. Moreover, water's ability to exist in all three phases of matter under ambient conditions on earth, and its unique physical and thermodynamic properties such as large heat capacity and high boiling point, make it a key player in the regulation of global climate [1]. Water is not a mere spectator in any these geo- and bio-chemical processes, but an active participant owing to the peculiar nature in which it interacts with other molecules [1,2]. Several anomalous properties of water are well-known, from its high boiling point and expansion on freezing to its large surface tension and capillary activity. However, we lack fundamental understanding of how water
Centuries of scientific research on water have revealed how intriguing this molecule
actually is. Scientific investigations on water date back to the late 1 8th century, when
water was first identified as being composed of the elements hydrogen and oxygen [2].
These studies were followed by experiments that determined its exact stoichiometric
composition. With the advent of more sophisticated experimental and theoretical
techniques in the twentieth century, such as molecular spectroscopy and computer
modeling, much of the work over the last century has focused on understanding the
electronic, vibrational and rotational properties of water. Early spectroscopic
investigations were done on low pressure water vapor where interactions between water
molecules are negligible. These studies were successful in measuring, with a high degree
of accuracy, fundamental properties such as the geometry of the water molecule (bond
lengths and angles), its ionization energies, vibrational normal modes and
anharmonicities, and dipole and quadrupole moments of the three most abundant
isotopologues of water - H20, HDO and D20. Subsequent studies on water vapor at
higher pressures, along with electrostatic modeling of the interactions between molecules,
revealed the ideal orientation of neighboring water molecules that led to the most
favorable electrostatic interaction and gave insights into thermodynamic properties of
water vapor like the second virial coefficient and the fraction of energy in various
attractive and repulsive interactions between water molecules [2].
Water's unique properties arise from its interactions with other molecules in the
condensed phases, called the hydrogen bonding interaction. A hydrogen bond is an
intermolecular interaction that resembles, and is often modeled as, an electrostatic
liquid H20, the two H atoms can donate two hydrogen bonds and the two lone pairs on
the 0 atom can accept two hydrogen bonds from other water molecules. Developing an adequate definition of the hydrogen bond that can accurately predict classical and quantum mechanical properties of liquid water remains an active area of research, pointing to the highly complex structure and dynamics that govern the unique properties of water. A commonly employed definition of a hydrogen bond for describing infrared spectroscopy involves imposing an arbitrary geometric cut-off in distance between neighboring 0 atoms (Roo < 3.5
A)
and the angle between the O-H bond of a water molecule and the intermolecular 0-- 0 vector, called the hydrogen bond angle (c or 0.H---O < 300) [4]. Figure 1-1 illustrates the cut-off distance and angle employed in the
geometric hydrogen bond definition.
R0<3.5 A Q<30 deg
Figure 1-1: Geometric definition of a hydrogen bond between two water molecules. Roo is the distance between the oxygen atoms of the two water molecules, and a is the angle made by an OH bond with a line segment connecting the two oxygen atoms.
Other hydrogen bond definitions include quantifying the electron occupancy of the anti-bonding OH orbitals [5,6], and a topological definition [7] that does not impose a
geometric cut-off but instead assigns hydrogen bonds based on the nearest 0 atoms. The
delicate interplay between these attractive hydrogen bonds and the repulsive electrostatic
interactions at short range give water a unique liquid structure consisting of a complex
network of hydrogen bonds, which can explain some of its oddities such as the
anomalous low density of ice compared to liquid water.
Water is a light molecule that can very rapidly move on timescales as short as tens of
femtoseconds. Yet, its ability to accept and donate two hydrogen-bonds with its
neighboring molecules means that it can form structured networks, such as those in ice.
The hydrogen bond network of liquid water is strong enough to result in an elevated
boiling point of water of 100 OC compared to other molecules with similar mass, since
extra energy is needed to overcome the hydrogen bonding attraction between water
molecules. In the absence of hydrogen bonds, a molecule as light as H20 would have had
a boiling point of -80 OC. On the other hand, the strength of a hydrogen bond is roughly 5
to 6 kcal/mol [3], making thermal fluctuations under ambient conditions sufficient to
cleave these hydrogen bonds, leading to constant breaking and reforming of hydrogen
bonds in liquid water. The difficulty in studying liquid water arises from the combination
of both of these properties - fast motions of the light water molecule are coupled with the
structural ordering imparted by hydrogen bonding, resulting in a complex structured
liquid that rapidly evolves on fast femtosecond to picosecond timescales involving
correlated rearrangements of hydrogen bonds.
The fastest nuclear motions in liquid water occur on timescales of tens of
femtoseconds. These motions involve the intra-molecular vibrations such as the 10 fs
Librations, or hindered inertial rotations of water molecules, have been shown to occur on a 50 fs timescale [8,9], while the intermolecular hydrogen bond stretch has a period of 200 fs [8,10]. The librational and translational bands of H20 are extremely broad and
appear in the far-infrared region of the spectrum centered approximately at 700 cm-1 and 200 cm-1, respectively. The hydrogen bond distortions about three oxygen centers, on the other hand, happen on a slightly slower 550 fs timescale [11,12]. The movement of water molecules on such fast timescales is crucial to its ability in mediating aqueous reactions. Therefore, predictions on how water behaves and its intimate role in chemical reactions have to be preceded by an understanding of the instantaneous configurations of hydrogen bonding networks and the dynamics that govern their evolution.
Water's ability to rapidly change its structure has made it an important component in many aqueous chemical processes. Due to the strong dipole moment of water and the pace at which water molecules can rearrange, charge transport in water is accompanied by fast hydrogen bond rearrangements that energetically stabilize the displaced charge [13]. Particular interest has been shown in studying the transport of excess protons and hydroxide in water, since early ionic conductance measurements showed that the mobility of H30 was several times more than ions of similar size [13]. Grotthuss
attributed this anomalously high mobility of protons to charge migration between water moieties [14]. This process, now known as the Grotthuss Mechanism, describes proton transfer as a chemical process of sequential proton hops from one water molecule to the next, via the cleavage and formation of O-H bonds along hydrogen bonds, resulting in long-range charge transport, and not long-range displacement of any particular proton [13]. This idea has been extended to conceptualize proton transport in biological
systems, for example across cell membranes, where water molecules are said to create
water wires that guide the transport of charge.
Describing the behavior of water has been challenging both from theoretical and
experimental perspectives. Ultrafast time-resolved spectroscopy, often in conjunction
with classical molecular dynamics (MD) simulations and mixed quantum-classical
models, has helped us elucidate important aspects of hydrogen bonding dynamics in
water [15]. These MD simulations use classical force fields from various water models,
such as the simple point charge (SPC) models, to propagate Newton's equations of
motion. These water models describe the nature of the water molecules and the
interactions between them. Several models have been proposed for describing the
hydrogen bonding interaction between water molecules, and have been largely
parameterized to reproduce bulk thermodynamics properties of water such as density,
heat capacity and diffusion constants [16]. These models can be broadly classified into
rigid and flexible water models. Rigid models assume that the intramolecular bond
lengths and angles are fixed, and they only account for intermolecular interactions
described by electrostatics. Flexible water models account for the fluctuations in both the
intra- and intermolecular degrees of freedom, making them better equipped for
calculating vibrational coupling between low frequency vibrations. However, for
spectroscopic calculations thus far, the rigid water models have been most commonly
used to describe high frequency OH stretching vibrations in water due to the ease with
which they can be implemented [16]. Among the rigid water models, there are fixed
charge models that assign fixed partial charges to the 0 and H atoms, and polarizable
environment [16]. Intermolecular interactions in all of these models are described purely electrostatically and do not include quantum mechanical orbital overlap considerations. Ab initio-based force fields, such as the TTM force fields, have also been developed to describe water [17]. Intramolecular modes in these water models are described based on multidimensional molecular potential energy surfaces, and intermolecular interactions are parameterized based on ab initio calculations for water dimers [18,19]. These ab initio water models are flexible and implicitly include polarizability, and are used in conjunction with centroid and path integral molecular dynamics simulations to model hydrogen bonding dynamics and infrared spectroscopy [17-20]. However, due to added complexity and computational time associated with these calculations, ab initio techniques are yet to see the same level of popularity that classical methods enjoy for describing time-resolved spectroscopy of water.
Challenges from the experimental perspective have primarily originated from the difficulty in generating pulses short enough to study the fast motions of water molecules. Studying water requires laser pulses that are short enough to resolve the structural evolution of the hydrogen bond network on the femtosecond to picosecond timescales, and that are tuned to energies that can probe transitions in water most sensitive to the hydrogen bonding environment. Currently, ultrafast lasers are able to generate near-infrared pulses that are tens of femtoseconds in duration, short enough to probe the fast nuclear dynamics in liquids when tuned to appropriate frequencies. Optical parametric amplification techniques are used to tune the wavelength of laser outputs to frequencies ranging from the ultraviolet to the infrared regimes. However reliably generating pulses tuned to the OH stretching frequency at wavelengths of ~ 3 pm without significantly
compromising pulse duration remains a challenge. Ultrafast laser spectroscopy of water
serves as a reliable benchmark to compare and improve theoretical models of water. In
return, comparison of experimental spectroscopic data with spectra calculated from
simulations is a useful way to gain atomistic insight into the hydrogen bond dynamics in
water.
1.2 Probes of hydrogen bond dynamics in water
In recent years, the interpretation of water IR spectroscopy has undergone
tremendous advances as a result of mixed quantum-classical models that allow quantum
mechanical transition frequencies to be predicted from classical simulations of the
intermolecular motions of the liquid [16,21-26]. Molecular dynamics simulations of
SPC/E (simple point charge extended; rigid model with fixed partial charges on the H and O atoms) water model showed that the OH stretch vibration (oOH) of water is a sensitive
reporter of its local hydrogen bonding configuration [24,27,28]. The OH stretch
frequency of a water molecule participating in a strong hydrogen bond is shifted to lower
frequencies than that of a water molecule in a weak or broken hydrogen bond
configuration. These studies correlated geometric parameters associated with hydrogen
bonding, such as Roo and a, with OOH from the SPC/E water model with frequencies
calculated for the isotopically diluted HOD/D20 system (Figure 1-2 top), and showed
3.31 2.9 2.5 3300 3450 3600 3750 coon/2xc (cm-1) U1 0 'I 1.00 0.95 0.90 0.85 0 10 15 20 25 30 3300 3450 3600 3750 cmoV2itc (cm-1) 0
Z
0.8 00.6 C 0.4 0 .0 3000 3200 3400 3600 0OH(CM-1)
3800Figure 1-2: Correlation between oOH and Roo and WOH and a (top), extracted from MD simulations of SPC/E water [24]. The infrared spectrum of HOD/D20 (bottom).
While the correlation between OOH and the geometric parameters were good for low COH, they found poor correlation for higher (OH, suggesting that there exists a broad range of geometric configurations for water molecules participating in weak hydrogen bonds. The correlation of (OOH with the electric field of all the molecules in the simulation box projected along the OH bond was near-perfect, and the electric field of the nearest neighbor water molecule projected along the OH bond shows very good correlation, with
0 S 12. IQ 3 ID
of the environment strongly influence fluctuations in the hydrogen bond configuration.
From these calculations, it was clear that (OOH is a sensitive measure of hydrogen bonding
environment and following the instantaneous fluctuations in coOH can tell us about the
evolution of the hydrogen bonding network.
The linear infrared spectrum of HOD/D20 is displayed at the bottom of Figure 1-2.
The spectrum exhibits the OH stretching transition centered at 3400 cm', which is
inhomogenously broadened to a full-width at half-maximum of ~250 cm', reflecting the
many hydrogen bond configurations in the liquid. OH stretch vibrations that absorb on
the red side of the lineshape are due to HOD molecules in strong and linear hydrogen
bonded configurations, while those that absorb on the blue side of the OH stretch
lineshape are from HOD molecules in strained or broken hydrogen bond configurations.
Understanding hydrogen bond dynamics in water requires understanding the fast
fluctuations of water molecules reflected in the evolution of the OH stretch frequency.
The advent of ultrafast lasers has now allowed us to access the time-evolving structure of
the hydrogen bond network of water on timescales of tens of femtoseconds to several
picoseconds. Ultrafast two-dimensional infrared (2D IR) spectroscopy of the OH stretch
vibration of HOD/D20 is a powerful technique to probe the dynamics of hydrogen bond
exchange in water, and interpretation of the data is aided by molecular dynamics
simulations and mixed quantum-classical modeling of infrared spectra [15]. 2D IR and
pump-probe experiments were done with 45 fs pulses centered at 3400 cm' [29] to
follow the evolution of frequencies within the OH stretch lineshape on fast timescales.
2D IR spectroscopy can follow the correlation between initial frequency and final frequency for a range of waiting times, allowing us to monitor changes to the OH stretch
frequency of water with time and deduce the underlying dynamics with the help of 2D IR spectra calculated from molecular dynamics simulations. Much of our understanding of the timescales for local and global changes to the structure of liquid water described in the previous section have been derived from earlier 2D IR, pump-probe and other nonlinear infrared spectroscopies along with MD simulations. From these studies, the global hydrogen bond rearrangement and collective reorientation of water molecules were measured to exhibit timescales of 1.5 ps and 3 ps, respectively [8].
These timescales tie into the dynamics of how water molecules exchange their hydrogen bonding partners. Two pictures emerge for describing the process of hydrogen bond exchange in water. One picture suggests that the exchange happens in a step-wise fashion, where a hydrogen bond is first broken and the dangling OH of a water molecule persists for timescales longer than the correlation time in water (~340 fs [8]) as it waits for a new hydrogen bond partner, and then forms a stable hydrogen bond with a different molecule. The other picture describes the hydrogen bond switch as being a concerted process, where the dangling hydrogen bond is only transiently visited during hydrogen bond exchange. Earlier 2D IR work on HOD/D20 and MD simulations shed light on the
relative persistence of strong and weakly hydrogen bonded configurations in water [30,31]. By analyzing the line shapes of 2D IR spectra, they concluded that the non-hydrogen bonded or strained configurations are visited only transiently during hydrogen bond exchange, and in fact persist for less than 100 fs. The experiments suggested that a non-hydrogen bonded configuration return to a stable hydrogen bonded state on a timescale of 60 fs, which is strikingly similar to the librational timescales in water. These studies indicated that the evolution of a non-hydrogen bonded water
molecule to a stable hydrogen bond configuration is driven by librational fluctuations, and that hydrogen bond switching is a concerted process involving exchange of the
initial and final hydrogen bond acceptors [30].
-100 fs 0 fs 100 fs 900 fs
Figure 1-3: Large angle reorientation of a water molecule about a hydrogen bond switching event from molecular dynamics simulations of SPC/E water. The 0 fs frame represents the time when the switching happens, and the configuration at this time is referred to as a bifurcated hydrogen bond state.
MD simulations of the SPC/E water model (Figure 1-3) by Hynes and Laage [32,33]
went on to provide evidence for the existence of inertial "jump" reorientation of water
molecules that accompanies hydrogen bond switching, suggesting that the angular
diffusion model cannot explain the large angular jumps they were observing in their
simulations. These studies quantified the average angle for reorientation of a switching
water molecule to be -68', with the peak of the distribution of jump angles for various
molecules in the simulation to be ~50'. Other less probable switching mechanisms in
for the same SPC/E water model, but all proposed mechanisms of hydrogen bond
exchange involved a large angle reorientation of the switching water molecule.
Furthermore, 2D IR experiments on switching of HBs to solvated ions [34,35] confirmed
that hydrogen bond connectivity changes by large angle jump reorientation. In the first
part of this thesis, I explore in detail the relationship between the initial and final o>OH and
the orientation of the HOD transition dipole through 2D IR anisotropy experiments.
These measurements add an extra dimension to the spectroscopy, and can be interpreted
through frequency-orientation correlations, giving us a direct measure of the orientational
dynamics of hydrogen bond exchange [36].
1.3 Vibrational relaxation in liquid H20
In addition to the rapid rearrangement of the hydrogen bond network that mediates
aqueous chemical reactions, the ability of water to energetically stabilize intermediates on
ultrafast timescales through efficient vibrational energy dissipation is a major contributor
to the role of water in aqueous chemistry. Solutes dissolved in liquid water are greatly
influenced by the nature of the vibrations of the surrounding water molecules that help
funnel excess energy into thermal vibrations of the system. The timescales and pathways
for the relaxation of vibrational excitation in H20 has been the subject of many
experimental [37-47] and theoretical [48-52] investigations over the last several years.
Using ultrafast narrowband infrared spectroscopy [39,42,45,46] and IR/Raman
spectroscopy [37,44], previous experimental efforts have probed the relaxation of an OH
stretch excitation in liquid H20. Understanding how vibrational energy is dissipated upon
The traditional picture for vibrational relaxation, where vibrational energy flows
downhill through a set of weakly coupled intra-molecular normal modes and then to the
low-frequency collective intermolecular vibrations of the surroundings, is often used to
describe relaxation of the OH stretch excitation and the growth of the thermal spectrum in
water. Work from other groups have suggested that upon the excitation of the OH stretch
vibration in water at 3400 cm', the energy first flows into the overtone (3250-3300 cm-l)
or the fundamental transition (1650 cm-) of the H20 bend vibration that is either
localized on one molecule or across two neighboring water molecules, and then into the
collective librations and low frequency modes, resulting in heating of the
liquid [39,44,46,47]. Using narrowband IR pump and incoherent anti-Stokes Raman
probing of H20 on sub-picosecond timescales, Dlott and co-workers [37,44] concluded
that exciting the OH stretch transition at any frequency within the broad lineshape results
in vibrational energy relaxation either to the v = 0 to 2 overtone transition of the bend
centered at 3300 cm-1 that eventually excites one quantum of the v = 0 to 1 fundamental
bend transition, or to two quanta of the fundamental bend transition on two adjacent
water molecules [44]. From the anomalous temperature dependent trends in the
vibrational relaxation timescale of the OH stretch from narrowband infrared pump-probe
spectroscopy of H20, Lock and Bakker [46] postulated that the OH stretch relaxation
happens through the v = 0 to 2 overtone transition of the bend. Using two-color infrared
pump-probe spectroscopy, Lindner et al. [39] further suggested that upon exciting the OH
stretching vibration in H20, the vibrational energy relaxation proceeds via a transiently
populated v = 0 to 2 transition of the bend, followed by the splitting of the bend overtone
to populate the librational and low frequency modes. Attempts have also been made to
explain vibrational relaxation as a process where the OH stretch excitation first undergoes
resonant intermolecular energy transfer to excite OH stretch vibrations on surrounding
water molecules, followed by energy dissipation to the low frequency modes [53].
Furthermore, using narrowband pump-probe anisotropy measurements on the OH stretch,
Kraemer et al. [45] predicted the 80 fs anisotropy decay they measured to be from
intermolecular OH energy transfer and the 250 fs population decay of the OH stretch to
originate from intra-molecular stretch-to-bend relaxation.
An additional important consideration in liquid H20 is the fact that the hydrogen
bonding and intermolecular vibrational coupling give rise to the delocalization of the
vibrational modes. Using temperature-dependent narrowband 2D IR and pump-probe
anisotropy on H20, Kraemer et al. [45] concluded that the OH stretch excitation in water
is delocalized over several water molecules. This is in agreement with molecular
dynamics simulation work [48,50-52], which modeled the OH stretch delocalization
through electrostatic interactions between water molecules and showed that the OH
stretch vibrational eigenstates could be delocalized across as many as 6 water molecules.
How this delocalization affects the timescale and pathways for energy relaxation, and the
manner in which modes other than the OH stretch are delocalized are currently being
investigated.
These earlier studies on water have attempted to decouple the contributions from
intra- and inter-molecular pathways of energy relaxation in liquid H20, often resorting to
window offered by narrowband infrared pulses generated by optical parametric
amplifiers. In reality however, vibrational energy relaxation in liquid H20 is slave to the
complex interplay between intra-molecular and inter-molecular relaxation pathways,
influenced by both vibrational coupling and hydrogen bonding interactions and requiring
that we use a broader frequency window to probe vibrational dynamics of all mid-IR
features of water. Using ultrafast broadband infrared pulses generated from a plasma, we
probed vibrational coupling and relaxation in liquid H20 through broadband 2D IR and
broadband pump-probe spectroscopies, which are described in the second half of this
thesis. Our results point to a strong mixing of inter- and intramolecular vibrational modes
of water, giving rise to highly efficient pathways for ultrafast energy dissipation.
1.4 Aqueous proton transport in acids
Aqueous chemistry is ubiquitous in nature and occurs primarily under acidic or basic
conditions, and aqueous reactions are governed by the transport of protons through liquid
water. Aqueous proton transfer (PT) drives processes such as electrochemical reactions in
fuel cells and biochemical reactions like charge transport across cell membranes and
enzymatic catalysis. Ultrafast hydrogen bond rearrangements as well as rapid energy
dissipation in water influence the transport of protons through the liquid. Despite its
importance, the structure of the proton in liquid water and the dynamics of its transport
are contested, and several unanswered questions remain. Is a proton in water localized on
a single water molecule in the form of the covalently bound hydronium ion (H30*), and if
so, is it more appropriate to characterize its structure as the Eigen ion (H904*) [54] where
more delocalized, where its charge is shared by two or more water molecules, such as in
the Zundel species (H502*) [55] where the proton is equally shared between two water
molecules? Figure 1-4 shows cartoons of the Zundel and Eigen complexes of the
hydrated proton. How do these structures interconvert and what is the role of the
solvating water molecules in the transfer of protons?
Eigen
Zundel
Figure 1-4: Illustrations of the Zundel (H5O2 ) and the Eigen (H904) complexes of the hydrated proton. The O---O distance for the two complexes have been calculated to be ~2.4
A
and ~2.6A,
respectively, which are shorter than the distance in bulk water (~2.8A) [56].
While the proton hopping mechanism is a widely accepted picture for proton
transport in acids and bases, it does not explain the driving force behind proton transfer
and presents a highly simplistic view of the process. That the strength of a hydrogen bond
and the barrier for proton transfer are similar in energy indicates that the reorganization


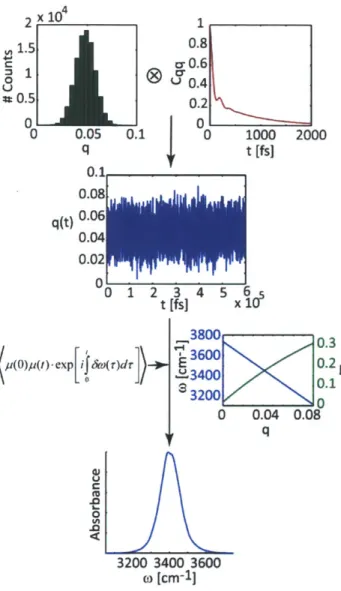
![Figure 3-2: Comparison of the normalized three-pulse echo peak shift calculated from our model, which includes the non-Condon effect, with the normalized experimental peak shift measurement (top left) of HOD/D20 [41]](https://thumb-eu.123doks.com/thumbv2/123doknet/14755272.582197/97.918.282.621.110.435/figure-comparison-normalized-calculated-includes-normalized-experimental-measurement.webp)