HAL Id: hal-00300912
https://hal.archives-ouvertes.fr/hal-00300912
Submitted on 12 Jan 2005HAL is a multi-disciplinary open access
archive for the deposit and dissemination of sci-entific research documents, whether they are pub-lished or not. The documents may come from teaching and research institutions in France or abroad, or from public or private research centers.
L’archive ouverte pluridisciplinaire HAL, est destinée au dépôt et à la diffusion de documents scientifiques de niveau recherche, publiés ou non, émanant des établissements d’enseignement et de recherche français ou étrangers, des laboratoires publics ou privés.
Fall vortex ozone as a predictor of springtime total
ozone at high northern latitudes
S. R. Kawa, P. A. Newman, R. S. Stolarski, R. M. Bevilacqua
To cite this version:
S. R. Kawa, P. A. Newman, R. S. Stolarski, R. M. Bevilacqua. Fall vortex ozone as a predictor of springtime total ozone at high northern latitudes. Atmospheric Chemistry and Physics Discussions, European Geosciences Union, 2005, 5 (1), pp.155-178. �hal-00300912�
ACPD
5, 155–178, 2005Fall vortex ozone S. R. Kawa et al. Title Page Abstract Introduction Conclusions References Tables Figures J I J I Back Close
Full Screen / Esc
Print Version
Interactive Discussion
EGU
Atmos. Chem. Phys. Discuss., 5, 155–178, 2005 www.atmos-chem-phys.org/acpd/5/155/
SRef-ID: 1680-7375/acpd/2005-5-155 European Geosciences Union
Atmospheric Chemistry and Physics Discussions
Fall vortex ozone as a predictor of
springtime total ozone at high northern
latitudes
S. R. Kawa1, P. A. Newman1, R. S. Stolarski1, and R. M. Bevilacqua2
1
Atmospheric Chemistry and Dynamics Branch, NASA Goddard Space Flight Center, Greenbelt, Maryland, USA
2
Naval Research Laboratory, Washington, DC, USA
Received: 17 November 2004 – Accepted: 1 January 2005 – Published: 12 January 2005 Correspondence to: S. R. Kawa ([email protected])
ACPD
5, 155–178, 2005Fall vortex ozone S. R. Kawa et al. Title Page Abstract Introduction Conclusions References Tables Figures J I J I Back Close
Full Screen / Esc
Print Version
Interactive Discussion
EGU Abstract
Understanding the impact of atmospheric dynamical variability on observed changes in stratospheric O3 is a key to understanding how O3 will change with future climate dynamics and trace gas abundances. In this paper we examine the linkage between interannual variability in total column O3at northern high latitudes in March and
lower-5
to-mid stratospheric vortex O3in the prior November. We find that these two quantities are significantly correlated in the years available from TOMS, SBUV, and POAM data (1978–2004). Additionally, we find that the apparent decadal shift in March O3 variabil-ity from the 1980s to years post-1990 is also seen in the November vortex O3, so that interannual variability in both quantities is largely driven by the later years. The cause
10
of this correlation is not clear, however. Interannual variations in March total O3 are known to correspond closely with variations in winter stratospheric wave driving con-sistent with the effects of varying residual circulation, temperature, and chemical loss. Variation in November vortex O3may also depend on dynamical wave activity, however, the dynamics in fall are less variable than in winter and spring. We do not find
signif-15
icant correlations of dynamic indicators for November such as temperature, heat flux, or polar average total O3 with the November vortex O3, nor with dynamical indicators later in winter and spring that might lead to a connection to March. We discuss several potential hypotheses for the observed correlation but do not find strong evidence for any considered mechanism. We present the observations as a phenomenon whose
20
understanding may improve our ability to predict the dependence of O3 on changing dynamics and chemistry.
1. Introduction
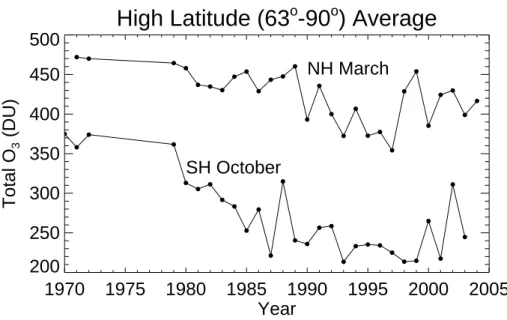
The polar regions are a bellwether for processes that affect stratospheric O3 globally. Decadal decreases in total O3at high southern latitudes in spring (Fig. 1) are clearly
at-25
ACPD
5, 155–178, 2005Fall vortex ozone S. R. Kawa et al. Title Page Abstract Introduction Conclusions References Tables Figures J I J I Back Close
Full Screen / Esc
Print Version
Interactive Discussion
EGU
anthropogenic origin, which are now regulated by international agreements (Solomon, 1999 and references within). Owing to more active meteorology in the northern hemi-sphere (NH), springtime O3 decreases there are not as monotonic as those in the South (Fig. 1) and are attributed to a combination of chemical and dynamical forcings (Newman et al., 1997; Manney et al., 1997; Coy et al., 1997; Chipperfield and Jones,
5
1999; Anderson and Knudsen, 2002). The relative contribution, causal mechanisms, and time scales for dynamical O3 change at high northern latitudes, as well as in the middle latitudes of both hemispheres, is currently the subject of active scientific debate (WMO, 2003).
During winter, O3 is transported from the low-latitude photochemical production
re-10
gion by the poleward and downward Brewer-Dobson circulation. This circulation is primarily driven by planetary scale waves propagating into the stratosphere from the Northern extratropical troposphere (Rosenlof and Holton, 1993). These planetary waves affect polar O3is three ways: 1) directly, as noted above, by the Brewer-Dobson circulation which advects higher concentrations of O3 into the lower stratosphere, 2)
15
by occasionally mixing material into the polar vortex or by breaking up the polar vor-tex, and 3) indirectly by warming the polar region and reducing the occurrence of polar stratospheric clouds, which thereby decreases catalytic chemical loss of O3. Inter-annual variation of planetary wave activity has a major affect on O3levels in spring via both transport and photochemical loss.
20
Quantifying the contribution of dynamical versus photochemical processes is es-sential to predicting the future of stratospheric O3 in the face of changing trace gas abundances (e.g., Cly, Bry, H2O) and climate. Better understanding of the chemical and dynamical components of contemporary O3 variability and trends is required. Al-though current trends in Cl and Br are known to within several percent and future Cl
25
and Br can be forecast with relative confidence (WMO, 2003), no one can predict NH high latitude O3in the next few years or decades to better than about 50 DU (Fig. 1). In spite of extensive study we still don’t know to what extent the observed changes represent trends related to chemistry, dynamics, or just natural variability.
ACPD
5, 155–178, 2005Fall vortex ozone S. R. Kawa et al. Title Page Abstract Introduction Conclusions References Tables Figures J I J I Back Close
Full Screen / Esc
Print Version
Interactive Discussion
EGU
The objective of this work is to present data for the interannual variability in O3and to show that a correlation exists between NH March total O3 and NH vortex O3 in the preceding November. Previous work (Kawa et al., 2002), hereafter referred to as K02, showed typical O3 values and structure in the fall 1999 polar vortex from Polar Ozone and Aerosol Measurement (POAM) observations. The key features from K02 are that
5
1. O3in the vortex (lower-middle stratosphere) in late November (∼3 ppmv) is signif-icantly lower in mixing ratio than outside the vortex at similar latitude
2. O3in the vortex has a relatively small vertical gradient from 550 to 800 K
3. Polar vortex O3is controlled by photochemical loss operating through late summer and fall on a relatively isolated high-latitude air mass.
10
Here we show that other years are similar to these 1999 results. Some interannual variability does exist however, albeit small with respect to spring variability. We find that this variability in the northern fall vortex is correlated with variability in total O3 at high latitudes in spring (Fig. 1).
We explore several potential hypotheses for how the fall and spring diagnostics are
15
connected; however we do not find a convincing mechanistic link. Variability in both quantities is presumably related to stratospheric dynamical variability, but we do not find a significant correlation of indicators of dynamical activity between the two peri-ods. This may be because the time series is not sufficiently long, the data are not precise or complete enough, the correlation is in fact random, or we simply have not
20
found the best way to look at the problem. In any case, establishing the existence of and determining the physical relationship for such a correlation should aid us in un-derstanding the impact of observed and future dynamical changes on stratospheric O3.
ACPD
5, 155–178, 2005Fall vortex ozone S. R. Kawa et al. Title Page Abstract Introduction Conclusions References Tables Figures J I J I Back Close
Full Screen / Esc
Print Version
Interactive Discussion
EGU 2. Fall O3data
2.1. POAM
We use the 10 years of available data from POAM II and III for November (Table 1). The POAM II and III instruments are visible/near infrared photometers for making mea-surements of O3, aerosol extinction, water vapor, and nitrogen dioxide in the polar
5
stratosphere using the solar occultation technique (Lucke et al., 1999). For science applications, the two instruments are essentially the same. POAM makes 14–15 mea-surements per day in each hemisphere around a circle of latitude, with a longitudinal spacing of about 25◦. The measurement latitude varies slowly over the year. In the northern hemisphere in November the measurement range is 65◦N to 69◦N. The
sea-10
sonal latitude coverage of POAM III is nearly identical to that of POAM II. We use version 3 POAM III O3retrievals, which have a vertical resolution of about 1.1 km, and random error levels of <10% above 10 km (<5% above 15 km) (Lumpe et al., 2002).
For POAM II, we use version 6 data (the latest version). However, there is a system-atic bias between the POAM II version 6 and the POAM III version 3 O3retrievals, with
15
POAM II O3 mixing ratios generally lower than POAM III. The reason for the discrep-ancy is not completely clear, but POAM II and POAM III validation studies (Rusch et al., 1997 and Randall et al., 2003, respectively) strongly suggest that this is a POAM II problem, perhaps related to altitude registration errors. Derivation of an optimum empirical correction to the POAM II data is currently in progress by the POAM team.
20
For this study we have applied a time invariant, altitude-dependent correction profile to enforce consistency with POAM III based on the POAM II/III time series and the vali-dation studies of the two instruments. The correction scale factor is 1.1 (10% POAM II mixing ratio increase) at and below 500 K, with a linear decrease to unity at and above 1000 K. We estimate that this correction factor is accurate to 3–5%, which is sufficient
25
for our purposes.
Each of the 10 years of available POAM data (Table 1) for November is averaged in potential temperature-equivalent latitude intervals (see Fig. 3 of K02 for an example
ACPD
5, 155–178, 2005Fall vortex ozone S. R. Kawa et al. Title Page Abstract Introduction Conclusions References Tables Figures J I J I Back Close
Full Screen / Esc
Print Version
Interactive Discussion
EGU
cross section). The equivalent latitudes are calculated (Nash et al., 1996) for a set of potential temperature levels using daily UKMO potential vorticity analyses and interpo-lated to the POAM measurement locations for that day. POAM O3 mixing ratios inter-polated to each potential temperature level are summed and averaged in 5◦-equivalent latitude bins. In all years there are at least 4 individual POAM samples in each bin from
5
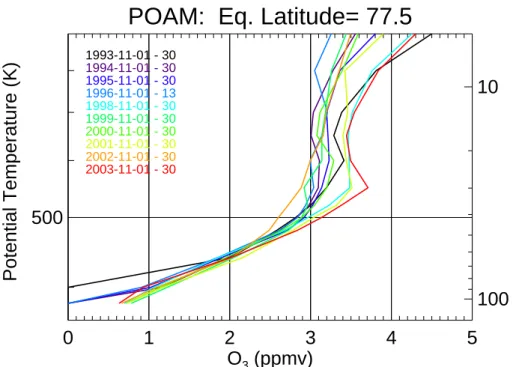
55◦to 85◦ at 550 to 700 K and the average is about 20 (e.g., Hoppel et al., 2002). The average O3 profiles for each November in the equivalent latitude range 75◦ to 80◦(Fig. 2) show the same general features as were found for 1999 in K02: O3mixing ratios in the vortex are 3 to 3.5 ppmv with very little vertical gradient from 550 to 800 K or above. The vortex edge (Nash et al., 1996) for each year is between 60◦ and 70◦
10
from 550 to 800 K so the profiles shown in Fig. 2 are inside the vortex. The average O3 varies about ±10% from the interannual mean. Horizontal O3gradients in the vortex, above about 70◦equivalent latitude, are also small as seen in K02.
2.2. SBUV
To extend the time series analysis to more years, we analyzed November vortex O3
15
data (version 8) from the Solar Backscatter Ultraviolet (SBUV) and SBUV/2 instruments for 1978-2003 (McPeters et al., 1994; Miller et al., 2002). SBUV data are available for 24 years. Horizontal coverage is more extensive than POAM. The maximum latitude coverage (SZA=88◦) is determined by the position of the seasonal terminator so the SBUV maximum latitude is about the same as the POAM sample latitude, but because
20
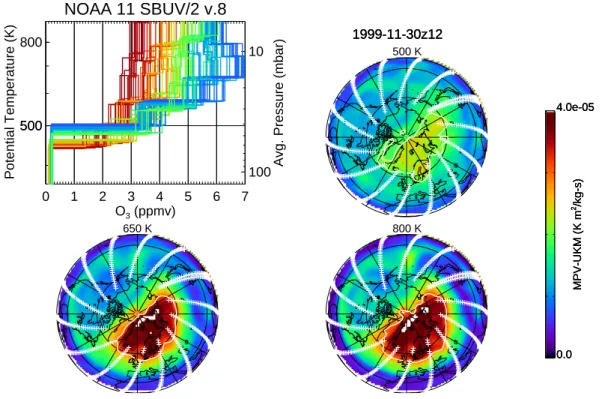
SBUV is a nadir sounder, it samples the full range of sunlit latitudes in each orbit. An example of SBUV coverage is shown in Fig. 3 (compare to Fig. 2 of K02 for POAM).
The vertical resolution of SBUV is coarse (about 5–8 km) relative to POAM (1.1 km), although the O3profiles of interest do not have much vertical variability. Also precision and accuracy are not quite as good as POAM. The single profile error for version
25
6 SBUV between 30 and 1 mbar is estimated at ≤10% (Bhartia et al., 1996), and comparison of NOAA-11 SBUV/2 with correlative data shows comparable differences (Planet et al., 1996). Four different SBUV satellite instruments are used over the 24
ACPD
5, 155–178, 2005Fall vortex ozone S. R. Kawa et al. Title Page Abstract Introduction Conclusions References Tables Figures J I J I Back Close
Full Screen / Esc
Print Version
Interactive Discussion
EGU
years. The different instruments are inter-calibrated to better than ±2% for total O3 (Miller et al., 2002); version 8 is a significant improvement over previous (Bhartia et al., 2004). Comparison of SBUV and POAM O3data (cf., Fig. 3 and K02 Fig. 2) shows the distribution from SBUV has the same general features as POAM discussed above.
Equivalent latitude/potential temperature averages of SBUV data for the 10 POAM
5
years shows a close correlation to POAM averages, r=0.89 at 600 K. Overall, the stan-dard deviation of the November equivalent latitude averages in the vortex is about the same (0.2–0.5 ppmv, e.g., K02 Fig. 3) in years common to POAM and SBUV. We have also done an extensive point-by-point comparison between SBUV and POAM data in the NH in November of each year. Same-day, collocated within 1000 km, layer
aver-10
ages for pressures of 6–10, 10–16, and 16–25 mbar, POAM and SBUV/2 O3 mixing ratios are correlated at the r=0.83 to 0.96 level. We conclude that the SBUV is cali-brated well enough with POAM that we proceed to use the longer SBUV time series to better understand the significance of O3variability observed during the POAM years.
3. Correlation with March TOMS
15
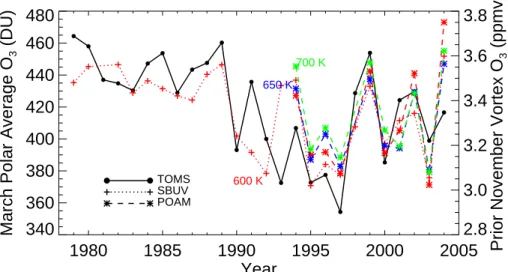
Comparing the time series of average November vortex O3 (Fig. 4) with the high-latitude total O3 in March (from Fig. 1) we find that the interannual variability appears to be correlated. The fall data are shifted one year forward in Fig. 4 so, for example, the November O3plotted at 2003 is actually from November 2002. The November av-erage is taken over equivalent latitudes 70 to 85◦, which are inside the vortex and are
20
sampled in every year. The March average is taken over the region poleward of 63◦, which generally includes the polar vortex (Newman et al., 1997). Shifting the March averaging boundary within 58 to 73◦ does not change the correlations, only the am-plitude of the fluctuations. The March averages taken at different latitude cutoffs are highly correlated with each other because most of the variability is at the high latitudes.
25
As discussed above, the data from SBUV and POAM in Fig. 4 are nearly the same for the years of overlap. SBUV data are shown at only one potential temperature
ACPD
5, 155–178, 2005Fall vortex ozone S. R. Kawa et al. Title Page Abstract Introduction Conclusions References Tables Figures J I J I Back Close
Full Screen / Esc
Print Version
Interactive Discussion
EGU
(600 K) because of their lower vertical resolution and because the NCEP meteorolog-ical analysis used for the potential temperature/equivalent latitude averaging extends only to 10 mbar. The 1979 to 2003 SBUV analysis uses the NCEP reanalysis (Kalnay et al., 1996) because UKMO data is not available before 1991. The POAM analysis uses meteorological data from the UKMO assimilation system (Swinbank and O’Neill,
5
1994), as do our comparisons between POAM and SBUV/2, to examine the full depth of the stratosphere.
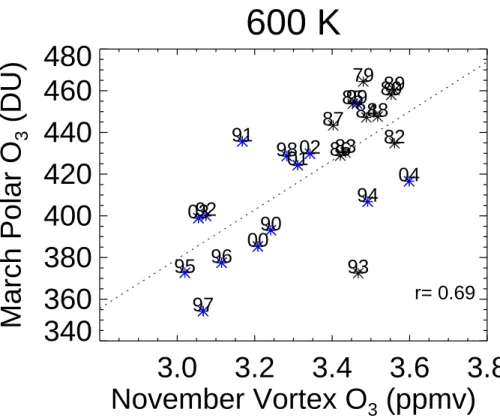
Assuming a linear fit to the data in Fig. 4, the correlation coefficient between Novem-ber vortex and March total O3 is fairly large (Fig. 5) although there is no apparent reason to assume a linear model for the relationship. For 24 data points (years), a
10
correlation of 0.6 is significant above the 99% confidence level using a Student’s t-test. The correlation coefficients using only the 10 POAM years are also significant at the 98% level (r>0.7). As expected from the lack of vertical gradient in the November vortex O3(Fig. 2), Fig. 4 shows the correlations are high from 550 to 700 K. Below 500 and above 800 K the correlation coefficient falls to less than 0.6 as shown in Fig. 6.
15
The data for 1993 (March 1993, November 1992) form an apparent outlier with low March total O3but relatively high November vortex O3. This year may exhibit anoma-lous O3 behavior at high latitudes as a result of the chemical impact of aerosol from the Mt. Pinatubo eruption in June 1991. Rosenfield (2003) using a 2-D stratospheric chemistry-transport model shows that the maximum effect from Pinatubo on O3at high
20
northern latitudes in March does not occur until 1993. She finds that the net chemical effect from the aerosol, which occurs mostly below 50 mbar, produces about a 25 DU decrease in the column relative to previous and following years. The aerosol chemical impact on O3diminishes with altitude above the lowermost stratosphere and becomes a net increase near 25 km where the NOx catalytic cycle dominates. This altitude is
25
close to that where our November O3diagnostic is evaluated. An analysis of observa-tional data following Pinatubo (Angell, 1998) shows similar timing of profile and total O3 changes at polar latitudes in the North. Thus the data for 1992/1993 exhibit a different correlation than other years and one that is consistent with the demonstrated chemical
ACPD
5, 155–178, 2005Fall vortex ozone S. R. Kawa et al. Title Page Abstract Introduction Conclusions References Tables Figures J I J I Back Close
Full Screen / Esc
Print Version
Interactive Discussion
EGU
influence of Mt. Pinatubo aerosol. If we omit 1993 from the correlation of Fig. 5, the r value increases to 0.78.
Finally, with reference to the March total column O3 time series (Figs. 1, 4), we see significantly greater variability in 1990–2004 compared to prior years. All the low O3 years (<420 DU) occur after 1989 and the variance is much larger. This is consistent
5
with analysis of meteorological variability. Stratospheric warmings have been less fre-quent and intense through the 1990s (Pawson and Naujokat, 1999; Waugh et al., 1999) leading to a more stable NH vortex, less descent, and lower March O3. Whether this change in the O3 time series is significant in a climatological context and how it may be related to possible decadal changes in tropospheric climate forcing and chemistry
10
is currently under debate (WMO, 2003). In a separate model test we found that the residual influence of halogens, after removing the 21-year trend, was to reduce March O3 in the lowest years after 1990 by about 10 DU compared to a parallel calculation using constant 1979 Bry and Cly. Understanding the correlation with November vortex O3in the 1990s may be a clue to better understanding the changes in O3and dynamics
15
depicted in Fig. 1.
4. Discussion
In order to understand the apparent correlation seen in Figs. 4–6, we seek a hypothesis for the mechanistic link between these two diagnostic quantities-November vortex O3in the lower to middle stratosphere and March total O3at high latitudes. Both are related
20
to the strength and stability of the polar vortex, wave activity, and descent, modulated by chemistry.
March total O3 is primarily a measure of accumulated winter descent of O3-rich air to the lower stratosphere. Most of the O3 increase occurs as a result of descent near the vortex edge (Schoeberl et al., 1992). This descent, and its associated adiabatic
25
temperature increase, is controlled by planetary wave driving in mid winter (Newman et al., 2001). Large-amplitude wave events are manifested as stratospheric warmings.
ACPD
5, 155–178, 2005Fall vortex ozone S. R. Kawa et al. Title Page Abstract Introduction Conclusions References Tables Figures J I J I Back Close
Full Screen / Esc
Print Version
Interactive Discussion
EGU
March total O3is well correlated to January/February/March high latitude temperature and tropopause heat flux, which is a fairly direct indicator of wave dynamical activity (Randel et al., 2002). Low March O3, cold years are characterized by a stable vortex with relatively smaller accumulated descent at high latitudes. In other years the vortex is no longer evident in late March, having been entirely eroded away by wave events.
5
Accelerated chemical loss in the lower stratospheric vortex also contributes to a low March average as the area-weighted diagnostic includes changes in the vortex as well as the so-called “croissant” region, the total O3maximum surrounding the vortex. We have dissected the March polar total O3 into equivalent latitude regions based on po-tential vorticity gradients at 500 K. Interannual variability of O3 for equivalent latitudes
10
greater than 65◦is highly correlated (r>0.9) with the March area average, and the cor-relation is greater than 0.8 down to equivalent latitudes of 45◦N. The average edge of the polar vortex at 500 K in March is generally near equivalent latitude 72◦, which is where the correlation coefficient is at its maximum. The high correlation across a wide range of equivalent latitudes, including both vortex and extra-vortex air, demonstrates
15
that interannual variation in the March area diagnostic represents variability in both transport and chemical loss, as the latter is highly confined to vortex equivalent lati-tudes. Observationally, it is not possible to isolate the lower stratospheric photochemi-cal loss contribution to variation in March average total O3from that due to descent and mixing. Model simulations indicate that dynamical variations dominate over chemistry
20
through the 1990s (Chipperfield and Jones, 1999). Alternatively, Andersen and Knud-sen (2002) argue that inferred chemical O3 loss in the vortex accounts for more than half of the observed O3 change in March 1992–2000 from the 1979–1982 average. The time series residual of Andersen and Knudsen, attributable to dynamic variations, also does show a clear correlation with the March O3, i.e., the chemical and
dynam-25
ical effects are strongly correlated (as expected). In terms of the analysis presented here the key parameter is dynamical variation that controls both the O3 transport and temperature, which in turn drives chemical loss.
lim-ACPD
5, 155–178, 2005Fall vortex ozone S. R. Kawa et al. Title Page Abstract Introduction Conclusions References Tables Figures J I J I Back Close
Full Screen / Esc
Print Version
Interactive Discussion
EGU
ited altitude range in the middle to lower stratosphere. Interannual variability here is relatively small, consistent with the invariant seasonal radiative and photochemical processes that govern O3 in this region (K02 and references within). Relative to mid latitudes, the vortex contains low O3 mixing ratios that are produced by chemical loss through the fall season (K02). The variability here likely results from varying descent
5
in the vortex and possibly mixing of higher-O3 air into the vortex, both of which de-pend on the early-season wave activity. Descent in the vortex is primarily driven by diabatic cooling, but wave driving also plays a role. Most of the analyzed years show evidence at 650 K of waves distorting the vortex and pushing it off the pole in Novem-ber (e.g., Fig. 3). These common wave events are referred to as Canadian warmings
10
(Labitzke 1977, 1982). The key to uncovering the mechanism that produces the ob-served fall-spring correlations seems to lie in determining what drives the variability in the fall vortex since the spring total O3variability can largely be understood in terms of tropospheric wave forcing driving the stratospheric dynamics.
Other possible indicators of dynamic activity in November do not show as close a
15
correlation as seen in Figs. 4–6. November temperature, either high latitude aver-age or vortex averaver-aged (done like POAM here, not shown) is not well correlated with March O3(r=0.39). November temperature has little variability (<8 K range versus 22 K in March, 1979–2002 at 650 K and below) and is apparently a less sensitive indi-cator. November total O3 high latitude average is also not correlated with March total
20
ozone O3(r=0.29). Similar to the temperature comparison above, November total O3 has low variability, 35 DU range versus 120 DU in March. Thus interannual variability in the March minus November O3 difference is driven almost entirely by variability in March O3. This indicates that the observed correlation is not simply a persistence of anomalous high-latitude O3 from one season to the next. Note that an anomaly of
25
±0.25 ppmv over a vertical extent of 550 to 800 K (30 to 8 mbar, Fig. 2) amounts to an anomaly of ±4.3 DU, far less than the observed changes in total O3. We also ran a radiative transfer model test (Rosenfield et al., 1994) that showed the observed O3 profile perturbation in fall would have a negligible impact on vortex descent calculated
ACPD
5, 155–178, 2005Fall vortex ozone S. R. Kawa et al. Title Page Abstract Introduction Conclusions References Tables Figures J I J I Back Close
Full Screen / Esc
Print Version
Interactive Discussion
EGU
through winter.
November TOMS total O3averaged only in the vortex (as defined at 650 K, similar to the method above) is fairly well correlated with March O3but not as well as November POAM O3, consistent with the profile correlation in Fig. 6. These findings based on total O3and temperature analyses are consistent whether all available years 1979–2003 are
5
used or just the POAM years.
In summary, this adds up to the fact that no other fall diagnostic based on tempera-ture or total O3is as good an indicator of dynamic activity through the winter as lower to middle stratosphere vortex O3 in November. We examined the hypothesis that this correlation exists because there is a seasonally persistent level of stratospheric wave
10
activity from late fall through the winter into March in the NH, but have not been able to demonstrate this hypothesis. A persistent level of wave activity may reflect the de-pendence of the efficiency of wave driving on the mean flow of the stratosphere, which varies on annual and quasi-biennial time scales, but we have been unable to sub-stantiate this hypothesis using common dynamical diagnostic quantities and/or model
15
simulation. The 100-mbar heat flux averaged over 40–75◦N (Newman et al., 2001) for January, February, or March is not significantly correlated with that quantity in Novem-ber for either 1979– or 1990–2003. The heat flux in NovemNovem-ber does not, however, explain a majority of the temperature or ozone variance at this time, consistent with the understanding that radiative and chemical processes primarily control the temperature
20
and O3distributions in the fall season. We also examined diagnostics related to radia-tive cooling in fall (TNov,∆TSept−Nov) with November heat flux and O3, but did not find any significant correlations.
Two available multi-annual model simulations do not shed much light on the observed correlation either. Neither a 35-year, off-line O3 run using parameterized, gas-phase
25
chemistry and meteorology from a general circulation model (Ma et al., 2004), nor a similar 50-year run with full stratospheric chemistry showed a significant correlation between November vortex O3 and March column average as observed. This also ar-gues against the persistent wave activity hypothesis and suggests that either interactive
ACPD
5, 155–178, 2005Fall vortex ozone S. R. Kawa et al. Title Page Abstract Introduction Conclusions References Tables Figures J I J I Back Close
Full Screen / Esc
Print Version
Interactive Discussion
EGU
O3/dynamics is required or the models lack representation of key processes, e.g., the quasi-biennial oscillation (QBO).
Several previous works also bear on this hypothesis. Fioletov and Shepherd (2003) show that mid latitude (35–60◦) total O3has seasonally persistent interannual anoma-lies from November through the NH winter and up to the following October. They
5
attribute this to persistence of variability in the wintertime O3 buildup (with constant photochemical decay). As discussed above, however, we did not find a significant cor-relation between November and March total O3 for latitudes greater than 63◦. Salby and Callaghan (2002) relate total O3 from 10 to 90◦ to winter polar temperatures and anomalies in the residual circulation. They conclude that anomalous residual
circula-10
tion, driven primarily by E-P flux from the troposphere and to a lesser degree by the QBO, plus a chemical term mainly related to aerosol abundance, accounts for virtually all of the March O3variation. Nonlinear feedbacks of O3variation on the residual circu-lation are found to be a minor secondary contribution. They also find that the November to March O3 tendency anomaly is determined almost entirely by the March anomaly,
15
i.e., November O3 variance is small. Gray et al. (2001) suggest that the efficiency of the tropospheric wave driving is influenced by the mean flow state of the stratosphere. They find NH mid winter polar temperatures correlated with upper stratosphere equa-torial winds in September and October. This suggests that waves may have a larger impact at higher latitudes during tropical easterlies. That is, the efficiency of the wave
20
event may be improved when we have easterlies in the tropical upper stratosphere. This mechanism may play a role in producing our observed O3correlations.
5. Conclusions
We have examined the interannual variability of O3 in fall and spring at high northern latitudes. The interannual variations of NH O3 abundances in the lower to mid
strato-25
spheric vortex in November from POAM and SBUV data (1993–2003 and 1978–2003, respectively) are apparently correlated with high latitude average total column O3 in
ACPD
5, 155–178, 2005Fall vortex ozone S. R. Kawa et al. Title Page Abstract Introduction Conclusions References Tables Figures J I J I Back Close
Full Screen / Esc
Print Version
Interactive Discussion
EGU
the following March (r=0.7 or greater). March O3is known to be a clear indicator of the level of wintertime stratospheric wave activity. The cause of the correlation with mid-to-lower stratosphere vortex O3 in November is not clear. The connection does not appear to be the result of a seasonally persistent O3anomaly or wave activity through the NH late fall and winter. We do not find a correlation of the November O3 data
5
with dynamical indicators from standard meteorological analysis data in fall. Whether this is because the data are not precise enough, we have not found the appropriate diagnostic quantity, or the correlation is a result of some unrelated phenomenon is not known. The 24-year time series of March total O3data shows a shift in the level of vari-ability between the 1980s and 1990–2004. The later years have more varivari-ability and
10
include significantly lower values consistent with the observed interannual variability in the stratospheric meteorology. Total March O3 in the 1980s has higher amounts, less variability, and the fall-spring correlation is not as strong as in the later years. Under-standing these variations, their correlations, and the physical processes behind them is important to our ability to predict O3in the future with changing climate and source
15
gases.
Acknowledgements. We would like to acknowledge helpful discussion with D. Waugh and
S. Pawson. We thank S. Frith and P. K. Bhartia for help and advice in using SBUV and SBUV/2 data, and J. E. Rosenfield for radiative transfer test calculations. This work has been supported by the NASA Atmospheric Chemistry Modeling and Analysis Program.
20
References
Angell, J. K.: Impact of El Chichon and Pinatubo on ozonesonde profiles in north extratropics, Geophys. Res. Lett., 25, 4485–4488, 1998.
Bhartia, P. K., McPeters, R. D., Mateer, C. L., Flynn, L. E., and Wellemeyer, C.: Algorithm for the estimation of vertical ozone profiles from the backscattered ultraviolet technique, J.
25
Geophys. Res., 101, 18 793–18 806, 1996.
ACPD
5, 155–178, 2005Fall vortex ozone S. R. Kawa et al. Title Page Abstract Introduction Conclusions References Tables Figures J I J I Back Close
Full Screen / Esc
Print Version
Interactive Discussion
EGU Ultraviolet (SBUV) version 8 profile algorithm, Proc. Quad. Ozone Symp., 295–296, Kos,
Greece, 1–8 June, 2004.
Chipperfield, M. P. and Jones, R. L.: Relative influences of atmospheric chemistry and transport on Arctic ozone trends, Nature, 400, 551–554, 1999.
Coy, L., Nash, E. R., and Newman, P. A.: Meteorology of the polar vortex: Spring 1997,
Geo-5
phys. Res. Lett., 24, 2693–2696, 1997.
Fioletov, V. E. and Shepherd, T. G.: Seasonal persistence of midlatitude total ozone anomalies, Geophys. Res. Lett., 30(7), doi:10.1029/2002GL016739, 2003.
Fusco, A. C. and Salby, M. L.: Interannual variations of total ozone and their relationship to variations of planetary wave activity, J. Climate, 12, 1619–1629, 1999.
10
Gray, L. J., Phipps, S. J., Dunkerton, T. J., Baldwin, M. P., Drysdale, E. F., and Allen, M. R.: A data study of the influence of the equatorial upper stratosphere on northern-hemisphere stratospheric sudden warmings, Q. J. R. Meteorol. Soc., 127, 1985–2003, 2001.
Hood, L. L., McCormack, J. P., and Labitzke, K.: An investigation of dynamical contributions to midlatitude ozone trends in winter, J. Geophys. Res., 102, 13 079–13 093,1997.
15
Hoppel, K., Bevilacqua, R., Nedoluha, G., et al.: POAM III observations of arctic ozone loss for the 1999/2000 winter, J. Geophys. Res., 107, doi:10.1029/2001JD001112, 2002.
Kalnay, M. E., Kanamitsu, M., Kistler, R., et al.: The NCEP/NCAR reanalysis project, Bull. Am. Meteorol. Soc., 77, 437–471, 1996.
Kawa, S. R., Bevilacqua, R. M., Margitan, J. J., Douglass, A. R., Schoeberl, M. R.,
Hop-20
pel, K. W., and Sen, B.: Interaction between dynamics and chemistry of ozone in the setup phase of the Northern Hemisphere polar vortex, J. Geophys. Res., 107, 8310, doi:10.1029/2001JD001527, 2002.
Labitzke, K.: Interannual variability of the winter stratosphere in the northern hemisphere, Mon. Wea. Rev., 105, 762–770, 1977.
25
Labitzke, K.: On the interannual variability of the middle stratosphere during the northern winter, J. Meteorol. Soc. Japan, 60, 124–138, 1982.
Lucke, R. L., Korwan, D. R., Bevilacqua, R. M., et al.: The Polar Ozone and Aerosol Mea-surement (POAM) III instrument and early validation results, J. Geophys. Res., 104, 18 785– 18 799, 1999.
30
Lumpe, J. D., Bevilacqua, R. M., Hoppel, K. W., and Randall, C. E:. POAM III retrieval algorithm and error analysis, J. Geophys. Res., 107(D21), doi:10.1029/2002JD002137, 2002.
ACPD
5, 155–178, 2005Fall vortex ozone S. R. Kawa et al. Title Page Abstract Introduction Conclusions References Tables Figures J I J I Back Close
Full Screen / Esc
Print Version
Interactive Discussion
EGU S., and Lin, S. J.: Interannual variability of stratospheric trace gases: Role of extratropical
wave driving, Q. J. R. Meteorol. Soc., 130, 2459–2474, 2004.
Manney, G. L., Froideveaux, L., Santee, M. L., Zurek, R. W., and Waters, J. W.: MLS observa-tions of Arctic ozone loss in 1996–1997, Geophys. Res. Lett., 24, 2697–2700, 1997.
Manney, G. L., Sabutis, J. L., and Swinbank, R. L.: A unique stratospheric warming event in
5
November 2000, Geophys. Res. Lett., 28, 2629–2632, 2001.
McPeters, R. D., Miles, T., Flynn, L. E., Wellemeyer, C. G., and Zawodny, J. M.: Comparison of SBUV and SAGE-II ozone profiles – implications for ozone trends, J. Geophys. Res., 99, 20 513–20 524, 1994.
Miller, A. J., Nagatani, R. M., Flynn, L. E., et al.: A cohesive total ozone data set from the SBUV
10
(/2) satellite system, J. Geophys. Res., 107(D1), 4701, doi:10.1029/2001JD000853, 2002. Nash, E. R., Newman, P. A., Rosenfield, J. E., and Schoeberl, M. R.: An objective determination
of the polar vortex using Ertel’s potential vorticity, J. Geophys. Res., 10, 9471–9478, 1996. Newman, P. A., Gleason, J. F., McPeters, R. D., and Stolarski, R. S.: Anomalously low ozone
over the Arctic, Geophys. Res. Lett., 24, 2689–2692, 1997.
15
Newman, P. A., Nash, E. R., and Rosenfield, J. E.: What controls the temperature of the Arctic stratosphere during spring?, J. Geophys. Res., 106, 19 999–20 010, 2001.
Newman, P. A., Harris, N. R. P., Adriani, A., et al.: An overview of the SOLVE-THESEO 2000 campaign, J. Geophys. Res., 107 (D20), art. no. 8259, 2002.
Pawson, S. and Naujokat, B.: The cold winters of the middle 1990s in the northern lower
20
stratosphere, J. Geophys. Res., 104, 14 209–14 222, 1999.
Planet, W. G., Miller, A. J., DeLuisi, J. J., Hofmann, D. J., Oltmans, S. J., Wild, J. D., McDermid, I. S., McPeters, R. D., and Connor, B. J.: Comparison of NOAA-11 SBUV/2 ozone vertical profiles with correlative measurements, Geophys. Res. Lett., 23, 293–296, 1996.
Randel, W. J., Wu, F., and Stolarski, R. S.: Changes in column ozone correlated with the
25
stratospheric EP flux, J. Met. Soc. Japan, 80, 849–862, 2002.
Randall, C. E., Rusch, D. W., Bevilacqua, R. M., et al.: Validation of POAM III ozone: Comparisons with ozonesonde and satellite data, J. Geophys. Res., 108 (D12), 4367, doi:10.1029/2002JD002944, 2003.
Rosenfield, J. E., Newman, P. A., and Schoeberl, M. R.: Computations of diabatic descent in
30
the stratospheric polar vortex, J. Geophys. Res., 99, 16 677–16 689, 1994.
Rosenfield, J. E.: Effects of volcanic eruptions on stratospheric ozone recovery, in: Volcanism and the Earth’s Atmosphere, AGU Monographs, edited by: Robock, A. and Oppenheimer,
ACPD
5, 155–178, 2005Fall vortex ozone S. R. Kawa et al. Title Page Abstract Introduction Conclusions References Tables Figures J I J I Back Close
Full Screen / Esc
Print Version
Interactive Discussion
EGU C., AGU, Washington, D.C., 139, 227–236, 2003.
Rosenlof, K. H. and Holton, J. R.: Estimates of the stratospheric residual circulation using the downward control principle, J. Geophys. Res., 98, 10 465–10 479, 1993.
Rusch, D. W., Bevilacqua, R. M., Randall, C. E., et al.: Validation of POAM II ozone mea-surements with coincident MLS, HALOE, and SAGE II observations, J. Geophys. Res., 102,
5
23,615–23,627, 1997.
Salby, M. L. and Callaghan, P. F.: Interannual changes of the stratospheric circulation: Rela-tionship to ozone and tropospheric structure, J. Clim., 15, 3673–3685, 2002.
Schoeberl M. R., Lait, L. R., Newman, P. A., and Rosenfield, J. E.: The structure of the polar vortex, J. Geophys. Res., 97, 7859–7882, 1992.
10
Solomon, S.: Stratospheric ozone depletion: A review of concepts and history, Rev. Geophys., 37, 275–316, 1999.
Swinbank, R. and O’Neill, A.: A stratosphere-troposphere data assimilation system, Mon. Weather Rev., 122, 686–702, 1994.
Waugh, D. W., Randel, W. J., Pawson, S., Newman, P. A., and Nash, E. R.: Persistence of the
15
lower stratospheric polar vortices, J. Geophys. Res, 104, 27 191–27 201, 1999.
World Meteorological Organization (WMO): Scientific Assessment of Ozone Depletion: 2002, Global Ozone Res. And Monit. Proj., Geneva, 2003.
ACPD
5, 155–178, 2005Fall vortex ozone S. R. Kawa et al. Title Page Abstract Introduction Conclusions References Tables Figures J I J I Back Close
Full Screen / Esc
Print Version
Interactive Discussion
EGU
Table 1. POAM data used in annual averages.
POAM II POAM III
Year 1993 1994 1995 1996 1998 1999 2000 2001 2002 2003
Nov. Dates 3–30 1–30 1–30 1–13 1–30 2–30 2–30 1–30 3–30 1–30
# of data days 15 30 30 12 29 24 25 30 20 30
ACPD
5, 155–178, 2005Fall vortex ozone S. R. Kawa et al. Title Page Abstract Introduction Conclusions References Tables Figures J I J I Back Close
Full Screen / Esc
Print Version
Interactive Discussion
EGU
High Latitude (63
o-90
o) Average
1970
1975
1980
1985
1990
1995
2000
2005
Year
200
250
300
350
400
450
500
Total O
3(DU)
NH March
SH October
Fig. 1. Time series of average total O3from TOMS measurements at high latitudes in March and October. See Newman et al. (1997) for instrument data sources. Data after 1997 are from EP-TOMS.
ACPD
5, 155–178, 2005Fall vortex ozone S. R. Kawa et al. Title Page Abstract Introduction Conclusions References Tables Figures J I J I Back Close
Full Screen / Esc
Print Version
Interactive Discussion
EGU
POAM: Eq. Latitude= 77.5
0
1
2
3
4
5
O
3(ppmv)
500
Potential Temperature (K)
100
10
1993-11-01 - 30 1994-11-01 - 30 1995-11-01 - 30 1996-11-01 - 13 1998-11-01 - 30 1999-11-01 - 30 2000-11-01 - 30 2001-11-01 - 30 2002-11-01 - 30 2003-11-01 - 30Fig. 2. Interannual variation of average November O3 profiles from POAM at equivalent lati-tudes 75–80◦, which is inside the northern polar vortex in each year. Right axis corresponds to approximate average pressure for the potential temperature levels.
ACPD
5, 155–178, 2005Fall vortex ozone S. R. Kawa et al. Title Page Abstract Introduction Conclusions References Tables Figures J I J I Back Close
Full Screen / Esc
Print Version Interactive Discussion EGU NOAA 11 SBUV/2 v.8 0 1 2 3 4 5 6 7 O3 (ppmv) 500 100 10
Avg. Pressure (mbar)
500 800 Potential Temperature (K) 0.0 4.0e-05 MPV-UKM (K m 2/kg-s) 1999-11-30z12 500 K 0.0 4.0e-05 MPV-UKM (K m 2/kg-s) 1999-11-30z12 650 K 0.0 4.0e-05 MPV-UKM (K m 2/kg-s) 1999-11-30z12 800 K
Fig. 3. SBUV NH O3profile measurements for one day. O3profiles at latitudes greater than 50◦ are plotted and color coded according to their potential vorticity at 650 K . Vertical resolution of O3profiles reflects data reported in SBUV layers mapped to potential temperature using UKMO meteorological analysis.
ACPD
5, 155–178, 2005Fall vortex ozone S. R. Kawa et al. Title Page Abstract Introduction Conclusions References Tables Figures J I J I Back Close
Full Screen / Esc
Print Version Interactive Discussion EGU 1980 1985 1990 1995 2000 2005 Year 340 360 380 400 420 440 460 480
March Polar Average O
3 (DU) 2.8 3.0 3.2 3.4 3.6 3.8
Prior November Vortex O
3 (ppmv) 600 K 650 K 700 K TOMS SBUV POAM
Fig. 4. Time series comparison of TOMS March average total O3from Fig. 1 (solid black line, left axis) and vortex-averaged O3 data in November (colored lines, right axis) for the entire TOMS, SBUV, and POAM data records. POAM data (asterisk symbols, dashed lines) are shown for 3 potential temperatures. Only one potential temperature level is shown for SBUV (plus symbols, dotted line) with its lower resolution in the vertical (cf., Fig. 3).
ACPD
5, 155–178, 2005Fall vortex ozone S. R. Kawa et al. Title Page Abstract Introduction Conclusions References Tables Figures J I J I Back Close
Full Screen / Esc
Print Version Interactive Discussion EGU
600 K
3.0
3.2
3.4
3.6
3.8
November Vortex O
3
(ppmv)
340
360
380
400
420
440
460
480
March Polar O
3
(DU)
79
80
82
83
84
85
86
87
88
89
90
91
92
93
94
95
96
97
98
99
00
01
02
03
04
r= 0.69
Fig. 5. Correlation plot for March total O3 and November vortex averaged O3 at 600 K from SBUV data. Symbols for years after 1990, other than 1993, are colored blue.
ACPD
5, 155–178, 2005Fall vortex ozone S. R. Kawa et al. Title Page Abstract Introduction Conclusions References Tables Figures J I J I Back Close
Full Screen / Esc
Print Version
Interactive Discussion
EGU
Nov POAM, March TOMS
0.0 0.2 0.4 0.6 0.8 1.0 Correlation Coefficient 1000 500 1000 Potential Temperature (K) 100 10
Avg. Pressure (mbar)
Fig. 6. Profile of the correlation coefficient between POAM November vortex average O3and TOMS high latitude average total O3in March.