HAL Id: hal-02151669
https://hal.archives-ouvertes.fr/hal-02151669
Submitted on 15 Jan 2020
HAL is a multi-disciplinary open access archive for the deposit and dissemination of sci-entific research documents, whether they are pub-lished or not. The documents may come from teaching and research institutions in France or abroad, or from public or private research centers.
L’archive ouverte pluridisciplinaire HAL, est destinée au dépôt et à la diffusion de documents scientifiques de niveau recherche, publiés ou non, émanant des établissements d’enseignement et de recherche français ou étrangers, des laboratoires publics ou privés.
Anti-tumor efficacy of hyaluronan-based nanoparticles
for the co-delivery of drugs in lung cancer
Victor Jeannot, Cony Gauche, Silvia Mazzaferro, Morgane Couvet, Laetitia
Vanwonterghem, Maxime Henry, Chloé Didier, Julien Vollaire, Veronique
Josserand, Jean-Luc Coll, et al.
To cite this version:
Victor Jeannot, Cony Gauche, Silvia Mazzaferro, Morgane Couvet, Laetitia Vanwonterghem, et al.. Anti-tumor efficacy of hyaluronan-based nanoparticles for the co-delivery of drugs in lung cancer. Journal of Controlled Release, Elsevier, 2018, 275, pp.117-128. �10.1016/j.jconrel.2018.02.024�. �hal-02151669�
Anti-tumor efficacy of hyaluronan-based nanoparticles for the co-delivery of drugs in lung cancer
Victor Jeannota, Cony Gaucheb, Silvia Mazzaferrob, Morgane Couveta, Laetitia Vanwonterghema, Maxime Henrya, Chloé Didiera, Julien Vollairea, Véronique Josseranda, Jean-Luc Colla, Christophe Schatzb, Sébastien Lecommandouxb, Amandine Hurbina
a Cancer Target and Experimental Therapeutics, Institute for Advanced Biosciences, INSERM U1209, CNRS UMR5309, Univ. Grenoble Alpes, Grenoble, France
b Laboratoire de Chimie des Polymères Organiques, CNRS UMR5629, Pessac, France jeannot.victor@laposte.net conygauche@gmail.com silviamazzaferro@hotmail.it morgane.couvet@inserm.fr laetitia.vanwonterghem@univ-grenoble-alpes.fr maxime.henry@univ-grenoble-alpes.fr chloe.didier@univ-grenoble-alpes.fr Julien.Vollaire@univ-grenoble-alpes.fr veronique.josserand@univ-grenoble-alpes.fr jean-luc.coll@univ-grenoble-alpes.fr schatz@enscbp.fr lecommandoux@enscbp.fr amandine.hurbin@inserm.fr Corresponding authors:
Amandine Hurbin. Cancer Target and Experimental Therapeutics, Institute for Advanced Biosciences, INSERM U1209, CNRS UMR5309, Univ. Grenoble Alpes, Allée des Alpes, 38700 La Tronche, France. Tel: 334 76 54 95 53. Fax: 334 76 54 94 13. Email: amandine.hurbin@inserm.fr
Christophe Schatz. CNRS UMR5629, Laboratoire de Chimie des Polymères Organiques, 16 avenue Pey Berland, 33607 Pessac, France. Tel: 335 40 00 36 96. Fax: 335 40 00 84 87. Email: schatz@enscbp.fr
*Revised Manuscript - include embeded figures/tables and also seperate figures/tables Click here to view linked References
Abstract
Combinations of therapeutic agents could synergistically enhance the response of lung cancer cells. Co-delivery systems capable of transporting chemotherapeutics with different physicochemical properties and with the simultaneous release of drugs remain elusive. Here, we assess the ability of nanoparticles of 30-nm diameter obtained from the self-assembly of hyaluronan-based copolymer targeting CD44 receptors to encapsulate both gefitinib and vorinostat for effective combinational lung cancer treatment. Drug loading was performed by nanoprecipitation. Drug release experiments showed a slow release of both drugs after 5 days. Using two- and three-dimensional lung adenocarcinoma cell cultures, we observed that the nanoparticles were mostly found at the periphery of the CD44-expressing spheroids. These drug-loaded nanoparticles were as cytotoxic as free drugs in the two- and three-dimensional systems and toxicity was due to apoptosis induction. In mouse models, intravenous injection of hyaluronan-based nanoparticles showed a selective delivery to subcutaneous CD44-overexpressing tumors, despite a significant liver capture. In addition, the systemic toxicity of the free drugs was reduced by their co-delivery using the nanoparticles. Finally, intrapulmonary administration of drug-loaded nanoparticles, to avoid a possible hepatic toxicity due to their accumulation in the liver, showed a stronger inhibition of orthotopic lung tumor growth compared to free drugs. In conclusion, hyaluronan-based nanoparticles provide active targeting partially mediated by CD44, less-toxic drug release and improved antitumor efficiency.
Keywords:
Introduction
Lung cancer is the leading cause of cancer-related adult deaths worldwide.[1] Improved understanding of the molecular changes that drive tumor progression has revolutionized the clinical management of non-small cell lung cancer (NSCLC). In lung cancers with epidermal growth factor receptor (EGFR)-activating mutations, anti-EGFR therapies, including gefitinib, erlotinib, and afatinib, have been shown to improve progression-free survival and were approved as first-line options.[2, 3] For patients without targetable oncogenic driver mutations representing 60% of NSCLC cases, first-line treatment with standard chemotherapy agents (i.e. cisplatin and permetrexed or docetaxel) is still the standard of care.[3] The chemotherapy agents, docetaxel and pemetrexed, and the EGFR-TKIs erlotinib and gefitinib are approved for the second- and third-line treatment of advanced NSCLC, or as maintenance therapy. The role of EGFR-TKIs as second- and third-line therapy for patients with EGFR wild-type tumors remains controversial, and highlighted the existence of intrinsic resistance mechanisms.[4] Despite continuous improvements in cancer treatments, the prognosis is poor, and the development of new approaches is urgently needed. Combinations of targeted agents might be exploited to inhibit more than one pathway and could be significantly more effective in achieving tumor regression than single therapeutic agents. We and others contributed to establish that combination treatment with histone deacetylase inhibitors and EGFR-TKIs synergistically leads to more effective treatments.[5-9]
Major efforts have been made to generate nanovectors that will deliver the therapeutic molecules specifically to the tumor sites, protect them from degradation, allow better spatiotemporal release and thus limit their side effects.[10] Co-delivery of therapeutic agents exhibiting synergy into a single nanocarrier is difficult owing to the different physicochemical properties of each agent. Polymeric micellar nanostructures, and especially polymeric vesicles also referred as polymersomes, are powerful tools in terms of efficacy, specificity, and controlled release of both hydrophilic and hydrophobic molecules.[11-13] In this context, we previously developed glycopolypeptide-based nanocarriers[14-16] that combined the natural polysaccharide hyaluronan, known for its relative affinity toward CD44 receptors that are up-regulated on some cancer cells and involved in tumor growth, progression and metastasis, and poly( -benzyl-L-glutamate) (PBLG), a biodegradable polypeptide characterized by an ordered secondary structure
(α-helix).[17, 18] These nanoparticles (NP) showed active targeting of CD44-overexpressing lung tumor cells in vitro and in vivo,[19] suggesting that they could be used as a targeted drug-delivery system.
In the present study, we report the synthesis, loading and efficacy of hyaluronan-based NP for the delivery of a combination of vorinostat, a histone deacetylase inhibitor, with gefitinib, an EGFR-TKI. These drug-loaded nanoparticles (DLNP) were tested in NSCLC cells expressing different levels of CD44, cultured in two-dimensions (2D) and three-dimensions (3D spheroids). In addition, their toxicity and therapeutic effects were evaluated in vivo using an orthotopic tumor model of NSCLC in nude mice.
Methods
Materials
Hyaluronan (5000 g/mol) was from Lifecore Biomedical; near infrared dye Dy-700 was from Life Technologies. Vorinostat (SAHA, MK0683), and gefitinib (ZD1839) were obtained from Selleckchem (Munich, Germany). γ-benzyl-L-glutamate N-carboxyanhydride (NCA-BLG) was purchased from Isochem (France) and use as received.
Copolymer synthesis and characterization
Synthesis of hyaluronan-b-poly(γ-benzyl-L-glutamate) copolymer by 1,3 Huisgen cycloaddition: As previously described and well characterized by Jeannot et al.,[19] the
synthetic strategy used was based on the coupling reaction between azide-end functionalized poly(γ-benzyl-L-glutamate) (PBLG) having a degree of polymerization of 60 and alkyne-end functionalized hyaluronan of 5000 g/mol using a Huisgen 1,3-dipolar cycloaddition click chemistry reaction in DMSO at 50°C. The copolymer was purified by successive dialysis and ultrafiltration steps against water (yield=60%). The purified copolymer was fully characterized by H1 NMR, FTIR and SEC in DMSO as shown by Jeannot et al.[19]
Copolymer labeling with fluorescent Dy-700 dye: Hya-b-PBLG was labeled as previously
described by Jeannot et al.,[19] and used to obtain labeled nanoparticles. Briefly, the diblock copolymer (1 eq.) was dissolved in anhydrous DMSO (50 mg/mL) and triethylamine (1 eq. per acid function) was added, followed by the addition of 0.1
equivalent of Dy-700, and stirred overnight at room temperature. The reaction mixture was dialyzed against ultrapure water for one day and freeze-dried, protected from light. A labeling efficiency of 10 mol% was measured in DMSO by UV spectroscopy (720 nm) using ε = 90,000 M-1.cm-1according to the manufacturer’s instructions.
Nanoparticle preparation
NP were formulated by a solvent displacement technique (nanoprecipitation), as previously described.[19] To obtain labeled fluorescent nanoparticles, an equimolar mixture of Hya-b-PBLG-Dy-700 and Hya-b-PBLG copolymer was used to obtain 5 mol% of labeled copolymer. A fast nanoprecipitation technique was used to obtain small NP near to 30 nm. Hya-b-PBLG was dissolved in DMSO (10 mg.mL-1) and rapidly mixed with a tenfold volume of phosphate buffer at 50°C using a micropipette. The organic solvent was then removed by dialysis (MWCO 25 kDa) against water for 24 h, with the medium changed every 4 h. The NP were then characterized by static and dynamic light scattering (SLS and DLS) and by transmission electron microscopy (TEM).[19]
Nanoparticle drug loading
DLNP were obtained by a fast nanoprecipitation process. Solutions of Hya-b-PBLG, gefitinib and vorinostat were prepared in DMSO at a concentration of 20 mg.mL-1 for the copolymer and 12 mg.mL-1 for drugs. Then, 0.2 mL of copolymer solution and 0.1 mL of each drug solution were mixed together and added to an excess (1.6 mL) of phosphate buffer at 50°C using a micropipette. Non-encapsulated drug was then removed from the nanoprecipitation medium by dialysis (MWCO 25 kDa) against buffer phosphate for 14 h. The final NP were filtered through 0.22-μm cellulose filter to remove insoluble drug aggregates.
The drug loading content in the NP was determined from the final solution (2 mL) with a copolymer concentration of 2 mg.mL-1. The filtered NP were freeze-dried and dissolved in 2 mL of EtOH. The mixture was stirred by vortex and sonication for 30 min and stirred for another 30 min to ensure drug extraction. Finally, the sample was centrifuged (9160 g, 30 min) and the supernatant analyzed by UV spectroscopy (UV-530 spectrophotometer, Jasco) at = 330 nm for gefitinib and = 240 nm for vorinostat. Quantification of gefitinib and vorinostat was performed from the calibration curve of these drugs in ethanol made in the 96-well plate (0.2 mL/well). Each experiment was carried out in triplicate, and average values were calculated. The drug loading content in the NP is defined herein as the
ratio of the mass of drugs in the NP to the total mass (polymer + drug). The entrapment efficiency was also derived from the ratio of the mass of drugs in particles to the initial mass of drug used for the nanoprecipitation step. For biological tests, samples were stored freeze-dried after the addition of 10% mannitol to ensure complete redispersion. The particles were reconstituted at 2 mg/mL in PBS buffer and filtered on 0.45-µm cellulose membranes before use to remove any traces of polymer aggregates.
In vitro drug release study
The in vitro drug release of gefitinib and vorinostat NP formulations was performed with the as-prepared particle suspension (2 mL) after a dialysis of 14 h against phosphate buffer and a filtration through 0.22-μm cellulose filter to remove non-encapsulated drug. Release experiments were conducted by dialysis (MWCO 25kDa) under sink conditions. The dialysis bag was kept in a beaker containing 50 mL of pH 7.4 phosphate buffer containing 2% ethanol. The beaker was placed on a magnetic stirrer, and the temperature of the assembly was maintained at 37°C throughout the experiment. After defined incubation times, samples (1 mL) were removed and replaced with equal amounts of pH 7.4 phosphate buffer containing 2% ethanol, followed by freeze-drying. The concentration of the released gefitinib and vorinostat contained in the medium was determined by UV analysis after drug extraction, as previously described. Each experiment was carried out in triplicate, and average values were calculated.
Cell culture
The human H322, H358 and A549 NSCLC cell lines were obtained from the American Type Culture Collection (ATCC, Manassas, VA).
2D cell culture: Cells were maintained in RPMI 1640 (Gibco, Cergy Pontoise, France)
supplemented with 10% fetal bovine serum (FBS) in a humidified atmosphere with 5% CO2. We routinely carried out morphology checks on all cell lines, and we only passaged the cell lines for 3 months. All cell lines were routinely tested for the presence of mycoplasma (MycoAlert® Mycoplasma Detection Kit, Lonza, France).
3D cell culture: Spheroids were generated by plating 4000 A549 or 5000 H358 cells/well
into 96-well round bottom Ultra Low Attachment (ULA) spheroid microplates (Corning, Tewksbury, USA). These plates stimulate the spontaneous formation of a single spheroid
of cells within 48 hours. Spheroid culture was performed in RPMI 1640 supplemented with 10% FBS in a humidified atmosphere with 5% CO2. Spheroid formation and growth was assessed by microscopic examination using an inverted microscope and by imaging spheroids at each time point. The volume of each spheroid was measured by MetaMorph software (Molecular Devices, Wokingham, United Kingdom).
In vitro cytotoxicity study
Cell proliferation assays were conducted in 96-well culture plates. 2D-cultured cells and spheroids were cultured for 24 and 72 hours, respectively, prior to treatment in a dose-dependent manner with gefitinib and/or vorinostat in medium containing 10% FBS, or were washed in PBS and treated with NP in serum-free medium. The viability was quantified using CellTiter 96® AQueous One Solution Cell Proliferation Assay (Promega) in monolayer cell culture or using CellTiter-Glo® 3D Cell Viability Assay (Promega) in spheroids. Growth inhibition was expressed as the percentage of surviving drug-treated cells compared to untreated control cells. The drug concentrations required to inhibit cell growth by 50% (IC50) were determined by interpolation from the dose-response curves.
Apoptosis assays
Active caspase-3 cleavage in 2D-cultured cells was detected by flow cytometry using a phycoerythrin-conjugated monoclonal active caspase-3 antibody kit (BD Pharmingen, Le Pont de Claix, France), following the manufacturer’s instructions. The analysis was performed on a BD-Accuri C6 flow cytometer with CFlow-plus software (BD Biosciences). Active caspase-3 was also detected in frozen spheroid sections by immunofluorescence (see “immunofluorescence and microscopy studies” below).
Immunofluorescence and microscopy studies
Immunofluorescence studies were performed on 2D-cultured cells after washing and fixation in 4% paraformaldehyde for 20 min, or on spheroids after washing and fixation overnight at 4°C in 2% paraformaldehyde. Spheroids were embedded in OCT (Optimal cutting temperature), cut into 7-µm sections, mounted on SuperFrost UltraPlus slides (Menzel-Gläser) and rehydrated in PBS-glycine for 20 min. After blocking in 10% goat serum, primary antibodies (Ki67 (Abcam), active caspase-3 (Cell Signaling Technology), or CD44 (Santa Cruz) antibodies) were incubated overnight at 4°C on monolayer cells or spheroid sections, then washed in PBST (0.2% Tween 20 in PBS). Goat anti-mouse Alexa
Fluor 488 conjugated secondary antibodies (Dako) were then incubated for 1 hour. Hoechst counterstained cell nuclei. Fluorescence microscopy was carried out using an LSM710 NLO confocal microscope (Carl Zeiss, Jena, Germany).
Spheroids were washed before Dy-700-labeled nanoparticle incubation for 24 hours at 37°C and 5% CO2. Spheroids were then harvested, washed, fixed and frozen in OCT for embedding. Spectral images were acquired on 7-µm sections with an LSM710 NLO (Carl Zeiss, Jena, Germany) laser scanning confocal microscope. The excitation laser wavelength was 633 nm, and spectral images were acquired from 645 to 723 nm in 9.7 nm steps with a 40X/1.2W Korr C-Apochromat objective lens. Spectra for autofluorescence and Dy-700 were acquired in the same conditions and used for linear spectral unmixing of samples with the software Zen 2010 (Carl Zeiss, Jena, Germany).
In vivo studies
All animal experiments were performed in agreement with the European Economic Community guidelines and the “Principles of Laboratory Animal Care” (NIH publication N 86-23 revised 1985). Animal experiment studies were approved through institutional guidelines and by the European Community for the use of experimental animals (authorization to experiment 00393.02).
NP administration in healthy mice: Anesthetized (isoflurane/air 4% for induction and 1.5%
thereafter) healthy female NMRI nude mice (Janvier, Le Genest, Saint Isle, France) were daily injected intravenously via the tail vein with 200 µL of vehicle (1X PBS, control), Dy-700 labeled NP (2 mg/mL), gefitinib and vorinostat-loaded NP (DLNP 2 mg/mL), or gefitinib and vorinostat at the same concentration as encapsulated in NP (72 µg/mL gefitinib and 5.2 µg/mL vorinostat) for 11 days. Mice were observed and weighed daily, and blood was collected by cardiac puncture at the end of the experiment for further analysis. Biochemistry analysis of blood samples was performed using a Dimension Vista® System automate following manufacturer’s instructions.
NP biodistribution in vivo: Female NMRI nude mice (6–8 weeks old, Janvier, Le
Genest-Saint Isle, France) were injected subcutaneously in the flank with 20×106 H358 or H322 cells, or 10×106 A549 cells in PBS. Tumor size was measured twice a week using a caliper, and the tumor volume was calculated as follows: length×(width)2×0.4. When subcutaneous tumors of ~250 mm3 in size were detected, anesthetized mice (isoflurane/air 4% for
induction and 1.5% thereafter) were injected intravenously via the tail vein with 200 µL of Dy-700 labeled NP (8 mg/mL). 2D-fluorescent images and black and white pictures were acquired after administration using a back-thinned CCD camera at -80°C (ORCAII-BT-512 G, Hamamatsu, Massy, France) that was fitted with a long-pass RG 700 filter, as previously described.[19] After 24 h, mice were sacrificed, and some organs and tumors were collected for ex vivo imaging. Semiquantitative data were obtained using the Wasabi® software (Hamamastsu, Massy, France) by drawing regions of interest (ROIs) on the different organs and were expressed as the number of Relative Light Units per pixel per unit of exposure time and relative to the fluorescence signal in the skin.
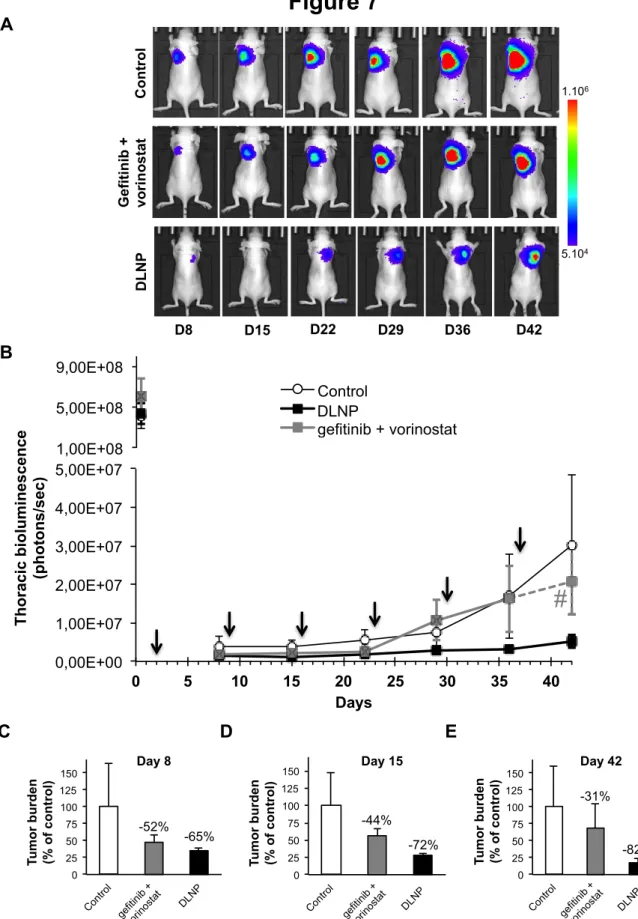
Antitumor efficacy of DLNP in mice with orthotopic lung tumor: Luciferase-modified
human A549 NSCLC cells (A549-Luc cells) were suspended in medium with 10 mM EDTA and 4 mg/mL Matrigel (BD Biosciences) at 5.106 cells/50 µL. Six-week-old female BALB/c nude mice (Janvier, Le Genest, Saint Isle, France) were anesthetized (isoflurane/air 4% for induction and 1.5% thereafter), and the cells were inoculated in the lungs via the airways as previously described.[19] Tumor growth was followed by in vivo bioluminescence imaging (IVIS Kinetic, Perkin-Elmer) 10 min after the intraperitoneal injection of 150 mg/kg of Luciferin (Promega, Charbonnières, France), as previously described.[19]
The A549-Luc cells inoculated nude mice were randomly divided into 3 groups of 10 mice: a control group and DLNP and drug-alone treated groups. Intrapulmonary administration of 50 µL of gefitinib and vorinostat-loaded nanoparticles (2 mg/mL in 1X PBS) or gefitinib and vorinostat combination at the same concentration as encapsulated in nanoparticles (72 µg/mL gefitinib and 5.2 µg/mL vorinostat in 1X PBS/0.2% DMSO) was performed using a nebulizing IA-1C Microspayer (Penn-Centur, Inc., PA, USA) connected to a FMJ-250-high-pressure syringe (Penn-Centur, Inc.) in anesthetized mice (isoflurane/air 4% for induction and 1.5% thereafter). The tip of the microsprayer was introduced into the trachea of the animals using a dedicated laryngoscope. DLNP and drugs alone were nebulized 2 days after inoculation of cells in the lungs, to let animals recover from tumor cells implantation, and then once a week. Mice were observed and weighed three times a week. Tumor growth was followed by in vivo bioluminescence imaging. Mice without any thoracic bioluminescence signal at day 8, or with only tracheal bioluminescence, were excluded from the in vivo bioluminescence imaging analysis. Tumor burden was estimated as the mean of the in vivo bioluminescence signal. Tumor
doubling time was calculated according the formula: 34 x Ln(2) / (Ln(Bioluminescence at day 42) / (Bioluminescence at day 8). After 7 weeks, mice were sacrificed, and blood samples were collected by cardiac puncture for biochemistry analysis (Charles River Laboratory, MA, USA). Lungs were collected for immunohistochemistry analyses.
Immunohistochemistry
Lungs were frozen and sections of a 7-μm thickness were fixed with 4% paraformaldehyde, stained with hematoxylin and eosin (HE) or incubated overnight at 4°C with antibodies. Immunohistochemical staining of Ki67 and cleaved caspase-3 was performed as previously described.[20] Lung sections were observed under a Zeiss AxioImager M2 microscope.
Statistical analyses
Statistical comparisons were made using a Mann-Whitney U-test or analysis of variance test. Two-sided p values ≤0.05 were considered statistically significant. All analyses were performed using the Statview software (Abacus Concept, Berkeley, CA, USA).
Results and Discussion
Preparation and characterization of copolymer nanoparticles
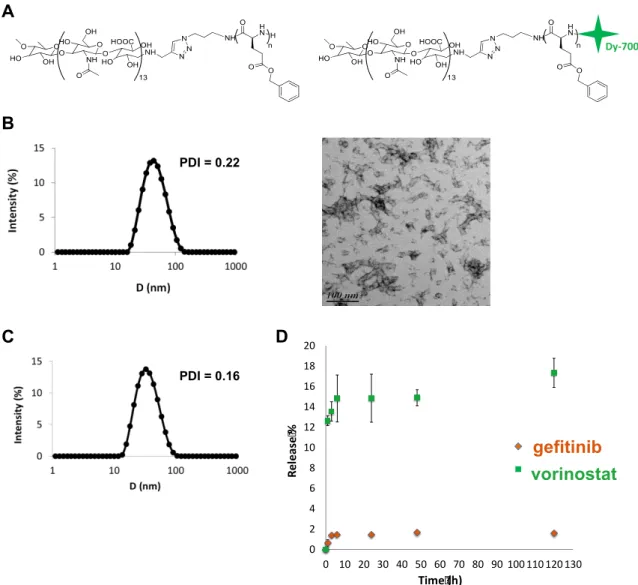
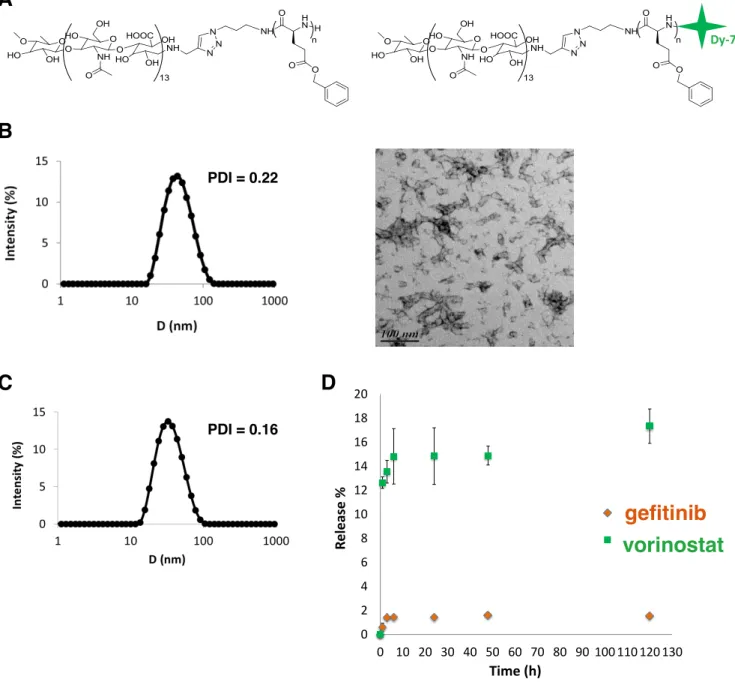
The copolymer synthesis and self-assembly were adapted from a previously reported publication.[19] Briefly, chemically modified hydrophilic hyaluronan (5,000 g.mol-1) was covalently linked to a hydrophobic polypeptide, the poly(y-benzyl-L-glutamate), (PBLG, DP 60) using the 1,3 Huisgen cycloaddition. Hya-b-PBLG60 was then modified by a coupling reaction using the primary amine of PBLG and a dye probe (Dy-700) bearing a maleimide function to obtain a fluorescent copolymer (Figure 1A).[19] Block copolymer NP were prepared through a fast nanoprecipitation approach where the polymer solution in DMSO at 50°C is quickly added to a large excess of PBS buffer pH 7.4, which is a non-solvent of the block copolymer. Under such conditions, block copolymer chains experience a phenomenon of so-called supersaturation, where the actual polymer concentration in the medium becomes much higher than the polymer solubility in same conditions. As a consequence, block copolymer chains undergo a rapid desolvation, leading to the formation of small nuclei that can grow through association with copolymer chains that remain in solution or by particle aggregation.[21] Block copolymer NP grow until a dense
overlapping hyaluronan brush layer is formed on the surface of the particle, which hinders further chain exchange or interparticle fusion.[22] A key parameter of the process is the mixing time of the organic solution with the aqueous phase, which determines the local supersaturation value and subsequent conditions of nanoprecipitation. In general, the lower the mixing time, the higher the nucleation rate and the smaller the particles.[23] Here, monodispersed spherical nanoparticles of 30 nm were obtained by fast nanoprecipitation. They were fully characterized by static and dynamic light scattering (SLS and DLS), transmission electron microscopy (TEM) as reported previously (Figure 1B).[19] This small particle size was related to both the fast mixing protocol, which guarantees uniform supersaturation in the solution and therefore homogeneous conditions for nanoprecipitation, and to the presence of hyaluronan blocks, which act as efficient stabilizers through an electrosteric mechanism. The weight-average molecular weight of NP determined by SLS was 1.3 106 g/mol. This corresponds to approximately 75 copolymer chains per nanoparticle. TEM analysis evidenced the presence of NP clusters, which result from the increase in particle concentration during the drying step. These clusters are forming weak structures that are only observed after solvent removal since any insoluble aggregates could be detected by DLS in solution. By looking closely at the TEM picture, it can be seen that the particles are spherical with a typical size close to 30 nm, consistent with the diameters determined by DLS.
Drug loading and release
Drug loading was performed by the same nanoprecipitation method used for empty block copolymer particles but in the presence of gefitinib and vorinostat. While the drug loading (ratio of the mass of drugs in NP to the total mass) of gefitinib was quite satisfactory (7.3 %), this was not the case with vorinostat, where a loading content of 0.35% was obtained. On the other hand entrapment efficiencies (mass of encapsulated drug) of 24.5% and 1.2% were found respectively for gefitinib and vorinostat. To achieve a high drug loading content, the precipitation times of the copolymer and drugs needed to match to favor the simultaneous co-precipitation of components.[24] The water-solubility of vorinostat (0.0716 mg/mL) was higher than that of gefitinib (0.027 mg/mL).[25] Its precipitation was thus slower than that of the copolymer and gefitinib, and a large proportion of vorinostat molecules were not incorporated in the NP. The molecules rather formed aggregates that were removed during the filtration step. Particle size and dispersity of DLNP were similar to those observed for empty ones (Figure 1C).
DLNP were lyophilized to improve their long-term stability. Before freeze-drying, 10% (w/v) of mannitol was added to the medium to protect DLNP during freeze-drying and
minimize particle aggregation after redispersion in PBS. Mannitol should not modify the
size and the drug content of DLNP[26]. Drug-release experiments were performed in sink
conditions at 37°C in PBS pH 7.4 containing 2% of ethanol to improve drug solubility in the released medium. Figure 1D evidences poor release of both vorinostat and gefitinib after 5 days. A blank experiment performed in same conditions showed that free drugs are fully released thus evidencing that the dialysis membrane is neither limiting the release nor adsorbing drugs (Supplementary material S1). However, a certain amount of loaded drugs can be lost during the first dialysis of 14 h that was performed right after the particle
Figure 1: Characterization of NP and drug release.
A: Chemical structure of the amphiphilic hyaluronan-b-PBLG copolymer and the Dy-700 end-labeled copolymer. B:
Characterization of block copolymer NP obtained through a fast nanoprecipitation process. From left to right: intensity-weighted size distribution and polydispersity index (PDI) of nanoparticles obtained by DLS analysis at a detection angle of 90°; TEM analysis of dried nanoparticles deposited on a carbon:formwar film coated grid and stained with 1.5% uranyl acetate solution. C: Intensity-weighted size distribution and polydispersity index (PDI) of DLNP after purification obtained by DLS analysis at 90°C. D: Drug release profile at 37°C in PBS pH 7.4 from block copolymer NP encapsulating a combination of gefitinib and vorinostat.
Figure 1
A B Dy-700 C D 0 2 4 6 8 10 12 14 16 18 20 0 10 20 30 40 50 60 70 80 90 100 110 120 130 R el e as e % Time (h) GEF VOR gefitinib vorinostat PDI = 0.22 PDI = 0.16preparation to remove the excess of non-encapsulated drugs (see Methods). In addition, some aggregation of drug loaded particles were observed during dialysis after 24 h, thus limiting the diffusion of the drug (Supplementary material S1). Other reasons behind the poor release are the relatively high hydrophobicity of both drugs, as characterized by log P values of 1.44 (vorinostat) and 3.2 (gefitinib)[25], the possible crystalline state of the drugs within particles or their strong interaction with the PBLG blocks. Whatever the physical origin behind the poor release, which remains to be elucidated, this result emphasizes that block copolymer NP would need to be degraded in the local tumor environment to release their payload. Because typical in vitro drug release experiments do not mimic in vivo
conditions[27-30],further experiments in presence of serum or cathepsin degrading PBLG
blocks are needed to study the release of the drugs.
Analysis of nanoparticle uptake by fluorescence microscopy in spheroids
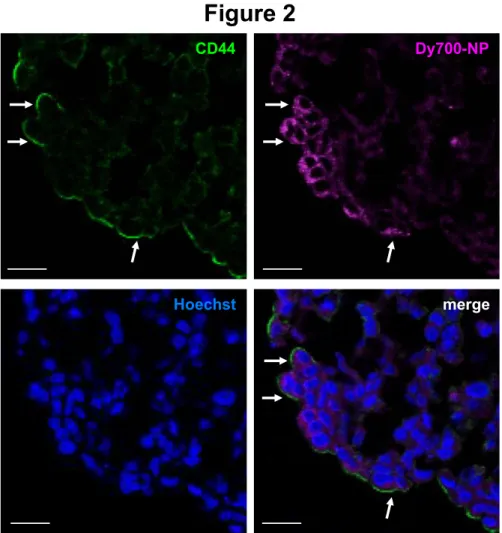
Before assessing NP uptake in spheroids, which mimic solid tumors with appropriate cell-cell interactions as well as gradients of nutrients and oxygen,[31] we first analyzed the expression level of CD44 using confocal microscopy in H358 and A549 NSCLC cells cultured in monolayer or in spheroids. As previously observed by flow cytometry,[19] CD44 expression levels were higher in A549 than in H358 cells in monolayer cell culture (Supplementary material S2). CD44 expression was also strongly detected in A549 cells cultured in spheroids, both at the periphery and within the spheroids. As expected, CD44 was very low in H358 spheroids.
We previously reported the stronger CD44-dependent binding and internalization of these NP in NSCLC A549 compared to H358 cells in 2D cell culture.[19] Here, we assessed Dy-700-labeled NP uptake in A549 and H358 spheroids by microscopy using spectral imaging coupled with image analysis and linear unmixing using the model spectra of the free dye and the surrounding autofluorescence, thus determining the specific location of NP on sections. NP were mostly found at the periphery of the A549 spheroids, with an intracytoplasmic punctate labeling of the peripheral cells (Figure 2 and Supplementary material S2). A faint punctate labeling was also observed in H358 spheroids, but only with stronger laser intensities (Supplementary material S2). When examined by confocal microscopy, Dy-700 NP partially colocalized with CD44 immunostaining in A549 spheroids (Figure 2). Quantification showed that 61% of 700 NP positive cells expressed CD44 (83/135 Dy-700 NP positive cells). A549 cells do not express the receptor for hyaluronan-mediated motility (RHAMM), another receptor of hyaluronan,[32] and according to the level of
expression of CD44 in spheroids and to our previous data,[19] NP uptake appears at least partially correlated to CD44 receptor expression. Further experiments are needed to confirm NP uptake in multicellular tumor spheroids, which will reflect also the tumor microenvironment.
Cytotoxicity of drugs in monolayer cell culture and in spheroids
We first compared the ability of increasing concentrations of gefitinib or vorinostat to inhibit the growth of H358 and A549 cells. As previously observed,[9] the sensitivity to gefitinib dramatically varied when these cells were cultured in 2D or 3D (Supplementary material S3). The IC50 of gefitinib increased from 15 µmol/L in A549 cells in 2D to 25 µmol/L in A549 spheroids (Supplementary materials S3 and S4). In contrast, the IC50 of gefitinib was strongly decreased when H358 cells were in spheroids compared to monolayers (0.2 and 1.3 µmol/L, respectively). These results are in agreement with the literature[33] and highlight that the toxicity of drugs significantly varies when measured in spheroids or in monolayer cell cultures. One explanation should be that the signaling pathways of the drugs are different in 2D and 3D cultures. Accordingly, we observed reduced amounts of phosphorylated- and total-EGFR levels in A549 spheroids, whereas
Figure 2: Uptake of NP by A549 spheroids.
A549 spheroid sections show membrane CD44 expression (in green), the specific binding of Dy-700-labeled NP (Dy-700 NP, in purple) after 24 hours, and their colocalization (merge). Nuclei are stained with Hoechst (in blue). Arrows show CD44 and NP colocalization in the same cells. Scale bars: 20 µm.
Figure 2
CD44 Dy700-NP
the level of expression of EGFR, but not phosphorylated-EGFR, decreased in H358 spheroids (Supplementary material S5). This maintenance of EGFR activity, despite the decreased level of the EGFR protein, could explain the higher sensitivity of H358 spheroids to gefitinib. The IC50 of vorinostat was in the same range in A549 cells in 2D and 3D cultures (1.5-2 and 2.5-3 µmol/L, respectively; Supplementary materials S3 and S4) and did not change in H358 cells (3.5 µmol/L), suggesting that not all drugs have different responses in 2D and 3D culture systems.
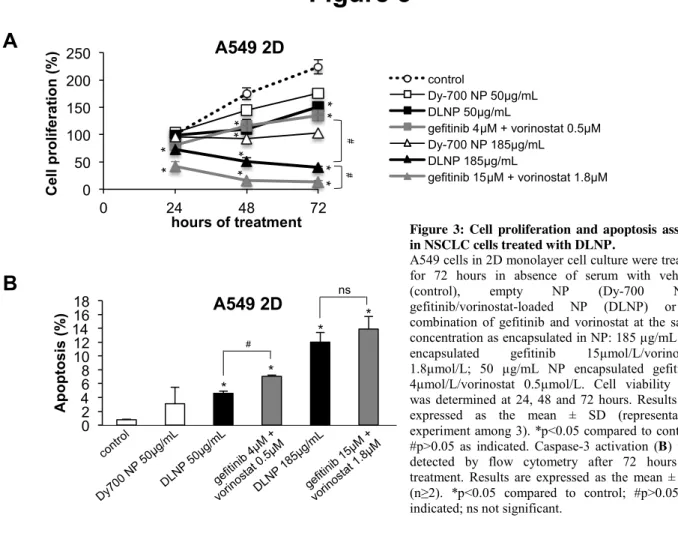
Cytotoxicity of DLNP in monolayer NSCLC cell culture
We previously evidenced that gefitinib and vorinostat synergized in H358 and A549 cells.[7, 9] To investigate whether the simultaneous delivery of drugs by NP promotes efficient therapeutic efficacy, the cytotoxicity and apoptosis induction with NP loaded with gefitinib and vorinostat were assessed. Two different NP concentrations were compared to those of free drugs used. The concentrations were chosen based on the IC50 of gefitinib or vorinostat in 2D cell culture (Supplementary material S4). Empty NP inhibited the viability of A549 cells overtime as compared to control cells (Figure 3A). This could be explained by the strong binding and internalization of empty NP in these NSCLC cells, as previously observed.[19] A549 cells treated with DLNP exhibited a significantly decreased viability over time compared to control cells or cells treated with empty NP (Figure 3A). This effect was dose-dependent. At low concentrations, DLNP were as efficient as free drugs in A549 cells. Conversely, at high concentrations, DLNP were less efficient than free gefitinib and vorinostat. The impact of DLNP on H358 cell viability was approximately the same as those of free drugs, except at 12.5 µg/mL at 72 hours, where it was weaker (Supplementary material S6).
In agreement with the cell proliferation assays, DLNP showed dose-dependent apoptosis induction in A549 cells (Figure 3B). The co-treatment with free gefitinib and vorinostat was slightly more effective than DLNP in inducing caspase-3 cleavage. This was also observed in H358 cells at low concentration, whereas DLNP were more toxic at high concentration (Supplementary material S6). Empty NP did not show significant apoptosis induction in both cell lines (Figure 3B and Supplementary material S6). Taken together, these findings are consistent with the drug sensitivity observed in spheroids (Supplementary materials S3 and S4) and indicate that the inhibition of cell viability by DLNP is associated with an induction of apoptosis, at least in the same range as free gefitinib and vorinostat combination in NSCLC cells cultured in 2D.
Cytotoxicity of DLNP in NSCLC spheroids
In the presence of DLNP, the volumes of A549 spheroids were reduced, but the encapsulated drugs were less efficient than the free drug combination (Figure 4A). The viability of A549 cells in spheroids was affected in a dose-dependent manner after 72 hours of treatment, and the free drugs were more toxic only at higher concentration (Figure 4B). Encapsulated drugs were as efficient as free ones on the volume and cell viability of the H358 spheroids (Supplementary material S7).
These data were further confirmed by immunofluorescence analyses on spheroids. Nuclear protein Ki67 immunostaining did not show significant differences in the number of proliferating cells in A549 spheroids, whatever the treatment (Figure 4C and 4D). Consistently, active caspase-3 labeling in A549 spheroids showed that both free drugs or DLNP induced similar levels of apoptosis (Figure 4E and 4F). In contrast, H358 spheroids treated with the free drugs showed a surprising modest increase in Ki67 immunostaining compared to control or DLNP treatments (Supplementary material S7). A stronger activation of caspase-3 after DLNP treatment than after free drugs treatment was observed (supplementary material S7). * * * ns * # 0 2 4 6 8 10 12 14 16 18 A p o p to si s (% ) A549 2D
Figure 3
A
B
0 50 100 150 200 250 0 24 48 72 C el l p ro lif e ra ti o n ( % ) hours of treatment A549 2D 0 50 100 150 200 250 0 24 48 72 C e ll p ro li fe ra ti o n ( % ) hours of treatment A549 2D control Dy-700 NP 50µg/mL DLNP 50µg/mL gefitinib 4µM + vorinostat 0.5µM Dy-700 NP 185µg/mL DLNP 185µg/mL gefitinib 15µM + vorinostat 1.8µM * * * * * * # # * * * *Figure 3: Cell proliferation and apoptosis assays in NSCLC cells treated with DLNP.
A549 cells in 2D monolayer cell culture were treated for 72 hours in absence of serum with vehicle (control), empty NP (Dy-700 NP), gefitinib/vorinostat-loaded NP (DLNP) or a combination of gefitinib and vorinostat at the same concentration as encapsulated in NP: 185 µg/mL NP encapsulated gefitinib 15µmol/L/vorinostat 1.8µmol/L; 50 µg/mL NP encapsulated gefitinib 4µmol/L/vorinostat 0.5µmol/L. Cell viability (A) was determined at 24, 48 and 72 hours. Results are expressed as the mean ± SD (representative experiment among 3). *p<0.05 compared to control; #p>0.05 as indicated. Caspase-3 activation (B) was detected by flow cytometry after 72 hours of treatment. Results are expressed as the mean ± SD (n≥2). *p<0.05 compared to control; #p>0.05 as indicated; ns not significant.
Figure 4
control Gef 4µM + vori 0.5µM DLNP 50µg/mL
A 54 9 sp h e ro id s Ki6 7 H o ec h st C D 0 1 2 3 4 5 Control Gefitinib 4µM + vorinostat 0.5µM Loaded NP 50µg/mL K i6 7 p o si ti ve c e lls ( % ) A549 spheroids
control Gef 4µM + vori 0.5µM DLNP 50µg/mL
A 54 9 sp h er o id s A ct iv e c as p a se -3 H o ec h s t E F 0 2 4 6 8 10 Control Gefitinib 4µM + vorinostat 0.5µM Loaded NP 50µg/mL % o f a p o p to ti c c e ll s *** ** A549 spheroids DLNP DLNP A B 0 25 50 75 100 125 0 24 48 72 V o lu m e o f sp h er o id s (% o f co n tr o l) Hours of treatment A549 spheroids control loaded NP 50µg/mL gefitinib 4µM + vorinostat 0.5µM loaded NP 185µg/mL gefitinib 15µM + vorinostat 1.8µM *** *** # *** *** *** DLNP 50µg/mL DLNP 185µg/mL ns 0 25 50 75 100 control loaded NP 50µg/mL gefitinib 4µM + vorinostat 0.5µM loaded NP 185µg/mL gefitinib 15µM + vorinostat 1.8µM S p h e ro id s vi ab ili ty A549 spheroids # *** *** *** *** DLNP DLNP D LN P 18 5µ g/ m L T0 24h 48h 72h co n tr ol D L N P 5 0µ g/ m L ge fit in ib 4 µ M + vo rin os ta t 0. 5µ M ge fit in ib 1 5µ M + vo rin os ta t 1 .8 µ M
In vivo biodistribution of the NP
The tumor targeting capacity of these NP was assessed in human NSCLC subcutaneous tumor models. Equal quantities of Dy-700-labeled NP were injected intravenously in mice with A549, H358, or H322 subcutaneous tumors, which have different levels of expression of CD44.[19] After 24 hours, and as previously observed, the strongest fluorescence signals were measured in the liver (Figure 5A), which highlighted the hepatic elimination of the NP, as expected due to their size and opsonisation.[19, 34-37] These NP have a negative surface charge, which is also promoting recognition by the reticulo-endothelial system and uptake by the liver.[34, 38] Five kilodalton hyaluronan fragments were used for NP synthesis. As can be seen in supplementary material S8, these fragments had a limited liver retention compared to 35 kDa fluorescent hyaluronan fragments, in agreement with the known hepatic capture of 10-100 kDa hyaluronan fragments. This capture is due to the overexpresion of the hyaluronan receptor for endocytosis (HARE) in the liver.[39, 40] Nonetheless, a small proportion of NP reached the tumors, and accumulated more strongly in the CD44-overexpressing A549 tumors compared to H358 (low expression of CD44) and H322 (CD44 negative tumor) tumors (Figure 5B), suggesting that active CD44 receptor targeting could play a role in NP retention.[19] Liver uptake is a common important problem observed with most NP, including targeted ones.[41] Our biodistribution observations highlight the need to reduce the hepatic capture of the NP, for instance by pre-injecting free hyaluronan to occupy HARE receptors (supplemetary material S8).[34, 40] In addition, the active targeting of CD44-expressing tumors must be enhanced, possibly by modulating the hyaluronan size of the NP.[42, 43]
Figure 4: Proliferation and apoptosis assays in NSCLC spheroids treated with DLNP.
A549 spheroids were treated for 72 hours in absence of serum with vehicle (control), DLNP or a combination of gefitinib and vorinostat at the same concentration as encapsulated in NP: 185 µg/mL NP encapsulated gefitinib 15µmol/L/vorinostat 1.8µmol/L; 50 µg/mL NP encapsulated gefitinib 4µmol/L/vorinostat 0.5µmol/L. A: The growth of spheroids is followed by microscopy at 24, 48 and 72 hours, and the volume is calculated using MetaMorph software. Data represent the mean ± SD of 20 spheroids in 2 independent experiments. Representative images of A549 spheroids in each condition are presented. B: Cell viability was determined at 72 hours on spheroids. Data represent the mean ± SD of 20 spheroids in 2 independent experiments. C-F: A549 spheroids were treated in absence of serum (control), gefitinib/vorinostat-loaded NP (DLNP) or a combination of gefitinib and vorinostat at the same concentration as encapsulated in NP: 50 µg/mL nanoparticles encapsulated gefitinib 4µmol/L/vorinostat 0.5µmol/L. Representative images of Ki67 (C) or cleaved-caspase 3 (E) staining detected through immunostaining on frozen spheroid sections are shown. In blue: Hoechst staining of the nuclei. Scale bar: 50 µm. Ki67 (D) or cleaved-caspase 3 (F) positive cells were quantified. Three slides randomly selected per spheroid were analyzed, counting all cells per slide. Histograms represent the mean ± SD of 3 spheroids.
Figure 5
A 0 10 20 30 40 50 60 he ar t lu ng br ai n sk in m us cl e ki d ne y a dr en a l g la nd bl ad de r in te st in e sp le en pa nc re as fat st om ac h o va ry ut er us liv er tu m or M ea n f lu o re sc en ce in te n si ty A549 0 10 20 30 40 50 60 he ar t lu ng b ra in sk in m us cl e ki dn ey ad re na l g la nd bl ad de r in te st in e sp le en p an cr ea s fa t st om ac h ov ar y u te ru s liv e r tu m or M ea n f lu o re s ce n ce in te n si ty H358 0 10 20 30 40 50 60 he a rt lu ng br a in sk in m us cl e ki dn ey ad re na l g la nd bl ad de r in te st in e sp le en pa nc re as fat st om a ch ov ar y ut er us liv er tu m or M ea n f lu o re sc e n ce in te n si ty H322Heart Lung Brain Skin
Muscle kidney Adrenal Bladder
Gut Spleen Pancreas Fat
Stomach Uterus Liver Tumor
A549 2D ex vivo fluorescence (24h) B 0 0,5 1 1,5 2 2,5 3
ratio tumeur / peau
Tu m o r/ sk in f lu o re s ce n ce r at io H322 H358 A549
Heart Lung Brain Skin
Muscle kidney Adrenal Bladder
Gut Spleen Pancreas Fat
Stomach Uterus Liver Tumor
H322
2D ex vivo fluorescence (24h)
Heart Lung Brain Skin
Muscle kidney Adrenal Bladder
Gut Spleen Pancreas Fat
Stomach Uterus Liver Tumor
H358
2D ex vivo fluorescence (24h)
Figure 5: Biodistribution of NP and drugs after intravenous injection in vivo.
In vivo biodistribution of Dy-700-labelled NP in mice with A549,
H358, or H322 subcutaneous tumors was studied. Fluorescence images were performed on isolated organs 24 hours after intraveneous injection of NP. A: Regions of interest (ROI) are defined on the extracted organs to semi-quantify the amount of photons detected per pixel after a 500 ms exposure. The results are expressed as the mean ± SD in A549 tumor-bearing mice (n=4), H358 tumor-bearing mice (n=2), and H322 tumor-bearing mice (n=4). The strongest fluorescence signals were measured in the liver and spleen. Examples of organs extracted from A549, H358, and H322 tumor-bearing mouse treated with Dy700-NP is presented. B: ROI are defined on the extracted tumors to semi-quantify the amount of photons detected per pixel after a 500 ms exposure after intravenous injection of NP. The results are expressed as the tumor/skin fluorescence ration ± SD in A549 tumor-bearing mice (n=4), H358 tumor-bearing mice (n=2), and
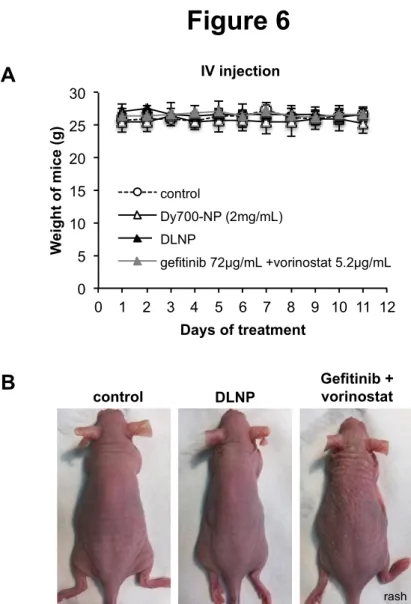
In vivo toxicity of the NP
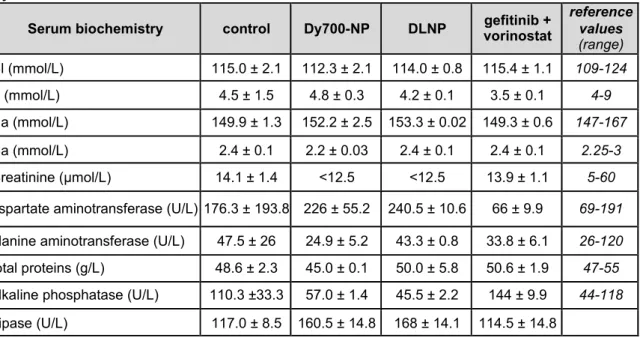
Daily repeated intravenous injection of healthy mice with vehicle, Dy-700-NP, DLNP (2 mg/mL) or free gefitinib and vorinostat combination at the same concentration as encapsulated in NP (gefitinib 72 µg/mL and vorinostat 5.2 µg/mL) were well tolerated after 11 days. No significant weight loss was observed in the mice (figure 6A). However, a cutaneous rash was observed in mice treated with free drugs compared to NP-treated mice (figure 6B), as well as a decrease in aspartate aminotransferase (Table 1). This suggested that the NP prevented the recurrent cutaneous adverse events of gefitinib.[44] In contrast, a small increase in aspartate aminotransferase was observed in the blood of mice treated with NP, which could be an indicator of liver injury, but this was not correlated with change in other indicators of liver disease, such as alanine aminotransferase, alkaline phosphatase, or total proteins. In addition, macroscopic analyses of the organs of NP-treated mice did not show evidence of damage (data not shown). This suggested that DLNP did not impair liver function despite their strong hepatic accumulation.
control DLNP Gefitinib + vorinostat
B
Figure 6
0 5 10 15 20 25 30 0 1 2 3 4 5 6 7 8 9 10 11 12 W ei g h t o f m ic e (g ) Days of treatment control Dy700-NP (2mg/mL)Loaded-NP (gef 72µg/mL + vori 5.2µg/mL) gefitinib 72µg/mL +vorinostat 5.2µg/mL
IV injection
DLNP
A
Figure 6: Toxicity of NP and drugs after intravenous injection in vivo.
Healthy mice were treated daily by intravenous injection of vehicle (control), Dy-700-NP (2 mg/mL), gefitinib/vorinostat-loaded nanoparticles (DLNP 2 mg/mL) or a combination of gefitinib and vorinostat at the same concentration as encapsulated in NP (gefitinib 72 µg/mL and vorinostat 5.2 µg/mL). A: Mice were weighed each day. n=2-3 mice per condition. B: Gefitinib and vorinostat combination induced cutaneous rash.
We did not observe other significant changes in electrolytes, creatinine (alteration of kidney filtration function), or lipase (marker of pancreatitis) dosages. Taken together, our results show that drug encapsulation decreased their side effects.
Antitumoral activity of DLNP in an orthotopic model of NSCLC
Although no toxicity was observed after systemic injection, hepatic accumulation of NP prompted us to evaluate the antitumor activity of DLNP through another way of administration. Intrapulmonary administration of NP is expected to avoid hepatic accumulation. We established a CD44-positive A549 orthotopic lung tumor model. Intrapulmonary nebulization of Dy-700-labelled NP showed a very strong signal in the lungs, but not in the orthotopic lung tumors.[19] This fluorescent signal remained stable for several weeks (Supplementary material S9) without showing adverse effects. Despite the absence of NP accumulation in lung tumors, this suggested that these NP could serve as a reservoir of drugs and release them slowly in the vicinity of the tumors during a long period of time. As soon as the A549 cells were inoculated into the lungs, the mice were randomly divided into three groups: one control group and 2 groups nebulized with DLNP (2 mg/mL) or free gefitinib and vorinostat combination at the same concentration as in DLNP (gefitinib 72 µg/mL and vorinostat 5.2 µg/mL). Nebulization was performed using a microsprayer 2 days after tumor implantation and repeated weekly.
Table 1: Serum biochemical values of healthy mice after NP or drugs administered by IV injection
Serum biochemistry control Dy700-NP DLNP vorinostat gefitinib +
reference values (range) Cl (mmol/L) 115.0 ± 2.1 112.3 ± 2.1 114.0 ± 0.8 115.4 ± 1.1 109-124 K (mmol/L) 4.5 ± 1.5 4.8 ± 0.3 4.2 ± 0.1 3.5 ± 0.1 4-9 Na (mmol/L) 149.9 ± 1.3 152.2 ± 2.5 153.3 ± 0.02 149.3 ± 0.6 147-167 Ca (mmol/L) 2.4 ± 0.1 2.2 ± 0.03 2.4 ± 0.1 2.4 ± 0.1 2.25-3 Creatinine (µmol/L) 14.1 ± 1.4 <12.5 <12.5 13.9 ± 1.1 5-60
aspartate aminotransferase (U/L) 176.3 ± 193.8 226 ± 55.2 240.5 ± 10.6 66 ± 9.9 69-191
alanine aminotransferase (U/L) 47.5 ± 26 24.9 ± 5.2 43.3 ± 0.8 33.8 ± 6.1 26-120
total proteins (g/L) 48.6 ± 2.3 45.0 ± 0.1 50.0 ± 5.8 50.6 ± 1.9 47-55
alkaline phosphatase (U/L) 110.3 ±33.3 57.0 ± 1.4 45.5 ± 2.2 144 ± 9.9 44-118
Lipase (U/L) 117.0 ± 8.5 160.5 ± 14.8 168 ± 14.1 114.5 ± 14.8
Healthy mice were treated daily by intravenous injection of 1X PBS (control), Dy700-NP (2 mg/mL), gefitinib/vorinostat-loaded nanoparticles (DLNP 2 mg/mL) or a combination of gefitinib and vorinostat at the same concentration as encapsulated in NP (gefitinib 72 µg/mL and vorinostat 5.2 µg/mL). After 11 days, blood was collected and analyzed using Dimension Vista® System and according to manufacturer’s instructions. Data represented the mean ± S.D. of 2-3 mice per condition.
5.104 1.106 C o n tr o l G e fi ti n ib + v o ri n o s ta t D L N P D8 D15 D22 D29 D36 D42
Figure 7
A B C D E 0,00E+00 1,00E+07 2,00E+07 3,00E+07 4,00E+07 5,00E+07 0 5 10 15 20 25 30 35 40 T h o ra ci c b io lu m in es ce n ce (p h o to n s/ se c ) Days Control Loaded-NP gefitinib + vorinostatestimation of gefitinib + vorinostat 1,00E+08 5,00E+08 9,00E+08
#
DLNP 0 25 50 75 100 125 150 Cont rol gefiti nib + vorin osta t Load ed-N P Tu m o r b u rd en (% o f c o n tr o l) -52% -65% gefit inib + vorin osta t DLNP Day 8 0 25 50 75 100 125 150 Cont rol gefiti nib + vorin osta t Load ed-N P Tu m o r b u rd e n (% o f co n tr o l) gefit inib + vorin osta t -44% -72% DLNP Day 15 0 25 50 75 100 125 150 Cont rol gefiti nib + vorin osta t Load ed-N P Tu m o r b u rd en (% o f c o n tr o l) -31% -82% gefiti nib + vorin osta t DLNP Day 42Figure 7: Effects of DLNP after nebulization in A549 orthotopic lung tumors.
Mice were inoculated with A549-Luc cells and randomized into 3 groups of 10 mice. Gefitinib/vorinostat-loaded NP (DLNP 2 mg/mL) or a combination of free gefitinib and vorinostat (gefitinib + vorinostat) at the same concentration as encapsulated in NP (gefitinib 72 µg/mL and vorinostat 5.2 µg/mL) were administered intrapulmonary in the lungs once a week. Thoracic bioluminescence imaging was performed once a week. A: Overtime bioluminescence images of A549-Luc tumors (one representative mouse per goup). B: DLNP inhibited the growth of orthotopic A549 lung tumors. Arrows shows treatment nebulization. Mice without signal or with bioluminescence only in the trachea have been excluded. Bars, SEM; control, n=6 mice; DLNP, n=8 mice; gefitinib + vorinostat, n=4 mice. Numbers indicate the percentage of lung tumor-bearing mice in each group. # This thoracic bioluminescent point has been estimated (dotted line) because of the failure of imaging in one mice. C-E: Tumor
As shown in figure 7A and 7B, bioluminescence imaging of tumor growth indicated that the DLNP-treated group showed the slowest tumor growth. Both DLNP and free drug-treated groups exhibited similar early inhibition of thoracic bioluminescence with 65% and 52% decrease, respectively, compared to control group at day 8 (Figure 7C). The inhibition of tumor growth was even greater at day 15, especially for the DLNP-treated group (figure 7D). At the end of the experiment, the DLNP-treated group showed 82% decreased tumor growth compared to control (Figure 7E). Based on this longitudinal follow-up, the doubling time of tumor cell population was calculated and showed that tumor growth was slowed only in the DLNP-treated group compared to the control group, with a tumor cell population doubling time increased by 71%, but not in the free gefitinib and vorinostat-treated group (Table 2). Interestingly, the percentage of mice with lung tumors at the end of the experiment was reduced in the free drug-treated group compared to control or DLNP groups (Table 2). This strongly suggested that nebulized DLNP restrained tumor growth over time, whereas free drugs directly inhibited the establishment of tumors but not their progression. Nebulization of NP or of therapeutic antibodies has already been successfully reported for lung cancer treatment.[45-48] Here, we showed that even if the bronchial obstruction due to the presence of tumor should prevent the nebulized DLNP from penetrating the tumor,[19] they accumulated over time nearby the tumor and enhanced the amount of drugs in tumor microenvironment, thus inhibiting the tumor growth.
Intrapulmonary administration of treatments was well tolerated, and no significant weight loss was observed in the mice (Supplementary material S10). We did not observe any significant change in serum biochemical values, except a decrease in triglycerides and creatinine dosages in free drug-treated mice (Supplementary material S10). We did not observe any lung damage on histological sections (Supplementary material S11), but pulmonary toxicity should be formally assessed to confirm the safety of nebulized NP.[49]
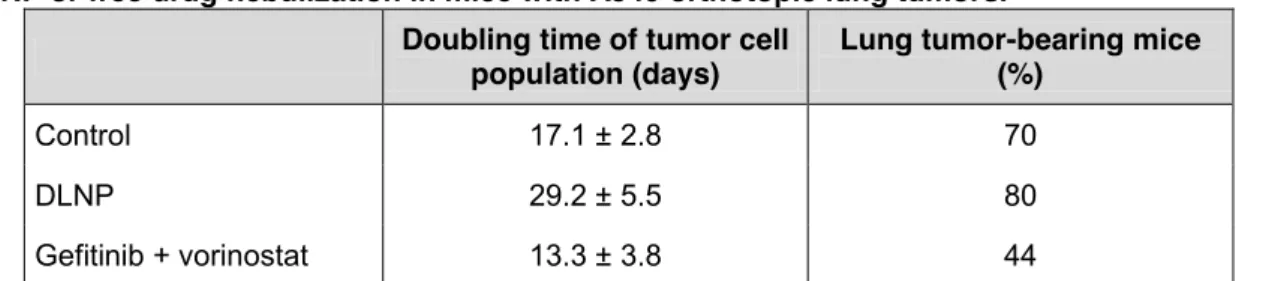
Table 2: Doubling time of tumor cell population and percentage of tumor-bearing mice after DLNP or free drug nebulization in mice with A549 orthotopic lung tumors.
Doubling time of tumor cell population (days) Lung tumor-bearing mice (%)
Control 17.1 ± 2.8 70
DLNP 29.2 ± 5.5 80
Gefitinib + vorinostat 13.3 ± 3.8 44
The tumor cell population doubling time of was calculated as described in the methods section based on the longitudinal bioluminescence follow-up of mice with A549-Luc cells and nebulized with DLNP or gefitinib and vorinostat combination. The percentage of lung tumor-bearing mice in each group were determined at day 42 among the mice inoculated with A549-Luc cells (n=10 per group).
To explore the mechanism underlying the tumor growth inhibition, proliferation and apoptosis assays were performed on lung sections (Supplementary material S11). No significant difference between the treatments was observed in apoptosis induction in tumor cells. In contrast, Ki67 immunostaining showed that the DLNP significantly decreased cell proliferation by approximately 30% in A549 tumors compared to the control or free drug-treatment groups. This indicated that DLNP enhanced the antitumor activity of drug combination by reducing the proliferation of tumor cells.[7, 9]
Conclusions
In conclusion, we have developed 30 nm large NP obtained from the self-assembly of hyaluronan-based copolymers for the simultaneous delivery of drugs with different physicochemical properties. Hyaluronan-based NP are capable of co-loading both hydrophobic and hydrophilic chemotherapeutics and provide both active targeting partially mediated by CD44 and protection from undesired drug release during circulation. DLNP triggered enhanced apoptosis among cancer cells in vitro in monolayer cell culture and in spheroids and conferred better antitumor effects in vivo compared to free drug combination after intrapulmonary administration. A weekly administration of the DLNP accounted for a slow and controlled release of the drugs, which was sufficient to strongly inhibit tumor growth and was well tolerated. In contrast, free drugs prevented nesting of tumors since fewer mice had a lung tumor, probably by killing tumor cells thanks to a peak of high drug concentration during their administration. Because they may diffuse too quickly into lung tissues following nebulization, free drugs failed to control the tumor growth. The sustained slow drug release with DLNP seems to be more efficient to inhibit the tumor progression. Further trials will be needed to optimize the concentrations of drugs combination, as well as the ratio of drugs loaded into the DLNP in order to obtain the best therapeutic efficacy. This novel hyaluronan-based drug delivery system may hold promise for efficient tumor therapy and opens an avenue for exploring the design of more sophisticated delivery systems with higher loading capacities and minimum side effects.
Conflict of interest
Acknowledgments
We acknowledge the assistance of A Grichine, J Mazzega, and M Pezet (Platform Optical microscopy - Cell Imaging, Centre de Recherche Institut National de la Santé et de la Recherche Médicale U1209).
This work was supported by grants from the National Research Agency (ANR project Nanoluc ANR-11-BSV5-0018), La “Ligue Contre le Cancer comité de l’Isère” (R15HURBIN), and “Region Rhône-Alpes”. The confocal microscopy tool was partly funded by the Association for Research on Cancer, French Ministry “Enseignement Supérieur et Recherche”, and “Region Rhône-Alpes” (Contrat de projets État–Région 2007-2013 “Exploration du vivant, Imagerie biomedicale”).
References
[1] R. Siegel, E. Ward, O. Brawley, A. Jemal, Cancer statistics, 2011: the impact of eliminating socioeconomic and racial disparities on premature cancer deaths, CA: a cancer journal for clinicians, 61 (2011) 212-236.
[2] T.S. Mok, Y.L. Wu, S. Thongprasert, C.H. Yang, D.T. Chu, N. Saijo, P. Sunpaweravong, B. Han, B. Margono, Y. Ichinose, Y. Nishiwaki, Y. Ohe, J.J. Yang, B. Chewaskulyong, H. Jiang, E.L. Duffield, C.L. Watkins, A.A. Armour, M. Fukuoka, Gefitinib or carboplatin-paclitaxel in pulmonary adenocarcinoma, N Engl J Med, 361 (2009) 947-957.
[3] F.R. Hirsch, P.A. Janne, W.E. Eberhardt, F. Cappuzzo, N. Thatcher, R. Pirker, H. Choy, E.S. Kim, L. Paz-Ares, D.R. Gandara, Y.L. Wu, M.J. Ahn, T. Mitsudomi, F.A. Shepherd, T.S. Mok, Epidermal growth factor receptor inhibition in lung cancer: status 2012, J Thorac Oncol, 8 (2013) 373-384.
[4] W. Pao, T.Y. Wang, G.J. Riely, V.A. Miller, Q. Pan, M. Ladanyi, M.F. Zakowski, R.T. Heelan, M.G. Kris, H.E. Varmus, KRAS mutations and primary resistance of lung adenocarcinomas to gefitinib or erlotinib, PLoS Med, 2 (2005) e17.
[5] M.C. Chen, C.H. Chen, J.C. Wang, A.C. Tsai, J.P. Liou, S.L. Pan, C.M. Teng, The HDAC inhibitor, MPT0E028, enhances erlotinib-induced cell death in EGFR-TKI-resistant NSCLC cells, Cell Death Dis, 4 (2013) e810.
[6] K.T. Thurn, S. Thomas, A. Moore, P.N. Munster, Rational therapeutic combinations with histone deacetylase inhibitors for the treatment of cancer, Future Oncol, 7 (2011) 263-283.
[7] B. Busser, L. Sancey, V. Josserand, C. Niang, S. Khochbin, M.C. Favrot, J.L. Coll, A. Hurbin, Amphiregulin promotes resistance to gefitinib in nonsmall cell lung cancer cells by regulating Ku70 acetylation, Molecular therapy, 18 (2010) 536-543.
[8] V. Jeannot, B. Busser, E. Brambilla, M. Wislez, B. Robin, J. Cadranel, J.L. Coll, A. Hurbin, The PI3K/AKT pathway promotes gefitinib resistance in mutant KRAS lung adenocarcinoma by a deacetylase-dependent mechanism, Int J Cancer, 134 (2014) 2560-2571.
[9] V. Jeannot, B. Busser, L. Vanwonterghem, S. Michallet, S. Ferroudj, M. Cokol, J.L. Coll, M. Ozturk, A. Hurbin, Synergistic activity of vorinostat combined with gefitinib but not with sorafenib in mutant KRAS human non-small cell lung cancers and hepatocarcinoma, OncoTargets and Therapy, 9 (2016) 6843-6855.
[10] D. Peer, J.M. Karp, S. Hong, O.C. Farokhzad, R. Margalit, R. Langer, Nanocarriers as an emerging platform for cancer therapy, Nat Nanotechnol, 2 (2007) 751-760.
[11] H. De Oliveira, J. Thevenot, S. Lecommandoux, Smart polymersomes for therapy and diagnosis: fast progress toward multifunctional biomimetic nanomedicines, Wiley interdisciplinary reviews. Nanomedicine and nanobiotechnology, 4 (2012) 525-546.
[12] F. Ahmed, R.I. Pakunlu, A. Brannan, F. Bates, T. Minko, D.E. Discher, Biodegradable polymersomes loaded with both paclitaxel and doxorubicin permeate and shrink tumors, inducing apoptosis in proportion to accumulated drug, Journal of controlled release : official journal of the Controlled Release Society, 116 (2006) 150-158.
[13] H.E. Colley, V. Hearnden, M. Avila-Olias, D. Cecchin, I. Canton, J. Madsen, S. MacNeil, N. Warren, K. Hu, J.A. McKeating, S.P. Armes, C. Murdoch, M.H. Thornhill, G. Battaglia, Polymersome-mediated delivery of combination anticancer therapy to head and neck cancer cells: 2D and 3D in vitro evaluation, Mol Pharm, 11 (2014) 1176-1188.
[14] K.K. Upadhyay, A.N. Bhatt, E. Castro, A.K. Mishra, K. Chuttani, B.S. Dwarakanath, C. Schatz, J.F. Le Meins, A. Misra, S. Lecommandoux, In vitro and in vivo evaluation of docetaxel loaded biodegradable polymersomes, Macromol Biosci, 10 (2010) 503-512. [15] K.K. Upadhyay, A.N. Bhatt, A.K. Mishra, B.S. Dwarakanath, S. Jain, C. Schatz, J.F. Le Meins, A. Farooque, G. Chandraiah, A.K. Jain, A. Misra, S. Lecommandoux, The intracellular drug delivery and anti tumor activity of doxorubicin loaded poly(gamma-benzyl L-glutamate)-b-hyaluronan polymersomes, Biomaterials, 31 (2010) 2882-2892. [16] K.K. Upadhyay, J.F. Le Meins, A. Misra, P. Voisin, V. Bouchaud, E. Ibarboure, C. Schatz, S. Lecommandoux, Biomimetic doxorubicin loaded polymersomes from hyaluronan-block-poly(gamma-benzyl glutamate) copolymers, Biomacromolecules, 10 (2009) 2802-2808.
[17] J.S. Crespo, S. Lecommandoux, R. Borsali, H.A. Klok, V. Soldi, Small angle neutron scattering from diblock copolymer poly(styrene-d8)-b-poly(g-benzyl-L-glutamate) solutions: rod-coil to coil-coil transition., Macromolecules, 36 (2003) 1253-1256.
[18] S. Lecommandoux, M.F. Achard, J.F. Langenwalter, H.A. Klok, Self-assembly of rod-coil diblock oligomers based on a-helical peptides., Macromolecules, 34 (2001) 9100-9111.
[19] V. Jeannot, S. Mazzaferro, J. Lavaud, L. Vanwonterghem, M. Henry, M. Arboleas, J. Vollaire, V. Josserand, J.L. Coll, S. Lecommandoux, C. Schatz, A. Hurbin, Targeting CD44 receptor-positive lung tumors using polysaccharide-based nanocarriers: Influence of nanoparticle size and administration route, Nanomedicine, 12 (2016) 921-932.
[20] A. Karageorgis, M. Claron, R. Juge, C. Aspord, F. Thoreau, C. Leloup, J. Kucharczak, J. Plumas, M. Henry, A. Hurbin, P. Verdie, J. Martinez, G. Subra, P. Dumy, D. Boturyn, A. Aouacheria, J.L. Coll, Systemic Delivery of Tumor-Targeted Bax-Derived Membrane-Active Peptides for the Treatment of Melanoma Tumors in a Humanized SCID Mouse Model, Mol Ther, 25 (2017) 534-546.
[21] E. Lepeltier, C. Bourgaux, P. Couvreur, Nanoprecipitation and the "Ouzo effect": Application to drug delivery devices, Adv Drug Deliv Rev, 71 (2014) 86-97.
[22] B.K. Johnson, R.K. Prud'homme, Mechanism for rapid self-assembly of block copolymer nanoparticles, Phys Rev Lett, 91 (2003) 118302{Johnson, 112003 #118982}. [23] W.S. Saad, R.K. Prud’homme, Principles of nanoparticle formation by flash nanoprecipitation, Nanotoday, 11 (2016) 212-227.
[24] B.K. Johnson, R.K. Prud'homme, Flash NanoPrecipitation of Organic Actives and Block Copolymers using a Confined Impinging Jets Mixer, Australian Journal of Chemistry, 56 (2003) 1021.