HAL Id: ird-02381068
https://hal.ird.fr/ird-02381068v2
Submitted on 27 Nov 2019
HAL is a multi-disciplinary open access
archive for the deposit and dissemination of
sci-entific research documents, whether they are
pub-lished or not. The documents may come from
teaching and research institutions in France or
abroad, or from public or private research centers.
L’archive ouverte pluridisciplinaire HAL, est
destinée au dépôt et à la diffusion de documents
scientifiques de niveau recherche, publiés ou non,
émanant des établissements d’enseignement et de
recherche français ou étrangers, des laboratoires
publics ou privés.
Root foraging capacity depends on root system
architecture and ontogeny in seedlings of three Andean
Chenopodium species
Ricardo Alvarez-Flores, Thierry Winkel, Anh Nguyen-Thi-Truc, Richard
Joffre, R Alvarez, Nguyen-Thi-Truc -R Joffre
To cite this version:
Ricardo Alvarez-Flores, Thierry Winkel, Anh Nguyen-Thi-Truc, Richard Joffre, R Alvarez, et al..
Root foraging capacity depends on root system architecture and ontogeny in seedlings of three
An-dean Chenopodium species. Plant and Soil, Springer Verlag, 2014, �10.1007/s11104-014-2105-x�.
�ird-02381068v2�
1
Root foraging capacity depends on root system architecture and ontogeny in
1
seedlings of three Andean Chenopodium species
2
3
Ricardo Alvarez-Flores, Thierry Winkel, Anh Nguyen-Thi-Truc, Richard Joffre
4
R. Alvarez-Flores – A. Nguyen-Thi-Truc – R. Joffre
5
CNRS, UMR 5175 Centre d'Écologie Fonctionnelle et Évolutive, F-34293 Montpellier, France
6
T. Winkel ()
7
IRD, UMR 5175 Centre d'Écologie Fonctionnelle et Évolutive, F-34293 Montpellier, France
8
e-mail: thierry.winkel@ird.fr
9
Citation
10
Alvarez-Flores R., Winkel T., Nguyen-Thi-Truc A., Joffre R. 2014. Root foraging capacity depends on root system
11
architecture and ontogeny in seedlings of three Andean Chenopodium species. Plant and Soil 380: 415‑428.
12
https://doi.org/10.1007/s11104-014-2105-x.
13
Abstract
14
Aims Morphological and ontogenetic variation in root system architecture holds ecological significance,
15
particularly in low-resource habitats where soil rooting is critical for both seedling establishment and water and
16
nutrient uptake. To assess this variation under contrasted agroecological backgrounds, root architecture and rooting
17
patterns were compared in Andean populations of Chenopodium hircinum, Chenopodium pallidicaule and two
18
ecotypes (wet- and dry-habitat) of Chenopodium quinoa.
19
Methods Seedlings were grown in rhizotrons under controlled water and nutrient availability. Root branching and
20
elongation dynamics were characterized during 6 weeks after germination, while leaf area, above and
below-21
ground biomass, and specific root length were determined at the end of the experiment.
22
Results Despite large differences in aboveground biomass, all populations showed similar herringbone root
23
systems. The dry-habitat C. quinoa had generally the highest root trait values, with fast taproot elongation, thick
24
roots and long root segments resulting in high total root length and deep root proliferation.
25
Conclusion Irrespective of their contrasting agroecological background, the studied chenopods displayed a similar
26
root system topology. However, from very early development stages, they showed differential root foraging
27
patterns with two extremes: fast and vigourous rooting at depth in the dry-habitat C. quinoa, and shallow and thin
28
root system in C. pallidicaule adapted to shallow-soil and high-altitude habitats.
29
30
Keywords Chenopodium quinoa; Chenopodium hircinum; Chenopodium pallidicaule; Ecotypes; Rhizotron; Root
31
traits; Root system topology
2
Introduction33
Root system architecture considers the spatial structure, the geometric features and the branching complexity of
34
the roots of whole plants (Fitter 1987). It has profound implications for plant growth and species distribution,
35
enabling individual plants to cope with changing environmental conditions and plant species to thrive in different
36
ecological niches (Lynch 1995; White et al. 2013). Differences in root system architecture are associated with
37
differences in soil resource acquisition, not only between contrasting functional types (Paula and Pausas 2011;
38
Roumet et al. 2006; Taub and Goldberg 1996), but also among genera and species of the same growth form
39
originating from contrasted ecological habitats (Leva et al. 2009). Chenopodium is one of these genera that thrive
40
under strikingly contrasted environments, notably in South America where strong ecological gradients develop
41
from Amazonian or Southern Pacific lowlands of humid climate and nutrient-rich soil up to the Andean highlands
42
of dry and cold climate and nutrient-poor soil (Troll 1968; Di Castri and Hajek 1976). In these highly contrasted
43
habitats, annual chenopods have diversified, some of them as spontaneous chenopods (e.g. C. hircinum Schrad.,
44
C. petiolare Kunth, C. carnosolum Moq.), others as cultivated species like quinoa (C. quinoa Willd.) and cañahua
45
(C. pallidicaule Aellen) with many ecotypes (Kühn et al. 1993; Vargas et al. 2011). None of these chenopods show
46
the morphophysiological adaptations typical to dry or saline habitats environments, such as Kranz anatomy, C4
47
photosynthetic pathway, or succulence (Fuentes-Bazan et al. 2012). For surviving, these plants thus rely on
48
common plant and life-history traits that control the balance between resource capture and resource use, for which
49
root system architecture plays a key role (Singh et al. 2010).
50
Examining the various patterns of root system branching or topology, theoretical and experimental works
51
suggest that a root system consisting of only a main axis and primary laterals (herringbone topology) would favour
52
nutrient acquisition in low-resource habitats because it minimizes intraplant root competition (Fitter et al. 1991;
53
Taub and Goldberg 1996). Conversely, a dichotomous topology associated with shorter root links (the segments
54
of root between two nodes, or between a node and a root tip) and greater link number, would favour nutrient
55
capture in high-resource habitats (Fitter et al. 1991; Taub and Goldberg 1996). Most chenopods show a
56
herringbone root system (Fitter 1987), but detailed descriptions are lacking to appreciate differences among species
57
or among ecotypes of contrasted habitats. Regarding plant species adapted to cold and high altitude habitats, they
58
might develop a growth syndrome that includes short plant height and high root mass fraction (Poorter et al. 2011).
59
Growing at elevations up to 4.600 m, the small-sized C. pallidicaule is renowned as the hardiest Andean chenopods
60
(Gade 1970) and yet the adaptive value of its morphophysiological traits remains unknown.
61
In a context of increasing scarcity of agricultural water and nutrients, improved root system functioning
62
could enhance crop productivity while decreasing crop input requirements (De Dorlodot et al. 2007; Lynch and
63
Brown 2012; White et al. 2013). Cultivated chenopod species such as Ch. quinoa and Ch. pallidicaule are
64
promising candidates for exploring plant ideotypes suited to low-input agriculture (Rojas et al. 2009). In fact, since
65
centuries, Andean farmers have selected several tens of local chenopod varieties for their hardiness under harsh
66
climate and poor soil conditions (Bonifacio 2003). As it happened in other crop species (Palta et al. 2011; Wasson
67
et al. 2012), unconscious selection for improved rooting capacity is likely to have occurred in these Andean
68
chenopod crops. Exploring the morphological variation in root architecture, and particularly the contrast between
69
wild and cultivated species, would help testing this hypothesis of unconsciuous selection as well as defining root
70
system ideotypes that optimize soil resource uptake.
71
Since root distribution and soil resource profiles are temporally dynamic, characterizing the root system
3
based on one time measurements cannot reveal the full range of plant responses to changing soil conditions
73
(Chesson 2004). In seedlings, in particular, the dynamics of root growth and branching is critical for the successful
74
establishment of the plants and the exploitation of the soil volume, especially in harsh and variable environments
75
where fast and early rooting is vital to capture ephemeral soil nutrients and deep water (León et al. 2011; Padilla
76
and Pugnaire 2007). An important factor for early root vigor is individual seed mass (Richards et al. 2007; White
77
et al. 2013), a trait showing extensive genetic variation, including in chenopods where natural polyploidization
78
and human selection have led to broad variation in seed mass (Bhargava et al. 2007; Fuentes-Bazan et al. 2012).
79
By means of a rhizotron experiment, the present study addresses the ontogenetic changes in root system
80
architecture of seedlings plants in three Andean Chenopodium species of different agroecological backgrounds.
81
The starting hypothesis is that Chenopodium plants from low-resource habitats have developed root traits that
82
enhance root foraging in deep soil layers. More specifically, it is expected that chenopods from low-resource
83
habitats would have faster root growth at early growth stage and greater root elongation at depth.
84
Materials and methods
85
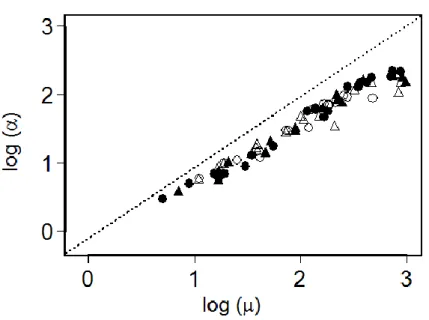
Study site and plant populations
86
The study was conducted outdoor under a transparent rain shelter at the CEFE-CNRS experimental field
87
(Montpellier, France, 43°38’19’’N, 3°51’46’’E), from the 11th of March to the 22th of April 2011. Four
88
Chenopodium population samples from contrasting habitats were compared: C. hircinum and C. pallidicaule both
89
from semi-arid highlands with nutrient-poor soils, C. quinoa from temperate lowlands with nutrient-rich soils (wet
90
habitat), C. quinoa from arid and cold highlands with nutrient-poor soils (dry habitat) (Table 1). C. hircinum is a
91
wild tetraploid species, C. pallidicaule is a domesticated diploid, and C. quinoa is a domesticated tetraploid. The
92
wet-habitat C. quinoa pertains to the coastal quinoa ecotype of Chile while the dry-habitat C. quinoa is
93
representative of the Salar quinoa ecotype of Bolivia. The seeds of C. quinoa and C. pallidicaule were from local
94
landraces without pedigree. They were collected directly at the specified sites, as were the seeds of C. hircinum.
95
In the four studied populations, seeds were selected for their size homogeneity and sterilized with sodium
96
hypochlorite (1%) for 10 min before sowing in rhizotrons at 3 cm depth.
97
Rhizotrons
98
Rhizotrons measuring 85 x 34 x 2.3 cm were made of white PVC plates with a pane of glass on one side. The
99
windowpane was protected from light incidence with a mobile polystyrene plate 1.5 cm thick. Each rhizotron was
100
filled with 7 L of a soil substrate humidified at field capacity (see below), sown with two seeds of the same
101
population and then disposed outdoor under a transparent roof for rain protection. The rhizotrons were disposed
102
with a 15° inclination from the vertical to favor the root growth on the windowpane.
103
Soil substrate and growth conditions
104
The soil substrate was composed of 84.5 % of sand, 6.3 % of clay, 4.5 % of silt, 3.1 % of organic matter, with pH
105
8.08, CEC Metson 9.02 cmol+/kg, and C/N 11.2. Prior to the experiment, the substrate was dried and sterilized to
106
120 °C for 48 hours. Then, it was humidified using a nutritive solution (N: 16%, P: 10 %, K: 24 %, MgO: 3 %,
107
micro-elements: 2.5 g/L). When the experiment started, rhizotrons were at field capacity (0.12 cm3/cm3) and no
4
more water was applied until the end of the study. Over the course of the experiment, air temperature at 150 cm
109
height varied between 3.0 and 35.2 °C (mean = 15.5 °C ± 0.1), soil temperature at 25 cm depth varied between 4.8
110
and 35.2 °C (mean = 14.9 °C ± 0.05), and air relative humidity varied between 30 and 89 % (mean = 61 % ± 0.5).
111
These conditions of temperature and soil humidity grossly satisfied the optimal growth requirements of the studied
112
populations and no sign of plant physiological stress (e.g. leaf wilting, slow plant growth) was detected. Apart
113
from being a convenient substrate in a comparative study under controlled conditions, the sandy substrate fitted
114
the soil conditions commonly experienced by C. pallidicaule and the dry-habitat C. quinoa in their native
115
highlands. As regards C. hircinum and the wet-habitat C. quinoa, their natural environments show a range of soil
116
conditions, including sandy ones. The overall satisfactory growth of these plants in the present experiment
117
indicates that they did not suffer any physical or nutritional limitation due to the soil substrate.
118
Plant sampling and measurements
119
Three days after emergence, plants were thinned to one seedling per rhizotron, and five replicate plants per
120
population were followed weekly from 7 to 42 days after sowing (DAS) for non-destructive growth measurements.
121
Root growth of each replicate plant was recorded weekly by tracing on a transparent acetate sheet the root axes
122
visible through the windowpane of the rhizotron. The root system images were then scanned at a resolution of 400
123
dpi (Acer Scan 300F, 6684 03A) (Fig. 1) and analyzed with the morphological and architectural procedures of the
124
WinRHIZO Pro2009 software (Regent Instruments Inc., Quebec, Canada). The following root traits were
125
calculated: total tip number (TTN), total link number (TLN), total root length (TRL, m) and total root length per
126
link type (see Fig. 2a for a definition of root link types). The number of new lateral roots appearing on the taproot
127
in successive soil layers was also counted each week.
128
Following Glimskär (2000), two root topological indices were calculated. The topological quotient index
129
(TQI) for individual plants at 42 DAS was calculated as the ratio log(α)/log(µ), with α representing the altitude of
130
the root system (i.e. the number of links of the longest path from the root collar to an external tip) and µ its
131
magnitude (i.e. the total number of tips in the root system). The topological slope index (TSI) was determined as
132
described by Fitter and Stickland (1991), calculating the slope of the regression of log(α) on log(µ) for the set of
133
altitude and magnitude values observed in each population during the time of the experiment. Both topological
134
indices vary between 0 and 1, with large values indicative of a more herringbone-like root system with branching
135
mostly confined to the main axis.
136
By the end of the experiment (42 DAS), after completing the non-destructive root growth measurements,
137
root collar diameter was measured with an electronic caliper (Mitutoyo, Andover, UK) and each individual plant
138
was cut at the level of the root collar. Plant height (PH, cm) was measured as the length of the main stem from the
139
root collar to the shoot apex. Leaves were separated from the stems, scanned at 400 dpi (CanonScan LIDE 100)
140
and the images were analyzed with the SigmaScan Pro 5 software (Systat Software Inc.) to determine the total leaf
141
area per plant (LA, cm²). Leaves and stems were then oven-dried at 65 °C for 48 h before dry mass weighting. The
142
substrate containing the root system was divided into six depth levels (0-5 cm, 5-20 cm, 20-35 cm, 35-50 cm,
50-143
65 cm, 65-80 cm) and roots within each layer were washed, separating the roots growing onto the windowpane
144
from those growing inside the substrate. After drying at 65 °C for 48 hours, root dry mass was determined to
145
calculate: i) the specific root length (SRL, m/g) from the roots growing onto the windowpane, and ii) the root/shoot
146
ratio (R:S, g/g) from the bulk of the root system biomass.
5
Data analyses
148
Differences in plant traits among populations were tested using factorial analysis of variance (ANOVA) after log
149
transformation of the data when necessary to meet the normality and homoscedasticity assumptions. To avoid size
150
effects when comparing populations for TTN, TLN, MLL II, MLL EI and MLL EE, analyses of covariance
151
(ANCOVA) were performed, with TRL as the covariate, and testing for a possible interaction between the
152
covariate and the factor “populations”. Tukey’s HSD post-hoc tests were used to compare population means at P
153
< 0.05. The dependence between selected variables was determined using Pearson's correlation analysis. Statistical
154
procedures were performed using STATISTICA v.7.1 (Statsoft Inc., Tulsa, USA).
155
Results
156
Plant size, biomass production and root/shoot ratio
157
Seedlings of dry-habitat C. quinoa showed the most vigorous growth, resulting in higher plant height and deeper
158
root system during the course of the experiment, and higher leaf area, root collar diameter and biomass production
159
at 42 DAS (Table 2). At that time, C. pallidicaule, the least vigorous of the studied populations, was only 6.5%
160
the size of dry-habitat C. quinoa in terms of total plant mass, 10% its size in terms of leaf area, and 20% its size in
161
terms of total root length. C. hircinum and wet-habitat C. quinoa showed intermediate values, with the wild C.
162
hircinum always less productive than the cultivated C. quinoa, essentially due to lower aboveground growth. These
163
differences in seedling growth among the studied populations were in relation with their respective mean seed
164
mass (SM, Table 2). Despite contrasted growth capacities, C. pallidicaule and dry-habitat C. quinoa showed
165
similar biomass allocation patterns with R:S ratios of 0.31 and 0.28 respectively, significantly lower than those
166
observed in wet-habitat C. quinoa (0.45) and C. hircinum (0.39).
167
Root system profile and branching dynamics
168
After six weeks of plant growth (42 DAS), the vertical distribution of the root system showed significant
169
differences among populations and among soil layers (Fig. 3). In each soil layer, the number of root tips was highly
170
correlated to the root length (r = 0.97, P < 0.001, n = 24) and both traits showed similar vertical distributions. C.
171
quinoa from dry and wet habitats had similar root profiles down to 65 cm depth, with maximum root development
172
in the 20-35 cm soil layer (ca. 5 m root length in that layer, equivalent to a root length density ca. 0.35 cm root/cm3
173
soil). Beyond a 65 cm depth, dry-habitat C. quinoa showed significantly higher root colonization than the
wet-174
habitat ecotype (ca. 4 m of root against 0.5 m respectively). Compared to C. quinoa, C. hircinum and C.
175
pallidicaule showed significantly less root development, although the former still colonized deep soil while the
176
latter was almost exclusively limited to the 35-50 cm layer (Fig. 3).
177
These patterns of vertical root distribution at 42 DAS resulted from the progressive proliferation of the
178
root system through the soil profile (Fig. 1). The sequential analysis of the number of new lateral branches
179
appearing on the taproot during the experiment revealed contrasted dynamics among the studied populations (Fig.
180
4). In C. hircinum and wet-habitat C. quinoa, root branching proceeded in a similar way, with new lateral roots
181
successively appearing in ever deeper soil layers down to 75 cm at 42 DAS. The main difference between these
182
two populations was in a more extended period of root proliferation in wet-habitat C. quinoa, starting one week
6
earlier than in C. hircinum. By contrast, in dry-habitat C. quinoa, root branching was maximum at 75 cm as soon
184
as 35 DAS, when none of the other populations add reached that depth yet. In C. pallidicaule, root branching
185
occurred over the same lapse of time than in the other populations but at a much lower rate, and it hardly passed
186
the 30 cm soil depth.
187
Root segment and root system morphology
188
The morphology of individual root segments varied greatly among the studied populations, with SRL in C.
189
pallidicaule showing roots three-fold finer on average than those of dry-habitat C. quinoa, the other two
190
populations having intermediate values (Table 2). With regard to the shape of the root system, the topological
191
slope index TSI showed statistical differences only among dry-habitat C. quinoa (0.72) and C. hircinum (0.87),
192
while the topological quotient index TQI did not show any difference among the four populations (Table 2). Such
193
high values of the topological indices are characteristic of a herringbone morphology for the root systems. The
194
regression of log(α) on log(μ) showed a strong, unique linear relationship (r² = 0.96) over the range of observed
195
plant sizes, irrespective of the species (Fig. 5). However, the plot also shows a tendency for the slope of the
196
regression to decrease sharply at high magnitude values (namely, log(µ) close to 3).
197
Root system architecture
198
Despite a similar herringbone morphology, the studied populations differed greatly in the details of their root
199
system architecture: both C. quinoa ecotypes produced higher TRL and had significantly greater TLN and TTN
200
than C. hircinum which, in turn, showed nearly three times more root branches and root tips than C. pallidicaule
201
(Table 2).
202
A thorough analysis of the different kinds of root links reveals contrasted dynamics of root branching
203
among the studied populations (Figs. 6, 7, 8). Except in the first three weeks when the root system was essentially
204
limited to the taproot (see Fig. 1), EI links concentrated most of the total root length in the four populations (Fig.
205
6). Considering the cumulated root length per link type, the highest increase was observed between 28 and 35 DAS
206
in dry-habitat C. quinoa, particularly in EI links which, by the end of the experiment, totalized 8 m per plant on
207
average (53% of the total root length) (Fig. 6). In comparison, EI links in C. pallidicaule at the same stage totalized
208
only 2 m per plant on average, though they amounted to a similar proportion of the total root length. Decomposing
209
the total root length in its two components (namely: the mean number and the mean length of the different links,
210
Fig. 7 and 8), it appeared that temporal changes in total root length reflected mostly the changes in link number (r
211
= 0.84, P < 0.001, n = 65) and not those in mean link length (r = 0.02, P > 0.1, n = 65). The number of EI and EE
212
links increased progressively from 14 DAS on, with EI links always in a higher proportion than EE links in all
213
populations (Fig. 7). The appearance of new links reached its highest rate by the end of the experiment with
wet-214
habitat C. quinoa showing the highest rate of root branching.
215
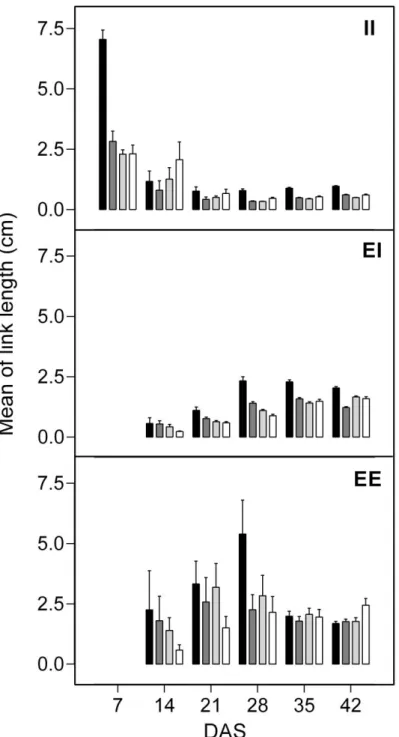
Regarding the mean length of the different types of links, considerable variation was shown with maximal
216
values of nearly 7 cm observed in the young taproot of the dry-habitat C. quinoa, while the taproot of the other
217
populations was limited to about 2 cm at that early developmental stage (Fig. 8). From 14 DAS on, the mean length
218
of II links decreased rapidly as a consequence of the emergence of new lateral roots. While mean link length did
219
not show much time variations from 28 DAS on, it varied significantly among populations, with constantly longer
220
II and EI links in dry-habitat C. quinoa than in the other three populations (Fig. 8 and Table 2). This trait
7
compensated for lower or equal link numbers in this ecotype compared to that from wet habitat (Fig. 7 and Table
222
2), resulting in higher TRL in the dry-habitat C. quinoa, with a non-significant trend when considering the whole
223
plant root system (Table 2, P = 0.12) but a highly significant difference as regards the cumulated EI segments (Fig.
224
6, P < 0.001) which formed the major part of the entire root system.
225
Discussion
226
Root topology in different chenopod species: plant size and ontogenetic effects
227
This study found significant variation in initial seedling size (TPM or PH, Table 2) among three Andean
228
Chenopodium species, with C. quinoa producing two to five-fold more biomass than C. hircinum and up to
fifteen-229
fold more than C. pallicaule. Among the two C. quinoa ecotypes, the one from the dry habitat showed the most
230
vigorous growth, which should give it a decisive advantage since initial seedling size strongly determines early
231
plant survival in arid environments (León et al. 2010). As observed in other wild and cultivated species (Coomes
232
and Grubb 2003; Bertholdsson et al. 2009), the ranking in plant vigor among the studied populations was related
233
to the differences in individual seed mass. This contrast between species did not affect the overall shape of the root
234
system: all showed similar root topological indices (Table 2) with values characteristic of herringbone root
235
systems, a feature commonly observed in chenopod species (Fitter 1987). Such similar topological indices could
236
reflect the phylogenetic closeness of the studied species. In fact, C. quinoa was probably domesticated from C.
237
hircinum, this latter being also a wild relative of C. pallidicaule (Gandarillas 1984). An alternative explanation to
238
this topological similarity arises when comparing our results to those of Glimskär (2000). In his study on forbs
239
and grasses grown at different nitrogen levels, a quite general relationship emerges between altitude (α) and
240
magnitude (µ) with a curvature in the log(α) / log(μ) relation suggesting a general size effect. Interestingly, the
241
curvature in Glimskär's data appears at log(µ) near 3, with log(α) leveling near 2.4, both values which are quite
242
close to our own data for three chenopod species (Fig. 5). The leveling in the altitude / magnitude relationship as
243
plants grow could have an ontogenetic explanation related to the continued branching of a not strictly herringbone
244
root system. After an initial period of seedling growth dominated by the elongation and branching of the main
245
root, lateral roots begin to emerge from internal links, thus forming new external links (EI) which directly increase
246
the root system magnitude without necessarily increasing its altitude. In our study, such new lateral roots of second
247
and higher orders emerged in great number from 21 DAS on (Figs. 4 and 7). The generality of the altitude /
248
magnitude relation observed in forbs and grasses under different growth conditions (Arredondo and Jonhson 1991;
249
Fitter 1991; Glimskär 2000; Paula et al. 2011; Roumet et al. 2006; this study), suggests a general ontogenetic shift
250
in the root topology of annual plant species, with lateral roots emerging in ever greater numbers (increasing
251
magnitude) as soon as log(α) exceeds a value of 2 approximately.
252
Due to this ontogenetic effect, the curvature in the altitude / magnitude relation points to a limitation of
253
the topological slope index (TSI) as proposed by Fitter and Stickland (1991). Assuming a linear relation over a
254
large size range, TSI overemphasizes small deviations from linearity (Glimskär 2000), which makes it a poorly
255
suited index to discriminate root branching patterns in growing seedlings (Paula and Pausas 2011). As an
256
alternative index, Glimskär (2000) proposed the TQI quotient calculated on individual plants, with a range of
257
values from 0.69 to 0.79 for five different species. Our chenopod species fall within this range with an estimate of
258
0.77 (Table 2). Considering our results together with those of Glimskär, we suggest a general ontogenetic shift as
8
a possible component of this size effect. Therefore, when evaluating species differences in root topology, we would
260
recommend comparing not only plants belonging to a narrow size interval (Glimskär 2000), but also plants of
261
similar developmental stages.
262
As for the ecological interpretation of this ontogenetic-size effect on root topology, Glimskär (2000) as
263
well as Paula and Pausas (2011) put forward that the more herringbone topology of young plants could be related
264
to the need to quickly reach deep soil layers, in a context of competition with other plants. This assumption
265
similarly applies to the growth of seedling plants in low-resource habitats where fast root growth at an early
266
developmental stage would secure soil resource capture and young plant survival (León et al. 2011; Palta et al.
267
2011; Richards et al. 2007). The following discussion on the root foraging traits observed in the studied species
268
brings more insights into this assumption.
269
Root foraging: a suite of traits significantly improved in the dry-habitat quinoa ecotype
270
While the herringbone topology remained virtually unchanged among the three Andean chenopods of the present
271
study, their root systems were quite different with regard to the branching architecture and the progressive
272
proliferation through the soil profile. C. quinoa produced higher total root length than C. hircinum and C.
273
pallidicaule, though the difference between the C. hircinum and wet-habitat C. quinoa appeared marginal (Table
274
2). The detailed analysis of root links revealed that external links (EI and EE) were not only in higher proportion
275
than internal links: they were also more abundant in wet-habitat C. quinoa and longer in dry-habitat C. quinoa
276
than in the other two species (Table 2, Figs. 7 and 8). As these external links are more absorptive than the suberified
277
internal root segments (Kramer and Boyer 1995), their relative abundance in C. quinoa should give this species a
278
physiological advantage for soil resource uptake.
279
Among the C. quinoa populations, the one from the dry habitat had statistically fewer root tips and
280
marginally fewer root links (Table 2) but consistently greater II and EI link lengths (Table 2, Fig. 8), resulting in
281
marginally higher TRL values. Such compensation between link number and link length bears a general ecological
282
significance as shown by Nicotra et al. (2002) who found, comparing 11 phylogenetically independent contrasts,
283
that species originating from dry environments usually have fewer root links but with greater link length than
284
species from wetter environments. From a functional point of view, greater root link length reduces the overlap
285
between depletion zones of neighbouring branches and, thus, improves the root foraging efficiency particularly
286
for mobile resources like nitrate or water (Arredondo and Johnson 2011; Fitter et al. 1991b; Pagès 2011). In arid
287
habitats where soil water recharge occurs during the wet season and where deeper soil layers maintain higher soil
288
moisture, a fast elongation of the root system at depth seems more adapted to drought than multiplying root
289
branches in the upper soil layers (Bauerle et al. 2008; Padilla and Pugnaire 2007; Reader et al. 1993). The vertical
290
root growth allows the plants to access water resources at depth, while dense root colonization in the upper soil
291
would rapidly lead to root competition and complete water depletion in the absence of new rainfall events. For the
292
plant mineral nutrition, however, a dense root system in the superficial layers, where soil nutrients generally
293
accumulate, seems more favorable. In fact, most part of the root system in the three studied species was
294
concentrated between 5 and 50 cm depth, with a maximum in the 20-35 cm soil layer (Fig. 3). But in the filtrating
295
sandy soils typical of many arid and semi-arid areas, such a mobile element as nitrate moves easily to depth (Austin
296
et al. 2004). In this case, a dense and fast root growth beyond 50 cm depth would be useful to better capture water
297
as well as nitrate before they move beyond the root zone (Richards et al. 2007). This feature was indeed observed
9
in the dry-habitat C. quinoa which produced abundant lateral roots at 75 cm depth as early as the fifth week of
299
growth, when none of the other populations had reached that depth yet (Figs. 1b and 4). These observations
300
substantiate those made in an independent experiment conducted on the same species, where dry-habitat C. quinoa
301
reached 1 m taproot length between 42 and 49 DAS, one to two weeks earlier than wet-habitat C. quinoa and C.
302
hircinum, while C. pallidicaule remained limited to the first 40 cm soil layer (Alvarez-Flores et al. 2014).
303
Differences in root architecture among populations from dry and wet habitats suggest an adaptive
304
response of the plants for soil resource capture by means of an improved foraging capacity of the root system in
305
the dry-habitat populations (Reynolds et al. 2004). In fact, the greater root link length in dry-habitat C. quinoa,
306
particularly at the very beginning of the root system growth (Fig. 8), was associated with a fast and vigorous
307
growth of the taproot in the early days after seed germination, then relayed by greater elongation of II and EI links
308
in the subsequent weeks (Fig. 6). This elongation dynamics associated to a vigorous root branching at depth (Figs.
309
1b and 4) explains how the dry-habitat C. quinoa rapidly developed a higher root foraging capacity than the
wet-310
habitat ecotype. In several wild and cultivated species, fast and vigorous rooting at depth was found crucial for
311
early seedling survival in environments where water and nutrients are scarce and variable (León et al. 2011; Singh
312
et al. 2010). In the most arid Andean highlands, quinoa farmers take advantage of this rooting pattern:
313
traditionnally, quinoa fields in these rainfed agrosystems are sown every other year, and only seedlings with a
314
vigorous foraging capacity are able to reach the water stored at depth during the fallow year preceeding the crop
315
year (Joffre and Acho 2008).
316
Specific root length is another trait of importance for root foraging capacity, as it influences the capacity
317
of the root system to proliferate through the soil, with thick roots (low SRL) penetrating more easily than fine
318
ones, specially into dry or compacted soil layers (Cornelissen et al. 2003). In a comparison of nine shrub species
319
of the Atacama desert, low SRL appeared linked to higher seedling survival rate (Léon et al. 2010). In general,
320
low SRL values are characteristic of species from dry habitats that tend to have a conservative strategy of water
321
use, with a lower absorptive surface per unit of root biomass (Nicotra et al. 2002; Wright and Westoby 1999). Low
322
SRL in C. quinoa should thus enhance its ability to penetrate deeply tough soil layers and withstand low soil
323
moisture, at the same time that it improves the anchoring of plants significantly taller than those of C. hircinum
324
and C. pallidicaule (see PH and RCD values in Table 2). On the opposite, high SRL in C. pallidicaule could
325
compensate for its low rooting capacity by a higher nutrient transport efficiency and relative low investment in
326
root dry matter (Picon-Cochard et al. 2012). High SRL associated to the small plant height and low plant
327
productivity typical of C. pallidicaule could be part of a plant growth syndrome adapted to cold, high altitude
328
habitats where shallow soils supply only limited water and nutrient resources (Gade 1970; Poorter et al. 2011).
329
Conclusion and perspectives
330
The present study brings the first detailed report of root system architecture and growth dynamics in three
little-331
known Andean species of Chenopodium, including two cultivated ecotypes of C. quinoa. As a whole, the fast root
332
elongation, with thicker roots allowing deep soil penetration, and abundant and long external links conferring an
333
efficient soil exploration, make a suite of root traits that significantly improve the root foraging capacity of C.
334
quinoa compared to C. hircinum and C. pallidicaule. This should be particularly true for the dry-habitat C. quinoa,
335
which showed the highest ranking in these root foraging traits, and which actually thrives in a region of poor but
336
frequently deep sandy soils under extremely dry and cold climate. As for C. pallidicaule, it exhibited a particular
10
plant growth syndrome adapted to shallow soils at very high altitude. In both situations, specific suites of
338
architectural root traits are expressed from very early developmental stages to support initial seedling growth and
339
establishment which are crucial for field performance. These contrasted rooting syndromes agree with two
340
differential foraging strategies in dry environments described by several authors, namely: shallow root systems
341
exploring topsoil layers to beneficiate from seasonal rainfalls, versus deep root systems with thick roots feeding
342
from water stored at depth (Bauerle et al. 2008; Paula and Pausas 2011).
343
These findings identify some key root system attributes of the studied chenopods, particularly of C.
344
quinoa which, despite growing scientific and economic interest (Rojas et al. 2009), remains up to now roughly
345
parameterized in the few crop models developed for this species (see AquaCrop by Geerts et al. 2007, or STICS
346
by Lebonvallet 2008). The integration of these root parameters into plant growth models could allow for a more
347
accurate description and understanding of the different capacities of root foraging and nutrient uptake in the related
348
species or ecotypes (Pagès 2011). Similarly, such root traits could be exploited in breeding for drought adaptation
349
or low-input agriculture, though this would require some complementary studies to verify whether improved
350
seedling root attributes translate into improved performance of mature plants in the field (Manshadi et al. 2008;
351
Singh et al. 2010).
352
From an evolutionary perspective, one should bear in mind that natural selection as well as crop
353
domestication both rely on phenotypic selection (Lynch and Brown 2012). Considering that the higher root
354
branching and foraging capacity of C. quinoa is associated to a higher seed mass and higher biomass production
355
than in its wild progenitor, C. hircinum, or its diploid relative, C. pallidicaule, we hypothesize that these root
356
system traits have been indirectly selected during the polyploidization and domestication processes. Recent works
357
on improved root systems in water-limited crops suggest that such indirect impacts on root branching and foraging
358
might indeed have occurred in several crop species (Palta et al. 2011; Wasson et al. 2012).
359
Acknowledgments This research was funded by a PhD grant of the "Capital Humano Avanzado" programme of
360
CONICYT-CHILE and by the ANR (Agence Nationale de la Recherche - The French National Research Agency)
361
under the "Programme Agriculture et Développement Durable", project "ANR-06-PADD-011, EQUECO". We
362
thank the staff of the "Plate-Forme d’Analyses Chimiques - PACE" and the Experimental Field of CEFE. We are
363
most grateful to Felix Mamani Reynoso and Alejandro Bonifacio (UMSA, La Paz, Bolivia) for kindly providing
364
the seeds of C. pallidicaule and C. hircinum, and to Ivan Prieto, Marie-Laure Navas and Florence Volaire for their
365
constructive comments.
366
References
367
Alvarez-Flores R, Winkel T, Degueldre D, Del Castillo C, Joffre R (2014) Plant growth dynamics and root
368
morphology of little-known species of Chenopodium from contrasted Andean habitats. Botany 92:
101-369
108
370
Alvear M., Rosas A., Rouanet JL, Borie F (2005) Effects of three soil tillage systems on some biological activities
371
in an Ultisol from southern Chile. Soil Tillage Res. 82: 195-202
372
Arredondo JT, Johnson DA (1999) Root architecture and biomass allocation of three range grasses in response to
373
nonuniform supply of nutrients and shoot defoliation. New Phytologist 143: 373-385
374
Arredondo JT, Johnson DA (2011) Allometry of root branching and its relationship to root morphological and
375
functional traits in three range grasses. Journal of Experimental Botany 62: 5581-5594
11
Austin AT, Yahdjian L, Stark JM, Belnap J, Porporato A, Norton U, Ravetta DA, Schaeffer SM (2004) Water
377
pulses and biogeochemical cycles in arid and semiarid ecosystems. Oecologia 141: 221-235
378
Bauerle TL, Smart DR, Bauerle WL, Stockert C, Eissenstat DM (2008) Root foraging in response to heterogeneous
379
soil moisture in two grapevines that differ in potential growth rate. New Phytologist 179: 857-866
380
Bhargava A, Shukla S, Rajan S, Ohri D (2007) Genetic diversity for morphological and quality traits in quinoa
381
(Chenopodium quinoa Willd.) germplasm. Genetic Resources and Crop Evolution 54: 167-173
382
Berntson GM (1994) Modelling root architecture: are there tradeoffs between efficiency and potential of resource
383
acquisition? New Phytologist 127: 483-493
384
Bertholdsson NO, Kolodinska Brantestam A (2009) A century of Nordic barley breeding: effects on early vigour
385
root and shoot growth, straw length, harvest index and grain weight. European Journal of Agronomy 30:
386
266-274
387
Bonifacio A (2003) Chenopodium sp.: genetic resources, ethnobotany, and geographic distribution. Food Reviews
388
International 19: 1-7
389
Coomes DA, Grubb PJ (2003) Colonization, tolerance, competition and seed-size variation within functional
390
groups. Trends in Ecology and Evolution 18: 283–291
391
Cornelissen JHC, Lavorel S, Garnier E, Díaz S, Buchmann N, Gurvich DE, Reich PB, ter Steege H, Morgan HD,
392
van der Heijden MGA, Pausas JG, Poorter H (2003) A handbook of protocols for standardised and easy
393
measurement of plant functional traits worldwide. Australian Journal of Botany 51: 335-380
394
De Dorlodot S, Forster B, Pagès L, Price A, Tuberosa R, Draye X (2007) Root system architecture: opportunities
395
and constraints for genetic improvement of crops. Trends in Plant Science 12: 474-481
396
Di Castri F, Hajek ER (1976) Bioclimatología de Chile. Vicerrectoría Académica de la Universidad Católica de
397
Chile. Santiago, Chile.
398
Fitter AH (1987) An architectural approach to the comparative ecology of plant root systems. New Phytologist
399
106: 61-77
400
Fitter AH, Stickland TR (1991) Architectural analysis of plant root systems 2. Influence of nutrient supply on
401
architecture in contrasting plant species. New Phytologist 118: 383-389
402
Fitter AH, Stickland TR, Harvey ML, Wilson GW (1991) Architectural analysis of plant root systems. 1.
403
Architectural correlates of exploitation efficiency. New Phytologist 118: 375-382
404
Gade DW (1970) Ethnobotany of canihua (Chenopodium pallidicaule), rustic seed crop of altiplano. Economic
405
Botany 24:55-61
406
Gandarillas H. (1984) Obtención experimental de Chenopodium quinoa Willd. MACA, IBTA. La Paz, Bolivia.
407
Geerts S, Raes D, Garcia M, Del Castillo C, Buytaert W (2006) Agro-climatic suitability mapping for crop
408
production in the Bolivian Altiplano: a case study for quinoa. Agricultural and Forest Meteorology 139:
409
399-412
410
Geerts S, Raes D, Garcia M, Miranda R, Cusicanqui JA, Taboada C, Mendoza J, Huanca R, Mamani A, Condori
411
O, Mamani J, Morales B, Osco V, Steduto P (2009) Simulating yield response of quinoa to water
412
availability with AquaCrop. Agronomy Journal 101: 499-508
413
Glimskär A (2000) Estimates of root system topology of five plant species grown at steady-state nutrition. Plant
414
and Soil 227: 249-256
415
Joffre R, Acho J (2008). Quinua, descanso y tholares en el sur del Altiplano Boliviano. Habitat 75: 38-41
12
Kashiwagi J, Krishnamurthy L, Crouch JH, Serraj R (2006) Variability of root length density and its contributions
417
to seed yield in chickpea (Cicer arietinum L.) under terminal drought stress. Field Crops Research 95:
418
171-181
419
Kramer PJ, Boyer JS (1995) Water relations of plants and soils. San Diego, USA: Academic Press
420
Kühn U, Bittrich V, Carolin R, Freitag H, Hedge IC, Uotila P, Wilson PG (1993) Chenopodiaceae. In: Kubitzki
421
K, Rohwer JG, Bittrich V, eds. The families and genera of vascular plants. Volume II: Flowering plants,
422
Dicotyledons. Springer Verlag. Berlin, Germany. 253-281
423
Lebonvallet S (2008) Implantation du quinoa et simulation de sa culture sur l'altiplano bolivien. Thèse de Doctorat.
424
Ecole Doctorale ABIES, AgroParisTech, Paris, France: 244 p.
425
León MF, Squeo FA, Gutiérrez JR, Holmgren M (2011) Rapid root extension during water pulses enhances
426
establishment of shrub seedlings in the Atacama Desert. Journal of Vegetation Science 22: 120-129
427
Leva PE, Aguiar MR, Oesterheld M (2009) Underground ecology in a Patagonian steppe: Root traits permit
428
identification of graminoid species and classification into functional types. Journal of Arid Environments
429
73: 428-434
430
Liu L, Gan Y, Bueckert R, Van Rees K (2011) Rooting systems of oilseed and pulse crops I: Temporal growth
431
patterns across the plant developmental periods. Field Crops Research 122: 256-263
432
Lynch JP, Brown KM (2012) New roots for agriculture: exploiting the root phenome. Philosophical Transactions
433
of the Royal Society B-Biological Sciences 367: 1598-1604
434
Manschadi A, Hammer G, Christopher J, deVoil P (2008) Genotypic variation in seedling root architectural traits
435
and implications for drought adaptation in wheat (Triticum aestivum L.). Plant and Soil 303: 115-129
436
Gandarillas H. 1984. Obtención experimental de Chenopodium quinoa Willd. MACA, IBTA. La Paz, Bolivia. 21
437
p.
438
Nibau C, Gibbs DJ, Coates JC (2008) Branching out in new directions: the control of root architecture by lateral
439
root formation. New Phytologist 179: 595-614
440
Nicotra AB, Babicka N, Westoby M (2002) Seedling root anatomy and morphology: an examination of ecological
441
differentiation with rainfall using phylogenetically independent contrasts. Oecologia 130: 136-145
442
Padilla FM, Pugnaire FI (2007) Rooting depth and soil moisture control Mediterranean woody seedling survival
443
during drought. Functional Ecology 21: 489-495
444
Pagès L (2011) Links between root developmental traits and foraging performance. Plant, Cell and Environment
445
34: 1749-1760
446
Palta JA, Chen X, Milroy SP, Rebetzke GJ, Dreccer MF, Watt M (2011) Large root systems: are they useful in
447
adapting wheat to dry environments? Functional Plant Biology 38: 347-354
448
Paula S, Pausas JG (2011) Root traits explain different foraging strategies between resprouting life histories.
449
Oecologia 165: 321-331
450
Picon-Cochard C, Pilon R, Tarroux E, Pagès L, Robertson J, Dawson L (2012) Effect of species, root branching
451
order and season on the root traits of 13 perennial grass species. Plant and Soil 353: 47-57
452
Poorter H, Niklas KJ, Reich PB, Oleksyn J, Poot P, Mommer L (2011) Biomass allocation to leaves, stems and
453
roots: meta-analyses of interspecific variation and environmental control. New Phytol 193:30-50
454
Reader RJ, Jalili A, Grime JP, Spencer RE, Matthew N (1993) A comparative study of plasticity in seedling rooting
455
depth in drying soil. Journal of Ecology 81: 543-550
13
Reyes F, Lillo A, Ojeda N, Reyes M, Alvear M (2011) Efecto de la exposición y la toposecuencia sobre actividades
457
biológicas del suelo en bosque relicto del centro-sur de Chile. Bosque 32: 255-265
458
Reynolds JF, Kemp PR, Ogle K, Fernández RJ (2004) Modifying the ‘pulse–reserve’ paradigm for deserts of North
459
America: precipitation pulses, soil water, and plant responses. Oecologia 141: 194-210
460
Richards R, Watt M, Rebetzke G (2007) Physiological traits and cereal germplasm for sustainable agricultural
461
systems. Euphytica 154: 409-425
462
Rojas W, Valdivia R, Padulosi S, Pinto M, Soto JL, Alcócer E, Guzmán L, Estrada R, Apaza V, Bravo R (2009)
463
From neglect to limelight: issues, methods ans approaches in enhancing sustainable conservation and use
464
of Andean grains in Bolivia and Peru. Journal of Agricultural and Rural Development in the Tropics and
465
Subtropics 92: 87-117
466
Roumet C, Urcelay C, Díaz S (2006) Suites of root traits differ between annual and perennial species growing in
467
the field. New Phytologist 170: 357-368
468
Singh V, van Oosterom EJ, Jordan DR, Messina CD, Cooper M, Hammer GL (2010) Morphological and
469
architectural development of root systems in sorghum and maize. Plant and Soil 333: 287-299.
470
Taub DR, Goldberg D (1996) Root system topology of plants from habitats differing in soil resource availability.
471
Functional Ecology 10: 258-264
472
Troll C, ed. (1968) Geo-ecology of the mountainous regions of the tropical Americas. Colloquium Geographicum,
473
vol. 9. Ferd. Dümmlers Verlag. Bonn, Germany
474
Vargas A, Elzinga D, Rojas-Beltran J, Bonifacio A, Geary B, Stevens M, Jellen E, Maughan P (2011) Development
475
and use of microsatellite markers for genetic diversity analysis of cañahua (Chenopodium pallidicaule
476
Aellen). Genetic Resources and Crop Evolution 58: 727-739
477
Wasson AP et al. (2012) Traits and selection strategies to improve root systems and water uptake in water-limited
478
wheat crops. Journal of Experimental Botany 63: 3485-3498
479
White PJ, George TS, Gregory PJ, Bengough AG, Hallett PD, McKenzie BM (2013) Matching roots to their
480
environment. Annals of Botany 112: 207-222
481
Wright IJ, Westoby M (1999) Differences in seedling growth behaviour among species: trait correlations across
482
species, and trait shifts along nutrient compared to rainfall gradients. Journal of Ecology 87: 85-97
14
LIST OF THE TABLES
484
485
Table 1 Origin of the four studied Chenopodium populations.
486
Table 2 Mean values of seed mass, and plant and root system traits of four Chenopodium populations at 42 DAS.
487
SM: individual seed mass (mg/seed), TPM: total plant mass (g/plant), LA: leaf area (cm²/plant), PH: plant height
488
(cm), R:S: root shoot ratio (g/g), RCD: root collar diameter (mm), SRL: specific root length (m/g), TRL: total root
489
length (m/plant), TTN: total tip number, TLN: total link number, TQI: topological quotient index, TSI: topological
490
slope index, MLL: mean link length (II: Internal–Internal links, EI: External–Internal links, EE: External–External
491
links). (data show mean ± standard error, n = 5 except for SM (n = 120), different letters within a row show
492
significant differences at P = 0.05)
15
Table 1 Origin of the four studied Chenopodium populations.494
Species Code Provenance Latitude Longitude Altitude (m)
Rainfall mean (mm/year)
SOM range (%)a
C. hircinum HI Aranjuez, Bolivia 16°33’S 68°36’W 3.200 550 0.4 – 1.5 C. pallidicaule PA La Paz, Bolivia 17°30’S 68°36’W 3.600 550 0.4 – 1.5 C. quinoa QB Jirira, Bolivia 19°51’S 67°34’W 3.700 250 0.2 – 0.4 C. quinoa QC Cunco, Chile 38°56’S 72°03’W 200 1.200 7 – 29 SOM: soil organic matter
495
a sources: HI, PA and QB: Lebonvallet (2008); QC: Alvear et al. (2005) and Reyes et al. (2011).
496
497
Table 2 Mean values of seed mass, and plant and root system traits of four Chenopodium populations at 42 DAS.
498
SM: individual seed mass (mg/seed), TPM: total plant mass (g/plant), LA: leaf area (cm²/plant), PH: plant height
499
(cm), R:S: root shoot ratio (g/g), RCD: root collar diameter (mm), SRL: specific root length (m/g), TRL: total root
500
length (m/plant), TTN: total tip number, TLN: total link number, TQI: topological quotient index, TSI: topological
501
slope index, MLL: mean link length (cm; II: Internal–Internal links, EI: External–Internal links, EE: External–
502
External links). (data show mean ± standard error, n = 5 except for SM (n = 120), different letters within a row
503
show significant differences at P = 0.05).
504
505
Traits C. quinoa (dry habitat) C. quinoa (wet habitat) C. hircinum C. pallidicaule SM 4.89 ± 0.10 a 2.09 ± 0.04 b 1.50 ± 0.04 c 0.6 ± 0.01 d TPM 2.00 ± 0.37 a 0.87 ± 0.10 b 0.40 ± 0.08 c 0.13 ± 0.03 d LA 98.0 ± 3.7 a 54.0 ± 1.3 b 21.7 ± 4.8 c 10.0 ± 2.3 d PH 8.4 ± 0.5 a 5.9 ± 0.5 b 4.5 ± 0.4 bc 3.5 ± 0.4 c R:S 0.28 ± 0.01 a 0.39 ± 0.02 b 0.45 ± 0.01 c 0.31 ± 0.03 ab RCD 4.90 ± 0.49 a 3.47 ± 0.49 b 2.31 ± 0.28 c 1.34 ± 0.27 d SRL 57.9 ± 3.82 a 75.1 ± 12.2 ab 106.5 ± 10.0 b 179.7 ± 15.3c TRL 24.1 ± 3.4 a 16.4 ± 2.6 ab 12.7 ± 2.0 b 4.8 ± 0.4 c TTN 525 ± 14.3 a 663 ± 12.4 b 449 ± 11 c 140 ± 8.1 d TLN 1122 ± 64.6 a 1398 ± 62 b 816 ± 61.2 c 283 ± 46.1 d TQI 0.77 ± 0.01 a 0.77 ± 0.01 a 0.77 ± 0.01 a 0.77 ± 0.01 a TSI 0.72 ± 0.04a 0.80 ± 0.04 ab 0.87 ± 0.03 b 0.85 ± 0.04 ab MLL II 1.0 ± 0.03 a 0.6 ± 0.02 b 0.5 ± 0.01 c 0.6 ± 0.03 b MLL EI 2.0 ± 0.05 a 1.2 ± 0.03 b 1.7 ± 0.04 c 1.6 ± 0.08 c MLL EE 1.7 ± 0.09 a 1.8 ± 0.11 a 1.8 ± 0.15 a 2.4 ± 0.28 b506
16
LIST OF THE FIGURES
507
508
Fig. 1 Time course of the root system growth of two typical plants of Chenopodium hircinum (above) and
509
Chenopodium quinoa from dry habitat (below) as observed in the rhizotron (DAS: days after sowing).
510
Fig. 2 Root system topology: (a) Link types: EE (External-External), EI (External-Internal), II
(Internal-511
Internal). (b) Maximally herringbone topology: magnitude = altitude = 8. (c) Maximally dichotomic topology:
512
magnitude = 8, altitude = 4. In (b) and (c), the first number in each pair is the altitude from the root collar and the
513
second the link magnitude (modified from Arredondo and Johnson 1999).
514
Fig. 3 Total root length distribution in the soil profile at 42 DAS in dry-habitat C. quinoa (QB), wet-habitat C.
515
quinoa (QC), C. hircinum (HI) and C. pallidicaule (PA) (mean ± standard error, n = 5, letters show statistical
516
differences between populations at a given depth, P < 0.05).
517
Fig. 4 Vertical distribution of the mean number of new lateral roots appearing on the taproot during the
518
experiment in dry-habitat C. quinoa (QB), wet-habitat C. quinoa (QC), C. hircinum (HI) and C. pallidicaule
519
(PA) (each point is the mean of n = 5 plants).
520
Fig. 5 Logarithmic regression of altitude (α) on magnitude (μ) of the root system observed during the experiment
521
in dry-habitat C. quinoa (), wet-habitat C. quinoa (), C. hircinum () and C. pallidicaule () (y = 0.81x +
522
0.08, r2 = 0.96, n = 80 ; the dotted line corresponds to a maximally herringbone topology; see Material and
523
Methods for definitions of altitude and magnitude).
524
Fig. 6 Mean cumulative length of the internal-internal (II), external-internal (EI) and external-external (EE) root
525
links per plant in the four studied Chenopodium populations (dry-habitat C. quinoa: black, wet-habitat C. quinoa
526
from wet habitat: dark grey, C. hircinum: light grey, C. pallidicaule: white) (n = 5, vertical bars show standard
527
errors, insets show root length on a log scale for a better appreciation of changes at early stages, see Fig. 2 for the
528
definition of II, EI and EE links).
529
Fig. 7 Mean number of internal-internal (II), external-internal (EI) and external-external (EE) root links per plant
530
in four Chenopodium populations (same color chart as in Fig. 6) (n = 5, vertical bars show standard errors, insets
531
show link number on a log scale for a better appreciation of changes at early stages, see Fig. 2 for the definition
532
of II, EI and EE links).
533
Fig. 8 Mean length of the internal-internal (II), external-internal (EI) and external-external (EE) root links in the
534
four studied Chenopodium populations (same color chart as in Fig. 7) (n = 5, vertical bars show standard errors,
535
see Fig. 2 for the definition of II, EI and EE links).
17
537
538
539
Fig. 1 Time course of the root system growth of two typical plants of Chenopodium hircinum (above) and
dry-540
habitat Chenopodium quinoa (below) as observed in the rhizotron (DAS: days after sowing).
541
18
543
Fig. 2 Root system topology: (a) Link types: EE (External-External), EI (External-Internal), II (Internal-Internal).
544
(b) Maximally herringbone topology: magnitude = altitude = 8. (c) Maximally dichotomic topology: magnitude =
545
8, altitude = 4. In (b) and (c), the first number in each pair is the altitude from the root collar and the second the
546
link magnitude (modified from Arredondo and Johnson 1999).
547
548
19
549
Fig. 3 Total root length distribution in the soil profile at 42 DAS in dry-habitat C. quinoa (QB), wet-habitat C.
550
quinoa (QC), C. hircinum (HI) and C. pallidicaule (PA) (mean ± standard error, n = 5, letters show statistical
551
differences among populations at a given depth, P < 0.05).
552
553
20
554
555
556
557
Fig. 4 Vertical distribution of the mean number of new lateral roots appearing on the taproot during the experiment
558
in dry-habitat C. quinoa (QB), wet-habitat C. quinoa (QC), C. hircinum (HI) and C. pallidicaule (PA) (each point
559
is the mean of n = 5 plants).
560
561
21
562
563
564
Fig. 5 Logarithmic regression of altitude (α) on magnitude (μ) of the root system observed during the experiment
565
in dry-habitat C. quinoa (), wet-habitat C. quinoa (), C. hircinum () and C. pallidicaule () (y = 0.81x +
566
0.08, r2 = 0.96, n = 80 ; the dotted line corresponds to a maximally herringbone topology; see Material and Methods
567
for definitions of altitude and magnitude).
568
569
22
570
Fig. 6 Mean cumulative length of the internal-internal (II), external-internal (EI) and external-external (EE) root
571
links per plant in the four studied Chenopodium populations (dry-habitat C. quinoa: black, wet-habitat C. quinoa:
572
dark grey, C. hircinum: light grey, C. pallidicaule: white) (n = 5, vertical bars show standard errors, insets show
573
root length on a log scale for a better appreciation of changes at early stages, see Fig. 2 for the definition of II, EI
574
and EE links).
575
576
23
577
Fig. 7 Mean number of internal-internal (II), external-internal (EI) and external-external (EE) root links per plant
578
in four Chenopodium populations (same color chart as in Fig. 6) (n = 5, vertical bars show standard errors, insets
579
show link number on a log scale for a better appreciation of changes at early stages, see Fig. 2 for the definition of
580
II, EI and EE links).
581
582
24
583
Fig. 8 Mean length of the internal-internal (II), external-internal (EI) and external-external (EE) root links in the
584
four studied Chenopodium populations (same color chart as in Fig. 6) (n = 5, vertical bars show standard errors,
585
see Fig. 2 for the definition of II, EI and EE links).