Supporting information
Improvement of the electrochemical performance by partial chemical
substitution into the lithium site of titanium phosphate-based
electrode materials for lithium-ion batteries: LiNi
0.25Ti
1.5Fe
0.5(PO
4)
3Mohammed Srouta,b, Mario El Kazzic, Hicham Ben Youcefd, Katharina M. Frommb, Ismael
Saadounea,d
aIMED-Lab., Faculty of Science and Technology- Cadi Ayyad University, Av. A. El Khattabi, P.B..549
Marrakesh, Morocco
bUniversity of Fribourg, Department of Chemistry, Chemin du Musee 9, CH-1700 Fribourg, Switzerland cElectrochemistry Laboratory, Paul Scherrer Institute, CH-5232 Villigen PSI, Switzerland
dMohammed VI Polytechnic University, Lot 660-Hay Moulay Rachid, Ben Guerir, Morocco
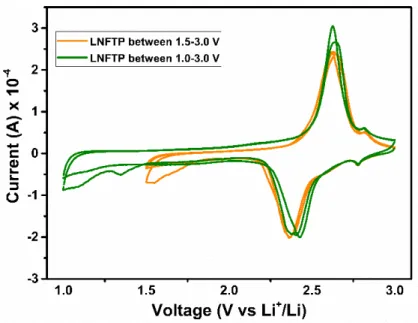
Figure SI-2: CV curves of the LNFTP at both voltage ranges 1.5-3.0 V and 1.0-3.0 V
measured at slow scan rates of 0.02 mV/s
Figure SI-3: Nyquist plots of the LNFTP@C material at different states of discharge/charge:
at the OCV (left) at 1.0V, 0.5V and 3.0V (right).
Figure SI-4: XPS data of C1s, F2p, Ti2p and P2p at different states of charge
Table SI-1: Atomic positions of the LNFTP material obtained via Rietveld Refinement
LNFTP Atoms x y z B Occ. Mult
R-3c Ni 0.0000 0.0000 0.0000 1 0.5 6 Li1 0.0000 0.0000 0.0000 1 0.5 6 Li2 0.5962(4) 0 0.25 1 0.25 18 Fe 0.0000 0.0000 0.1394(2) 1.08(1) 0.5 12 Ti 0.00000 0.0000 0. 1394(2) 1.08(1) 1.5 12 P 0.2906(6) 0.0000 0.25000 3.2(2) 3.0 18 O1 0.1754(8) -0.0195(9) 0.1892(4) 1.9 (2) 6.0 36 O2 0.1915(8) 0.1688(5) 0.0809(5) 1 6.0 36 Rp: 9.11 % Rwp: 8.14 %
Table SI-2: Calculated interatomic distances (Å) of the LNFTP material
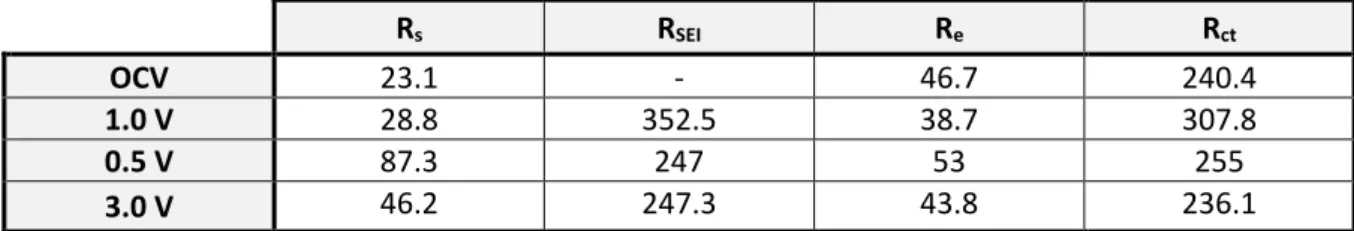
(M)-(O) d (Å) ( Li1 )-( O2 ) <Li-O> 2.28(9) x6 2.28 ( Ni )-( O2 ) <Ni-O> 2.28(9) x6 2.28 (Li2 )-( O1) (Li2 )-( O1) (Li2 )-( O2) (Li2 )-( O2) <Li-O> 3.103(9) x2 2.429(8) x2 2.112(7) x2 2.397(5) x2 2.5103 (Fe )-( O1) (Fe)-(O2) 1.889(8) x3 1.963(9) x3 (Ti)-(O1) (Ti)-(O2) <Fe,Ti-O> 1.889(8) x3 1.963(9) x3 1.926 (P)-(O1) (P)-(O2) <P-O> 1. 556(9) x2 1. 493(7) x2 1.5245Table SI-3:R value of the fitted Nyquist curves of the carbon coated LNFTP@C electrode at
different states of charge/discharge
Rs RSEI Re Rct
OCV 23.1 - 46.7 240.4
1.0 V 28.8 352.5 38.7 307.8
0.5 V 87.3 247 53 255