SEDIMENTS, SEC 4• SEDIMENT-ECOLOGY INTERACTIONS • RESEARCH ARTICLE
Does the invasive plant, Impatiens glandulifera , promote soil
erosion along the riparian zone? An investigation on a small
watercourse in northwest Switzerland
Philip Greenwood&Nikolaus J. Kuhn
Received: 16 July 2013 / Accepted: 4 December 2013 / Published online: 20 December 2013 # Springer-Verlag Berlin Heidelberg 2013
Abstract
Purpose The invasive plant, Impatiens glandulifera (com-mon English name: Himalayan Balsam), is now found in many river catchments in most European countries. Its pref-erence for damp, nutrient-rich soils, along with its intolerance to cold weather and rapid dieback, has implicated it in pro-moting soil erosion along the riparian zone. Despite the im-plication, its influence on the sediment dynamics of river systems remains unconfirmed. This communication reports the preliminary findings of ongoing work to investigate a possible link between I. glandulifera and accelerated erosion rates in inland river systems.
Materials and methods Erosion pins, a micro-profile bridge, and a digital caliper were employed to measure changes in the soil surface profile (SSP) at six separate locations, each con-taminated with I. glandulifera , along the riparian zone of a small watercourse in northwest Switzerland. Changes in SSP were also measured at an identical number of nearby locations supporting natural vegetation, in order to establish baseline erosion conditions. Soil surface profiles at all 12 locations were re-measured on seven separate occasions, from October 2012 to May 2013. This covers the time before dieback occurred to the germination and seasonal regrowth of new plants.
Results and discussion A total of 720 individual SSP mea-surements were recorded during the above monitoring period. Increasingly negative values relative to initial values were documented at most transects, indicating a net reduction in soil surface elevations. This is interpreted as evidence of the
removal (i.e., erosion) of surface material. Paired samples statistical analysis of the data indicate that erosion from con-taminated sites was significantly greater than erosion from topographically comparable reference sites (t =−5.758; P <0.05; N =359) supporting natural vegetation.
Conclusions The results provide tentative yet compelling ev-idence that I. glandulifera promotes soil erosion along the riparian zone of the watercourse investigated. Given the unre-lenting spread of this notoriously invasive plant throughout inland river systems in many countries, the likelihood of greater quantities of nutrient-rich sediment entering into aquatic environments may steadily reduce water quality in all affected catchments. An absence of effective control mea-sures capable of halting or even slowing its rate of invasion may make it increasingly difficult for affected European Union member states to meet and then maintain key water quality standards set by the Water Framework Directive (WFD) when fully implemented in 2015.
Keywords Impatiens glandulifera (Himalayan Balsam) . Erosion pins . Invasive plant . Micro-profile bridge . Riparian zone . Soil surface profile
1 Introduction
1.1 Impatiens glandulifera
I. glandulifera is a non-native annual plant that was intro-duced into parts of Europe from the Himalayas during the mid-nineteenth century as a colorful adornment to parks and gardens. Its tendency to invade and threaten the ecological stability of indigenous ecosystems was first noted in the UK in the 1930s (Royal Horticultural Society (RHS) 2013). Since then, it has rapidly expanded its territory where it is now well established in the majority of temperate northern and central
Responsible editor: Geraldene Wharton P. Greenwood (*)
:
N. J. KuhnPhysical Geography and Environmental Change Research Group, Department of Environmental Sciences, University of Basel, Klingelbergstrasse 27, Basel 4056, Switzerland
European countries (Beerling and Perrins1993; Pyšek and
Prach1995; Kollman and Bañuelos2004; Hejda2006; Hejda and Pyŝek2006; Helmisaari2010; Malíková and Prach2010; RHS2013), as well as in New Zealand (Hulme and Bremner
2006), and also throughout eastern and western regions of both the United States and Canada (Natural Resources Con-servation Service (NRCS)2013). Despite early recognition of the invasive threat posed by this plant and the fact that the problem has escalated and is now of international concern, efforts to control its spread in affected countries have met with limited success (Wadsworth et al.2000). This is primarily due to its ability to rapidly establish and“crowd-out” indigenous or“naturalized” vegetation. Given its invasive yet ”natural-ized” status in many affected countries (Helmisaari2010), the original emphasis on eradication espoused by relevant envi-ronmental management and conservation organizations (e.g., EA2010; CPS-SKEW2012; NUS2012; CC2013; FWAG
2013; ISI 2013; NWT 2013; RAFTS, 2013; RHS 2013; WSBRC2013) has now tended to shift, largely for pragmatic reasons, to strategies that involve limiting its territory by reducing its movement into uncolonized catchments.
Methods of control in catchments already contaminated are very limited. Arguably, one of the most effective approaches is by physical removal through pulling and then destroying the cut material, usually by burning on-site. Although this pro-vides immediate success over small areas, it is impractical to implement over whole river systems and for longer timescales due to the sustained level of commitment needed to regularly monitor and ensure cleared areas remain free of recontamina-tion for at least 2–3 years after initial clearance. The approach is, therefore, usually considered to be unsustainable in the long-term, since it is labor-intensive, time-consuming, and prohibitively expensive to maintain. For these reasons, the method largely remains in the domain of semi-professional conservation organizations that, in turn, are usually dependent on volunteers to actually undertake the work. Realistically therefore, numerous impracticalities limit the number of catchments that can be targeted with any effectiveness. In addition, the problem of recontamination is exacerbated by the fact that I. glandulifera has exceptionally tenacious regen-erative abilities. Plants can easily re-establish themselves, either as a consequence of their incomplete removal, and/or through the migration of propagules inadvertently transported back into river systems (Helmisaari2010; RHS2013). 1.2 Preferred habitat and key life-cycle traits of I. glandulifera I. glandulifera thrives in damp, nutrient-rich soils that expe-rience frequent disturbance, such as riparian zones (Wadsworth et al.2000; Hulme and Bremner2006; FOEN
2013), which are defined for the purpose of this investigation as areas adjacent to a watercourse that experience frequent flooding (Goodson et al.2002). Such areas are increasingly
viewed as an important interface between terrestrial and aquat-ic environments due to the large number of important ecosystem-services that they provide. These include promot-ing and maintainpromot-ing the geomorphic stability of riverbanks (Goodson et al.2002), moderating stream flow, and offering pollution-protection by filtering, slowing, and detaining the transfer of diffuse nutrients and soil-sorbed contaminants (Heckrath et al. 2008; Neary et al. 2010; Gilvear et al.
2013). Their ability to fulfill this environmental service is heavily dependent on sustaining year-round vegetation cover (Mallik and Richardson2009), as this contributes to maintain-ing the structural integrity of the riparian zone by protectmaintain-ing the soil against erosion and also by trapping and retaining fine sediment (Morgan 1993; White 1997; Le Bissonais et al.
2005; Nanko et al.2008). The ability of riparian areas to fulfill this role may be compromised; however, due to certain phys-iological and life-cycle traits associated with I. glandulifera that enable it to rapidly establish and out-compete most native or naturalized flora. Key traits include, inter alia, the synchro-nous germination and simultaneous growth of a dense aerial canopy that suppresses the germination and growth of native vegetation by limiting the duration and intensity of sunlight reaching smaller plants. The tall (~2–3 m) stature of mature I. glandulifera plants and their tendency to form dense patches, or ”stands,” often crowd out smaller indigenous vegetation, again, by reducing the available sunlight. I. glandulifera is also able to self-pollinate, and mature (flowering) plants tend to over-produce nectar, which then draws pollinating insects away from less prodigious nectar-producing plants (Hejda 2006). Mature I. glandulifera can also produce up to 2,500 seeds per plant which are dispersed using an explosive ejection mechanism that can propel (i.e., dehisce) individual seeds up to ~10 m from the parent plant (Chapman and Gray2012; FOEN2013; RHS2013). In com-bination, these characteristics have facilitated its rapid coloni-zation through inland river systems where largely mono-cultural stands typically concentrate along the riparian zone (Fig.1). The areal extent of individual stands can range from a few square meters to >1,000 m2, and plant densities can exceed 40–50 individuals per square meter (Beerling and Perrins1993; Pyšek and Prach1995; Kollman and Bañuelos
2004; Hulme and Bremner2006). Its preference for damp conditions and proximity to flowing water has thus facilitated its rapid expansion using watercourses which act as ”con-duits” that readily transport seeds and propagules downstream into un-colonized parts of river systems (Dawson and Holland
1999; Chapman and Gray2012).
1.3 Soil loss from areas colonized by I. glandulifera
I. glandulifera is highly intolerant to cold weather and plants of all ages are rapidly killed by the first frosts of the year (Beerling and Perrins1993; Helmisaari2010; Skálová et al.
2011). During seasonal ”dieback” stems lose their turgidity, foliage shrivels, and whole stands simultaneously collapse within a very short period of time. When this happens, the protection afforded to the underlying soil by the previously dense canopy rapidly vanishes, leaving areas along the ripar-ian zone devoid, or partially devoid, of protective vegetation cover. In temperate European countries, dieback generally occurs during the period when precipitation levels are often high and/or most intense and/or prolonged (Weatherspark 2012). The absence of protective vegetation, combined with prolonged or intense precipitation, thus potentially raises the risk of erosion along unprotected parts of the riparian zone and may increase the amount of fine sediment entering into wa-tercourses in excess of that mobilized by typical erosion processes (Roblin1994). Given the lack of suitable interven-tion strategies to halt or even slow the rate of infestainterven-tion of I. glandulifera, it could be argued that this continuing cycle of events potentially represents an unfolding environmental ca-tastrophe, as it may have an increasingly deleterious influence on water quality. This is due to the fact that fine-grained sediment not only acts as a vector for the transfer of soil-sorbed nutrients and contaminants (Walling et al.2003), but suspended sediment in sufficient concentrations is detrimental to the health and functioning of aquatic ecosystems per se (Greig et al. 2005; Walling 2005; Petticrew et al. 2007; Walling and Collins2008).
Against this background, numerous river management practitioners and conservation organisations speculate that I. glandulifera may promote soil erosion along the riparian zone of inland watercourses (e.g. Dawson and Holland1999; EA2010; NUS2012; CC2013; FWAG2013; ISI2013; NWT
2013; RAFTS, 2013; WSBRC 2013). Despite this strong possibility, however, its eco-hydromorphic influence on the sediment dynamics of river systems has not, as far as the authors are aware, been formally investigated and quantified. Motivated by this stark lack of information, the objectives of the study were to: (1) measure the soil surface profile (SSP)
evolution at discrete areas along parts of a riparian zone contaminated with I. glandulifera ; (2) measure the SSP evolution at nearby areas with similar topography as contaminated locations but supporting natural vegetation, and; (3) statistically compare data from both groups in order to determine whether the difference in SSP evolution is significant.
2 Materials and methods 2.1 The study catchment
The investigation was undertaken in northwest Switzerland, approximately 15 km south of the city of Basel, along a reach of a small gravel-bed stream situated on an easterly flank of the Jura mountain range (Fig.2). The watercourse, known as the Ibach, is ca. 10 km long from source to confluence, is classified as a first-order stream and flows predominantly northwards at an average elevation of 500 m above mean sea level until its confluence with the Birs River, itself a sub-catchment of the Rhine River system. Although the Ibach is geomorphologically ”under-fit” its dissection through lime-stone bedrock has led to the formation of a system of ravines, or ghylls, with characteristically steep-sided cliffs and pinched floodplains. The catchment area upstream of the chosen study reach is ca. 8 km2, and the stream gradient is approximately 1:150 (ca. 0.7%). The width of the floodplain valley is be-tween 20 and 30 m (average ~25 m); channel widths during low flow are typically between 3.5 and 5.5 m, and the mean depth of water during such conditions is ~0.11 m. No official hydrological or water quality records are available for this particular watercourse, but channel dimensions and water velocity measurements taken during periods of low flow indicated that base-flow is approximately 0.2 m3s−1. Samples of river water were taken from the same location within the study site over a range of different flow conditions and always from the middle of the water column in order to gain an indication of the suspended sediment concentration (SSC). Given that the turbidity of the river water indicated that the SSC would be low, evaporation was considered to be the most accurate method to recover all of the solid material. Samples were thus weighed to an accuracy of four decimal places and then placed in an oven at 60°C until all of the water was evaporated away. The remaining material was then weighed to the same accuracy as above, and the results re-vealed that the average SSC (n = 20) was approximately 15 mg l−1(SD ± 0.35), equivalent to 15 Nephelometric Tur-bidity Units (Neary et al.2010; Kronvang et al.2013). Mean annual precipitation for the region is ca. 1,050 mm and peak precipitation, at approximately 91 mm per month, occurs from May to September. Autumn and winter months generally receive ~80% of the equivalent monthly maximum (73 mm)
Fig. 1 I. glandulifera typically forms into discrete and often monocul-tural stands along the riparian zone of inland watercourses
precipitation, much of which usually falls as snow. Vegetation within the catchment consists of both sparse and dense areas of young and mature deciduous woodland species, with an understory of both lower- and higher-order vegetation types, the most abundant of which, identified to genus level only, include Allium spp ., Anenome spp ., Hedera spp ., Ranunculus spp ., Trifolium spp., and Urtica spp .
Aside from fundamental factors such as location and ease of access, this particular reach was selected principally due to the prevalence of I. glandulifera, which was well-established and had formed discrete stands along parts of the riparian zone. Indeed, an appraisal of the spatial extent of contamina-tion within the study reach was undertaken prior to commenc-ing the investigation, and this indicated that I. glandulifera occupied an estimated 2.5% of the total floodplain area (equivalent to ca. 750 m2). In addition, contamination imme-diately adjacent to the main channel was estimated at 100 linear meters, or approximately 5% of the reach length. 2.2 Identifying contaminated and reference locations Six discrete areas supporting stands of I. glandulifera were identified along the riparian zone of a 1.0 km stretch of the Ibach (coordinates, 47°25′ 09.80″ N; 7°34′24.19″ E to 47°25′ 46.38″ N; 7°34′08.68″ E). The spatial extent of contamination at the six chosen sites ranged from between 3 to >200 m2; the density of I. glandulifera plants was estimated at between >10 m2 to ~50 m2, and average localized slope gradients ranged from 5 to 35%. A suitable analogue, or”partner” site, supporting an assemblage of natural, or naturalized, vegeta-tion was also identified as close to each contaminated locavegeta-tion as possible in order to obtain baseline, or reference, erosion rates and thus permit changes in the SSP evolution between the two groups to be statistically compared. All reference locations were situated within 8 m of their contaminated partner location, and all were deliberately selected for their generally similar topographic (i.e., slope) characteristics and their position relative to the stream channel. Vegetation cover at the time that the reference transects were installed was estimated at between 80 and 95%. Soil textural characteristics were determined for all sites based on the respective percent-age proportions of sand, silt and clay. Values were generally similar throughout the study reach and soils were texturally classified as either sandy loam or sandy silt loam, based on the classification system adopted by Hodgson (1974, in White
1997). Table1lists key areal, topographic, soil textural, and vegetation density characteristics for contaminated and refer-ence locations at all six sites. Despite attempts to select areas with similar spatial characteristics on which pairs of contam-inated and reference transects could be installed and moni-tored, in some instances, the rocky terrain and/or shallow soil profile meant that some transect pairs were installed, by ne-cessity, at slightly different elevations. The net difference
between the elevation of the upslope and downslope pins for each pair of transects, along with the mean difference in elevation, are listed in Table2for all sites.
2.3 Measuring changes in soil surface profiles
Erosion pins, a micro-profile bridge and a Vernier Caliper were chosen as the preferred method for measuring temporal changes in SSP evolution. Despite questions being raised over the ability of erosion pins to provide representative data (e.g., Haigh1977; Loughran1989; Collins and Walling2004), their effectiveness has been proven in a wide range of environ-ments, including riparian zones, during investigations of a similar nature (e.g., Thorne 1981; Lawler 1986; Fanning
1994; Lawler et al.1999; Couper et al. 2002; Keay-Bright and Boardman2009; Boardman et al.2010; Kronvang et al.
2013). Their use, combined with a micro-profile bridge (Shakesby1993; Fister et al.2013; Greenwood et al.2013), was thus considered the most appropriate method, inasmuch as data collection is rapid, can be undertaken by a single operator (cf. Couper et al. 2002), and crucially, from the perspective of this investigation, permits measurements to be taken through dense foliage whilst causing minimal distur-bance to the underlying soil and to the surrounding vegetation. 2.4 Site installation and the measurement protocol
At each contaminated and reference location, two 6 mm dia. erosion pins (hereafter collectively referred to as a”transect”) were inserted into the soil profile at a distance of 1.2 m apart and at right-angles (i.e., at 90°) to the river channel where possible (Loughran 1989). Pins were inserted into the soil profile to a sufficient depth to ensure that an adequate pur-chase was obtained. Due to variations in the available depth of soil profile and/or exposure of the bedrock at some of the chosen sites, the length of pins were tailored to suit site-specific conditions and meant that pins ranged in length from 0.5 to 2.0 m. Once a sufficient purchase was obtained, each pin was then cut in situ so that ca. 50 mm protruded above the soil surface. Installing pins in this configuration and orienta-tion, relative to the river channel, combined with the generally sloping topography along the riparian zone resulted in one transect at each contaminated and reference location, with each transect consisting of one pin positioned upslope and the second pin positioned 1.2 m further downslope. Immedi-ately after installation, the elevation of pins was determined relative to a respective datum point established near to each pair of transects at each site. In order to increase the spatial extent over which SSP data could be acquired, a micro-profile bridge (hereafter referred to as a”profile bridge”) was used to span the 1.2 m distance between the upslope and downslope pins and thus act as a semi-permanent reference from which the distance to the underlying SSP could be measured as
precisely as possible (Shakesby1993). The profile bridge was fabricated from lightweight yet extremely rigid 20×20 mm aluminium”box-section.” The chosen method of mounting the profile bridge onto the erosion pins was simplified from that described in Shakesby (1993), however, and was achieved by firstly removing a 50 mm long by 6.5 mm wide section of metal from along the central underside of the bridge at each end. The distance between the cut-away sections corresponded with the distance between pairs of erosion pins and provided a means of physically mounting the bridge onto the pins until the underside of the top of the bridge rested against the top of the pins. This simple yet effective method ensured that the profile bridge could be rapidly and securely
mounted consistently at the same elevation each time mea-surements were taken. In order to ensure that SSP measure-ments were taken at exactly the same location along transects, ten holes, each 5 mm dia., were drilled at 0.1-m intervals along the central 1.0 m section of the profile bridge. As part of a measurement protocol, a number from 1 to 10 was allocated and marked accordingly next to each hole on the bridge. When taking measurements, the bridge was always mounted onto the pins so that Number 1 position was upslope (i.e., furthest away from the river channel) and Number 10 position was downslope (i.e., nearest the river channel). A schematic show-ing the cross-profile configuration of a transect and a mounted profile bridge with the ten measurement points is shown in
Fig. 2 A map showing the location of the River Ibach, in northwest Switzerland, and the relevant section of the study reach. Reproduced by permission of Swisstopo (BA13075)
Fig.3. When taking measurements, a digital Vernier caliper (KRAFTIXX™, Stuhr, Germany) capable of measuring from 0 to 155 mm to an accuracy of one decimal place was placed onto the profile bridge and precisely aligned so that the tip of the caliper could be freely extended through each hole to the soil surface below. Adopting this approach (Fig.4) meant that the caliper remained perpendicular to the profile bridge and ensured that measurements were taken as consistently as possible. Organic material and any other detritus under each measurement position was carefully cleared in order to locate the soil surface proper. The caliper was then extend-ed until the tip touchextend-ed the underlying soil surface and the distance between was displayed on a digital read-out locat-ed on the caliper-head. Measurements were always record-ed from position 1 to position 10 (i.e., from upslope to downslope), and a duplicate set of measurements was re-corded immediately after the first set in the same order. This approach served to minimize errors when, for instance, identifying the boundary between the litter layer and the soil surface proper, or at times where the tip of the caliper rested against a near-vertical edge of a stone or down the side of small concavities or channels in the soil surface
(Shakesby 1993). Transects were installed at all sites on 24 October 2012, and the data were measured by the same operator (i.e., Greenwood) over the following 206-day pe-riod, to 18 May 2013. From the perspective of determining the influence of I. glandulifera on sediment dynamics in river systems, this period covers the most crucial stages in their lifecycle and includes the time before dieback oc-curred, to the seasonal germination and early regrowth of new plants. All transects were re-measured on seven sepa-rate occasions during the above period, and the average time-interval between re-measurements was 34 days.
3 Results
The elevation of all pins was re-measured periodically throughout the monitoring phase. This revealed that three pins, each from a separate contaminated transect, recorded a change in elevation of approximately 1 mm less than their original elevation relative to each respective datum point. Since this downward movement into the soil profile would result in underestimating the net downward retreat of the SSP and hence, underestimate equivalent soil losses from contam-inated areas, the data presented below were not corrected for this effect.
3.1 Data processing
Data from each transect were processed by firstly calculating the mean value of each of the ten duplicate measurements. The mean of the ten values was then calculated to determine the mean distance from the profile bridge to the soil surface. In order to quantify the net temporal change in SSP for each transect, the result from the latest re-measurement was subtracted from the result obtained from the previous re-measurement. The resultant data were then tabulated so that the evolution of the SSP at each transect could be tracked
Table 1 Key areal, topographic, soil texture, and vegetation density characteristics (estimated at the time of installation) for contaminated and reference transects at all six sites, River Ibach, Switzerland
Site ID Contaminated Reference Estimated area
of contamination (m2)
Average local gradient (%)
Soil texture Number individual plants (m2) Distance from reference site (m) Average local gradient (%) Soil texture Estimated vegetation cover (%)
Site 1 8 30 Sandy silt loam >25 5 32 Sandy silt loam >90 Site 2 >200 38 Sandy silt loam ~50 8 35 Sandy silt loam ~80 Site 3 6 14 Sandy loam ~30 7 12 Sandy silt loam ~85 Site 4 4 5 Sandy loam >10 4 5 Sandy silt loam ~80 Site 5 3 12 Sandy silt loam >25 8 10 Sandy loam ~95 Site 6 >150 23 Sandy silt loam ~35 7 20 Sandy silt loam >95
Table 2 Net differences in the elevation of up- and downslope erosion pins for contaminated and reference transects at all sites, and their average difference
Site ID
Net difference between upslope pin elevations (m)
Net difference between downslope pin elevations (m)
Average difference (m) Site 1 Comparable n/a
Site 2 Comparable n/a
Site 3 −0.470 −0.404 −0.437 Site 4 −0.110 −0.048 −0.079 Site 5 −1.025 −1.084 −1.055 Site 6 −0.404 −0.360 −0.382 n/a not applicable
between re-measurements and the net change between pairs of contaminated and reference transects could be directly com-pared for each site. This procedure was performed on data-sets derived from all seven re-measurements, and the results are presented in Fig.5. The net change in SSP for all transects was predominantly negative (i.e., signifying a reduction in the SSP), and this is interpreted as the removal of surface soil. In some instances, however, the net change was positive, and this effect was recorded almost exclusively at reference tran-sects. Possible reasons for this are discussed in a later section.
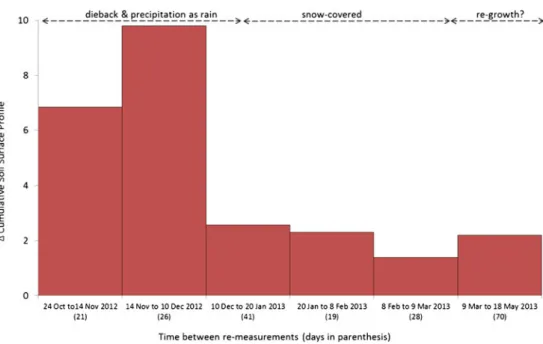
The net change in SSP elevation between re-measurements was summed for each group of transects and the net difference was calculated as a ratio value, in order to allow differences in the relative magnitude of SSP change to be compared between the two groups over the study period. In all instances, the net cumulative loss from contaminated areas exceeded the net cumulative loss at reference transects. The results of the procedure (Fig. 6) serve to highlight three distinct phases. Firstly, soil loss from contaminated areas greatly exceeded soil loss from comparable reference sites during the period mid-October to mid-December 2012. Secondly, the overall difference in the amount of surface material removed at the two groups of sites diminished sharply from mid-December 2012 and generally remained low until mid-May 2013. Lastly, the contribution of material from contaminated areas in-creased slightly from mid-March to mid-May 2013. Given the apparent differences in the evolution of the SSP at each pair of contaminated and reference transects, the resultant data from all sites were subjected to a paired-samples (two-tailed) t test, in order to determine whether the differences were sig-nificant. The test was performed at the 95% confidence level, and the result (t =−5.758; P <0.05; N =359) indicates that the reduction in SSP at contaminated transects is significantly greater than the reduction in SSP at reference transects. In order to test the possibility that time represented a dominant factor controlling soil loss from each group of transects, the net change in SSP recorded for each group of transects be-tween re-measurements was correlated against the amount of time (in days) between re-measurements using a non-parametric Spearman’s Rank correlation coefficient (rs),
per-formed at the 95% confidence level. Despite recording a weak inverse correlation for the relationships between time versus net SSP change at reference transects (r2=0.16) and a mod-erate direct relationship between the same independent vari-able versus net SSP change at contaminated transects (r2= 0.46), neither relationship was significant (P >0.05).
Fig. 3 A schematic showing the configuration of a transect with mounted profile bridge (not to scale)
Fig. 4 A digital caliper was systematically mounted onto the profile bridge in order to measure the distance to the underlying soil surface at each of the ten predetermined measurement positions along each transect
3.2 Quantifying soil losses from contaminated areas
Soil losses were calculated across the full estimated extent of each contaminated area using the same basic approach adopted by Haigh (1977), Loughran (1989), and Fanning (1994) and which firstly involved determining the mean net reduction in SSP over the 206-day period. Average net soil loss values (Table3), ranged from−5.12 mm (Site 3) to – 77.84 mm (Site 5). Using a mean soil bulk density value of 1.15 g cm−3measured at a depth of 0–5 cm and based on the average of three bulk density measurements taken at each contaminated site (N =18), soil loss values are listed in Table 3 for all sites over a range of relevant spatial and temporal scales. Actual soil loss estimates over the 206-day monitoring period ranged from 35.3 kg (Site 3) to 2003.2 kg (Site 6), which represent the equivalent of 28.58 to 434.52 g m−2 day−1, respectively, or approxi-mately 59 to 895 t ha−1 year−1, respectively.
3.3 Contrasting transect elevations
Given that some pairs of contaminated and reference transects were installed at slightly different elevations, there existed the possibility that those installed at lower elevations may have been subjected to fluvial attack during periods of high river flow, thereby exposing them to greater erosion than their partner transect located further upslope. Data previously shown in Table2revealed that the elevations of paired tran-sects at Sites 1 and 2 were generally comparable, with ap-proximately 50% of their lengths sharing a common elevation range. In contrast, contaminated transects at Sites 3, 4, 5, and 6 were an average of 0.437, 0.079, 1.055, and 0.382 m lower than their respective reference transect, thereby raising the possibility that higher erosion rates could be due to fluvial attack. As pairs of transects at all sites were installed on sloping topography and orientated as close to 90°to the stream channel as possible, linear correlation was believed to repre-sent a tenable method of assessing whether fluvial attack, as controlled by elevation, represented an influencing factor in determining rates of erosion over very short (linear) distances. Based on an assumption that the erosive effect of flowing water would be most prevalent at lower elevations (i.e., down-slope), principally due to the fact that such areas would be submerged more frequently and thus exposed to fluvial attack for longer periods of time in comparison with areas at higher elevations (i.e., further upslope) (Goodson et al.2002), rates of erosion should decline linearly with increasing elevation. Despite this process only being applicable at sites where contaminated transects were notably lower than reference transects (Table2), the statistical test was performed on data from all transects, since the findings presented so far indicated that detachment by impacting raindrops probably represented the predominant erosion process.
In order to test the strength of the relationship between elevation and erosion, the net change in SSP recorded from the beginning to the end of the monitoring phase was summed for each of the ten measurement positions along each transect. Each resultant data-set was then subjected to a non-parametric Spearman’s rank (rs) correlation
coeffi-cient test, the results of which are listed in Table4. For Site 1, a significant relationship was recorded between elevation and erosion at the contaminated transect. In contrast, and despite both transects sharing generally similar elevations, no significant relationship was recorded between the same variables at the reference transect. Similarly for Site 2, both transects shared generally similar elevations, yet no signif-icant relationship was recorded for those same variables stated above at either transect location. Despite the notably lower elevations of contaminated transects at Sites 4 and 6, no significant relationship was recorded between erosion and elevation at either location. The results from all four sites are interpreted as evidence that fluvial processes played no significant role in increasing erosion rates. For Sites 3 and 5, the significant relationship (P > 0.01) for the above variables recorded from both contaminated transects tentatively suggests that fluvial attack could be responsible for the higher rates of erosion.
4 Discussion
4.1 Accelerated erosion and implications for water quality Data presented in Fig.5illustrate that the net change in SSP evolution between re-measurements was predominantly neg-ative for the majority of transects. This indicates a net reduc-tion in SSP elevareduc-tions and is attributed to the removal, or erosion, of surface material. The result from the paired-samples t test presented above supports the hypothesis by providing tentative yet compelling evidence that I. glandulifera significantly promotes soil erosion along the section of the river system investigated. Given the proximity of contaminated locations to flowing water, combined with the generally sloping topography, and presumably limited opportunity for sediment storage within such areas, the soil loss values listed in Table 3, when expressed cumulatively represent an additional ca. 4,600 kg of fine sediment that entered into the watercourse from along a 1.0 km stretch of the riparian zone during the 6-/7-month monitoring period. Expressing this over standardized spatial and temporal scales, the above value represents an erosion rate of 783.44 g m−2 day−1, or the equivalent of additional 2,317.5 t ha−1year−1of fine sediment that entered the watercourse as a direct conse-quence of I. glandulifera. Indeed, if a similar extent of con-tamination is assumed along both sides of the watercourse and throughout its entire 10 km length, it is conjectured that this
plant could feasibly be responsible for promoting the mo-bilization of an additional ca. 100 t year−1of material from along the riparian zone into the watercourse. Given the lack of intervention strategies capable of halting, or even slowing the rate at which I. glandulifera is spreading throughout affected countries, the results from this investi-gation infer that its steady encroachment and increasing prevalence in inland river systems could have profound
implications for water quality in all contaminated catch-ments. Importantly, therefore, this scenario may be of par-ticular concern to all affected European Union (EU) mem-ber states, since those nations could find it increasingly difficult to meet and then maintain key water quality stan-dards needed to remain compliant with legislation set by the Water Framework Directive when fully implemented in 2015 (European Commission EC2010).
Fig. 5 The average net change in soil surface profile for contaminated and reference transects at all six sites, recorded: a over the first 21 days, between the second re-measurement and the initial (i.e., first) measure-ment; b over the next 26 days, between the third and second measuments; c over the next 41 days, between the fourth and third
measurements; d over the next 19 days, between the fifth and fourth measurements; e over the next 28 days, between the sixth and fifth re-measurements; and f over the next 70 days, between the seventh and sixth re-measurements
4.2 Rates of erosion and precipitation characteristics
Data presented in Fig. 6 for the 21-day period from mid-October to mid-November 2012 highlight the fact that cumu-lative erosion from areas contaminated with I. glandulifera exceeded cumulative erosion from reference areas supporting natural vegetation by a factor of ~7. The overall disparity between the two groups increased still further over the next 26-day period, from mid-November to mid-December 2012, when cumulative erosion from contaminated areas exceeded cumulative erosion from reference areas by a factor of ~10. Crucially, the prolonged and exceptionally high rate of erosion from contaminated areas during October to mid-December corresponds with the time when I. glandulifera plants died and the vegetation decayed. Logically, therefore, the physical protection afforded to the underlying soil would have steadily yet rapidly been depleted. This would have increased the exposure of contaminated areas to varying detachment and
mobilization processes and amplified the risk of erosion in comparison with areas supporting a continuous cover of nat-ural vegetation (Nanko et al.2008; Ries2010). It is also likely that modifications to primary raindrop characteristics, made by the upper tree canopy, could also have increased erosion from areas with depleted vegetation cover. Such alterations frequently lead to the coalescing of small raindrops into larger drops, which, paradoxically, can increase the erosivity poten-tial of secondary rainfall by a factor of almost three when compared against primary rainfall (Geißler et al.2012).
The overall difference in the rate of erosion between con-taminated and reference locations declined sharply from mid-December 2012 onwards (Fig. 6). Two main controls are believed to be responsible for this effect, both of which are precipitation-related. Firstly, the sharp reduction in erosion from contaminated areas after mid-December is attributed to the fact that precipitation fell as snow, which remained until the end of February 2013 and accumulated to an average
Fig. 6 The net change in soil loss between contaminated and reference transects expressed as ratio values
Table 3 The estimated areal extent of contamination at each site, the net change (Δ) in soil surface profile (SSP) value recorded from the begin-ning to the end of the 206-day monitoring period, and the predicted
quantity of soil eroded from each contaminated area, based on a mean bulk density value of 1.15 g cm−3
Site ID Estimated area of contamination (m2)
Average netΔ soil profile (mm)
Total soil loss (kg/206 days)
Soil loss (g m2day−1)
Total equivalent soil loss (t ha−1year−1) Site 1 8 −15.84 −145.7 −88.44 −261.6 Site 2 200 −8.77 −2017.0 −48.96 −144.8 Site 3 6 −5.12 −35.3 −28.58 −84.5 Site 4 4 −21.16 −97.3 −118.11 −349.4 Site 5 3 −77.84 −268.5 −434.52 −1285.4 Site 6 150 −11.61 −2003.2 −64.83 −191.8 Total 371.00 −140.34 −4567.16 −783.44 −2317.5
approximate depth of 0.15 m along the riparian zone. It is postulated, therefore, that the predominant sub-zero tempera-tures and prolonged absence of precipitation falling as rainfall would have provided limited opportunity for overland flow to develop. Any runoff that was generated during this period would presumably have had considerably less transport ca-pacity than if generated by rainfall, given the limited volume and gradual release of melt-water involved. Consequently, the sudden drop in erosion rates from contaminated areas from mid-December onwards is thought to be transport-capacity limited and is attributed to the prolonged absence of rainfall needed to generate surface runoff. Secondly, the step-wise reduction and increasing shift towards parity in the ratio of soil losses between the two groups from mid-December 2012 to mid-March 2013 (Fig.6) suggests that the supply of loose surface material at contaminated areas was gradually being depleted, or alternatively, that the rate at which loose material was being removed gradually exceeded the rate at which surface material was being detached. This, again, is believed to relate to the prolonged absence of precipitation as rainfall and is attributed to the absence of any effective detachment mechanism needed to replenish the supply of loose surface material. Consequently, the step-wise reduction in erosion rates from contaminated areas and the steady shift towards parity between the two groups from December to mid-March is believed to be supply limited. This is attributed to the gradual reduction in the amount of surface material available for mobilization at contaminated areas. Finally, data obtained during the last re-measurement, which spans a 70-day period from mid-March to mid-May 2013 (Fig.6), reveal a slight increase in the rate of erosion from contaminated areas. Pre-cipitation once again fell as rain during this period. Despite the fact that seasonal germination of new I. glandulifera plants
was well under way by this time, the level of cover afforded to the soil surface by the immature plants was presumably inad-equate to provide effective protection to the soil surface by impacting raindrops. Consequently, the slight increase in ero-sion recorded at contaminated locations over this period is believed to reflect the availability of newly detached material. If this prognosis is correct, this is believed to corroborate the previous hypothesis that reduced erosion rates, whilst snow covered the study area, was most probably supply limited, due to the shortage of loose material available for mobilization. 4.3 Positive changes in soil surface profiles
There are a number of possible reasons why the net change in SSP was positive for some transects. The first of those is the effect of frost heave over the winter period (Lawler 1986). Although this process cannot be entirely discounted for all sites, the fact that snow, which acts as a natural insulator and retards heat loss from the soil to the atmosphere (Smith1975; Williams and Smith 1989; Zhang2005), covered the study reach throughout most of the winter period renders this hy-pothesis unsatisfactory. The fact that liquid water was also observed on the soil surface during the time when snow was present, albeit in limited quantities, serves to reinforce this conclusion. The second possible reason is the effect of biotur-bation, particularly by soil organisms such as earthworms. Although earthworm casts were periodically observed at some transects, they were not considered to be part of the soil surface proper and were hence removed before measurements were taken. The possibility that shallow burrowing earth-worms were responsible in some instances for positive read-ings cannot be completely discounted, however. Thirdly, is the effect of sediment deposition during overbank flood events.
Table 4 Results of the statistical tests for the relationship between slope position and erosion rates for pairs of contaminated and reference transects at all six sites
Site ID Transect type Average elevation difference (m) R2value Spearman rank (rs) Significance Direction of correlation N
Site 1 Contaminated Comparable 0.65 −0.988a 0.000 Significant relationship between erosion and slope 10 Reference 0.05 −0.073 0.842 No significant relationship 10 Site 2 Contaminated Comparable 0.05 −0.200 0.580 No significant relationship 10
Reference 0.04 −0.261 0.467 10
Site 3 Contaminated 0.437 0.88 −0.891a 0.001 Significant relationship between erosion and slope 10 Reference 0.78 0.891a 0.001 Significant relationship between accretion and slope 10 Site 4 Contaminated 0.079 0.15 −0.345 0.328 No significant relationship 10 Reference 0.86 0.927a 0.000 Significant relationship between accretion and slope 10 Site 5 Contaminated 1.055 0.65 −0.794a 0.006 Significant relationship between erosion and slope 10
Reference 0.00 −0.152 0.676 No significant relationship 10 Site 6 Contaminated 0.382 0.10 0.261 0.467 No significant relationship 10
Reference 0.01 0.406 0.244 10
a
This is possible at sites situated at low elevations, or very close to the main river channel, but is believed to be unlikely for the majority of sites, due, as stated earlier, to the very low SSC and limited opportunity for overbank material to accumulate to any substantial depth. The last hypothesis under consider-ation is soil creep (Couper et al.2002). This is plausible and may represent the most likely scenario, particularly at Site 4 where the reference transect recorded a net average (positive) increase of approximately 13 mm between the fourth and third re-measurements (Fig. 5d), as well as at Site 5 where the reference transect recorded a net average (positive) increase of approximately 4.3 mm between the seventh and sixth re-measurements (Fig.5f). In all other instances where positive measurements were recorded, any net gain between re-measurements was generally less than 1.7 mm, and this effect may be a function of one, or indeed a combination of all, of the above processes.
5 Prospects for future work
The essentially unique evidence generated by this investiga-tion confirms that I. glandulifera has a significant influence on the sediment dynamics of the river system investigated. Based on these results, a strategy for future work will include continuing to monitor along the existing study reach in order to gain a deeper insight into the potential eco-hydromorphic role of I. glandulifera over annual timescales. In addition, it is envisaged that the investigation will be extended into different river systems in order to obtain a more comprehensive under-standing of the role of I. glandulifera on sediment dynamics in catchments elsewhere. During site installation at different systems, more emphasis will be placed on selecting sites where pairs of transects can be installed at similar elevations in order to ensure that erosion processes are as comparable as possible.
6 Conclusions
Within the constraints and limitations of the experimental methodology employed, the findings reported in this commu-nication provide tentative yet compelling evidence that I. glandulifera has a significant influence on the sediment dynamics of the 1.0 km section of the river system investigat-ed. Whether this influence is negative remains out of the scope of this investigation, but from the evidence presented so far, I. glandulifera appears to promote significantly greater soil loss along the riparian zone when compared against topo-graphically similar areas supporting natural vegetation. These findings strongly suggest that its presence in river systems may have an impact on catchment sediment dynamics. Rea-sons for this are attributed, firstly, to certain life-cycle traits
that allow this plant to rapidly colonize and then crowd-out natural vegetation, and secondly, to its intolerance to cold weather and seasonal die-back, both factors of which conspire to significantly increase the risk of erosion in affected catch-ments. Given the steadily increasing distribution of I. glandulifera throughout European and other river systems elsewhere, its influence in promoting soil erosion in aquatic environments may lead to a steady reduction in water quality. Crucially, this scenario may be of particular concern to all affected EU member states, since it would make it increasing-ly difficult for those nations to meet and then maintain key water quality standards, as set by the WFD when fully imple-mented in 2015.
Acknowledgments This investigation was funded by the Physical Ge-ography and Environmental Change Research Group, Department of Environmental Sciences, University of Basel, Switzerland. We are grate-ful to the‘Bürgergemeinde’ (Community Mayor of Common Lands) from the town of Brislach, in Canton Basel-Landschaft, for granting ongoing access to the study site. Thanks are also extended to Dr. W. Fister for his help and advice, to S. Kuonen for producing Fig.2, to D. Hügli, S. Tresch, and R. Gisin, for their collective assistance in making the study possible, and to three anonymous reviewers for their extremely helpful comments and suggestions, all of which have served to strengthen the paper.
References
Beerling DJ, Perrins JM (1993) Impatiens glandulifera Royle (Impatiens roylei Walp.). J Ecol 81:367–382
Boardman J, Foster I, Rowntree K, Mighall T, Gates J (2010) Environmental stress and landscape recovery in a semi-arid area, The Karoo, South Africa. Scot Geogr J 126:64–75
Chapman DS, Gray A (2012) Complex interactions between the wind and ballistic seed dispersal in Impatiens glandulifera (Royle). J Ecol 100:874–883
Collins AL, Walling DE (2004) Documenting catchment suspended sediment sources: problems, approaches and prospects. Prog Phys Geog 28:159–196
Cornwall Council (CC) (2013) Himalayan Balsam. on-line factsheet, Cornwall County Council, UK. http://www.cornwall.gov.uk/ default.aspx?page=13835Accessed 13 July 2013
Couper P, Stott T, Maddock I (2002) Insights into river bank erosion processes derived from analysis of negative erosion-pin recordings: observations from three recent UK studies. Earth Surf Proc Land 27: 59–79
CPS-SKEW (2012) Black list and watch list. Swiss Commission for Wild Plant Conservation.http://www.cps-skew/english/black_list.htm. Accessed 06 August 2012
Dawson FH, Holland D (1999) The distribution in bankside habitats of three alien invasive plants in the U.K. in relation to the development of control strategies. Hydrobiologia 415:193–201
Environment Agency (EA) (2010) Managing invasive non-native plants. Environment Agency, UK, on-line publication for The Management of Non-Native Invasive Plants in or near Fresh Water.http://www. lbp.org.uk/downloads/Publications/SpeciesInfo/Managing% 20Invasive%20Non-Native%20Plants.pdfAccessed 13 July 2013
European Commission (EC) (2010) Water Framework Directive. European Commission Publication Factsheet.http://ec.europa.eu/ environment/pubs/pdf/factsheets/water-framework-directive.pdf. Accessed 15 August 2012
Fanning P (1994) Long-term contemporary erosion rates in an arid rangelands environment in western New South Wales, Australia. J Arid Environ 28:173–187
Farming and Wildlife Advisory Group (FWAG) (2013) Himalayan Balsam Project, River Otter, East Devon. Farming and Wildlife Advisory Group, Southwest, UK. http://www.fwagsw.org.uk/ projects/himalayan-balsam-project-river-otter-east-devon/
Accessed 13 July 2013
Federal Office for the Environment (FOEN) (2013) Invasive species in Switzerland—factsheets: Impatiens glandulifera : A Swiss Confederation Publication: 166-167. http://www.bafu.admin.ch/ publikationen/publikation/00028/index.html?lang=en. Accessed 13 May 2013
Fister W, Rüegg HR, Tesch S, Greenwood P (2013) Eine Präzisonsanlage experimentellen Untersuchung von Bodenerosionsprozessen. Böden im Wandel, Regio Basiliensis, Basler Zeitschrift für Geographie 54(1):19–26 (in German)
Geißler C, Kühn P, Böhne M, Bruelheide H, Shi X, Scholten T (2012) Splash erosion potential under tree canopies in subtropical SE China. Catena 91:85–93
Gilvear DJ, Spray CJ, Casas-Mulet R (2013) River rehabilitation for the delivery of multiple ecosystem services at the river network scale. J Environ Manag 126:30–43
Goodson JM, Gurnell AM, Angold PG, Morrissey IP (2002) Riparian seed banks along the lower River Dove, UK: their structure and ecological implications. Geomorphology 47:45–60
Greenwood P, Fister W, Kinnell PIA, Rüegg HR, Kuhn NJ (2013) Developing and testing a precision erosion measurement facility for elucidating mobilization mechanisms in shallow-flow condi-tions. 4th International United Nations Educational, Scientific and Cultural Organization (UNESCO) Conference on Desertification and Land Degradation. International Conference on Eremology (ICE) Publication. UNESCO Chair of Eremology, Gent University, Belgium, pp 105–111
Greig SM, Dear DA, Carling PA (2005) The impact of fine sediment accumulation on the survival of incubating salmon progeny: implications for sediment management. Sci Total Environ 344:241–258
Haigh MJ (1977) The use of erosion pins in the study of slope evolution. Br Geomorphol Res Group (BGRG) Tech Bull. 18:31–49 Heckrath G, Bechmann M, Ekholm P, Ulén B, Djodjic F (2008) Review
of indexing tools for identifying high risk areas of phosphorus loss in Nordic catchments. J Hydrol 349:68–87
Hejda M (2006) Species factsheet: Impatiens glandulifera. Delivering Alien Invasive Species Inventories for Europe (DAISIE) On-line publication. 6thFramework of the European Commission Project.
http://www.europe-aliens.org/pdf/Impatiens_glandulifera.pdf
Accessed 11 July 2013
Hejda M, Pyŝek P (2006) What is the impact of Impatiens glandulifera on species diversity of invaded riparian vegetation? Biol Conserv 132: 143–152
Helmisaari H (2010) NOBANIS—invasive alien species fact sheet: Impatiens glandulifera . Online database of the North European and Baltic Network on Invasive Alien Species.www.nobanis.org. Accessed 06 August 2012
Hulme PE, Bremner ET (2006) Assessing the impact of Impatiens glandulifera on riparian habitats: partitioning diversity components following species removal. J Appl Ecol 43:43–50
Invasive Species Ireland (ISI) (2013) Himalayan Balsam Impatiens glandulifera . Invasive species Ireland on-line factsheet.http:// invasivespeciesireland.com/most-unwanted-species/established/ terrestrial/himalayan-balsamAccessed 13 July 2013
Keay-Bright J, Boardman J (2009) Evidence from field-based studies of rates of soil erosion on degraded land in the central Karoo, South Africa. Geomorphology 103:455–465
Kollman J, Bañuelos MJ (2004) Latitudinal trends in growth and phe-nology of the invasive alien plant Impatiens glandulifera (Balsaminacea). Divers Distrib 10:377–385
Kronvang B, Andersen HE, Larsen SE, Audet J (2013) Importance of bank erosion for sediment input, storage and export at the catchment scale. J Soils Sediments 13:230–241
Lawler DM (1986) River bank erosion and the influence of frost: a statistical examination. Trans Inst Bri Geogr N Ser 11:227–242 Lawler DM, Grove JR, Couperthwaite JS, Leeks GJL (1999)
Downstream change in river bank erosion rates in the Swale-Ouse system, northern England. Hydrol Process 13:977–992
Le Bissonais Y, Cerdan O, Lecomte V, Benkhadra H, Souchère V, Martin P (2005) Variability of soil surface characteristics influencing runoff and interrill erosion. Catena 62:111–124
Loughran RJ (1989) The measurement of soil erosion. Prog Phys Geogr 13:216–233
Malíková L, Prach K (2010) Spread of alien Impatiens glandulifera along rivers invaded at different times. Ecohydrol Hydrobiol 10:81–85 Mallik AU, Richardson JS (2009) Riparian vegetation change in
up-stream and downup-stream reaches of three temperate rivers dammed for hydroelectric generation in British Columbia, Canada. Ecol Eng 35:810–819
Morgan RPC (1993) Soil erosion and conservation Chp 7. In: Davidson DA (ed). Strategies for erosion control. Longman Scientific & Technical, Essex, UK, pp 162–185
Nanko K, Mizugaki S, Onda Y (2008) Estimation of soil splash detach-ment rates on the forest floor of an unmanaged Japanese cypress plantation based on field measurements of throughfall drop sizes and velocities. Catena 72:348–361
Natur- und Umweltschutzkommission (NUS) (2012) Bekämpfung des Drüsigen Springkrauts (Impatiens glandulifera ). Control & M a n a g e m e n t I n f o r m a t i o n P u b l i c a t i o n . N a t u r - u n d Umweltschutzkommission (Brislach).http://www.brislach.ch/de/ politik/kommissionen/?amt_id=9824Accessed 13 July 2013 Natural Resources Conservation Service (NRCS) (2013) Plants profile:
Impatiens glandulifera Royle. Natural Resources Conservation Service on-line factsheet. United States Department of Agriculture (USDA).http://plants.usda.gov/java/profile?symbol=imglAccessed 11 July 2013
Neary DG, Smethurst PJ, Baillie BR, Petrone KC, Cotching WE, Baillie CC (2010) Does tree harvesting in streamside management zones adversely affect stream turbidity?—preliminary observations from an Australian case study. J Soils Sediments 10:652–670
Norfolk Wildlife Trust (NWT) (2013) Himalayan Balsam Impatiens glandulifera . Norfolk Wildlife Trust on-line Control & Management Factsheet. http://www.norfolkwildlifetrust.org.uk/ Wildlife-in-Norfolk/Species/Plants/Himalayan-balsam.aspx
Accessed 13 July 2013
Petticrew EL, Krein A, Walling DE (2007) Evaluating fine sediment mobilization and storage in a gravel-bed river using controlled reservoir releases. Hydrol Process 21:198–210
Pyšek P, Prach K (1995) Invasion dynamics of Impatiens glandulifera—a century of spreading reconstructed. Biol Conserv 74:41–48 Ries JB (2010) Methodologies for soil erosion and land degradation
assessment in Mediterranean-type ecosystems. Land Degrad Dev 21:171–187
Rivers and Fisheries Trusts of Scotland (RAFTS) (2013) Himalayan Balsam (Impatiens glandulifera). Invasive Species & Biosecurity Programme on-line Factsheet, Rivers and Fisheries Trusts Scotland Publication. http://www.invasivespeciesscotland.org.uk/himalayan-balsam-impatiens-glandulifera/Accessed 13 July 2013
Roblin E (1994) Alien invasive weeds—an example of National Rivers Authority sponsored research. In: de Waal LC, Child LE, Wade PM,
Brock JH (eds) Ecology and management of invasive riverside plants. John Wiley and Sons, Chichester, UK, pp 189–194 Royal Horticultural Society (RHS) (2013) Himalayan Balsam. Gardening
Advice Factsheet. Royal Horticultural Society On-Line Publication.
http://apps.rhs.org.uk/advicesearch/profile.aspx?pid=480#section3
Accessed 11 July 2013
Shakesby RA (1993) The soil erosion bridge: a device for micro-profiling soil surfaces. Earth Surf Proc Land 18:823–827
Skálová H, Moravcová L, Pyšek P (2011) Germination dynamics and seedling frost resistance of invasive and native Impatiens species reflect local climatic conditions. Perspect Plant Ecol 13:173–180
Smith MW (1975) Microclimatic influences on ground temperatures and permafrost distribution, Mackenzie Delta, Northwest Territories. Can J Earth Sci 12:1421–1438
Thorne CR (1981) Field measurements of rates of bank erosion and bank material strength. Proceedings of a Symposium on Erosion and Sediment Transport Measurement. IAHS Publ 133, IAHS Press, Wallingford, UK, pp 503–512
Wadsworth RA, Collingham YC, Willis SG, Huntley B, Hulme PE Walling D (ed), Tacconi P (ed) (2000) Simulating the spread and management of alien riparian weeds: are they out of control? In J Appl Ecol 37:28–38
Walling DE (2005) Tracing suspended sediment sources in catchments and river systems. Sci Total Environ 344:159–184
Walling DE, Collins AL (2008) The catchment sediment budget as a management tool. Environ Sci Pol 11:136–143
Walling DE, Owens PN, Carter J, Leeks GJL, Lewis S, Meharg AA, Wright J (2003) Storage of sediment-associated nutrients and con-taminants in river channel and floodplain systems. Appl Geochem 18:195–220
Weatherspark (2012) Historical Weather Data.http://weatherspark.com/
Accessed 06 Aug 2013
White RE (1997) Principles and practice of soil science: the soil as a natural resource, 3rd edn. Blackwell Science, Australia
Williams P, Smith M (1989) The Frozen Earth: Fundamentals of Geocryology (2nd ed.). Chp. 4. The Ground Thermal Regime, pp. 83-120. Cambridge University Press, UK
Wiltshire and Swindon Biological Records Centre (WSBRC) (2013) Himalayan Balsam Impatiens glandulifera. Wiltshire and Swindon Biological Records Centre On-Line Factsheet.http://www.wsbrc. org.uk/qoxRo0kfkECMi_9xeUCdxg%3D%3D/Species.aspx
Accessed 13 July 2013
Zhang T (2005) Influence of the seasonal snow cover on the ground thermal regime: an overview. Rev Geophys 43(4): DOI:10.1029/ 2004RG000157