HAL Id: hal-01236157
https://hal.univ-reunion.fr/hal-01236157
Submitted on 1 Dec 2015
HAL is a multi-disciplinary open access
archive for the deposit and dissemination of
sci-entific research documents, whether they are
pub-lished or not. The documents may come from
teaching and research institutions in France or
abroad, or from public or private research centers.
L’archive ouverte pluridisciplinaire HAL, est
destinée au dépôt et à la diffusion de documents
scientifiques de niveau recherche, publiés ou non,
émanant des établissements d’enseignement et de
recherche français ou étrangers, des laboratoires
publics ou privés.
South Pacific hotspot swells dynamically supported by
mantle flows
Claudia Adam, Masaki Yoshida, Takehi Isse, Daisuke Suetsugu, Yoshio Fukao,
Guilhem Barruol
To cite this version:
Claudia Adam, Masaki Yoshida, Takehi Isse, Daisuke Suetsugu, Yoshio Fukao, et al.. South
Pa-cific hotspot swells dynamically supported by mantle flows. Geophysical Research Letters, American
Geophysical Union, 2010, �10.1029/2010GL042534�. �hal-01236157�
for Full Article
South Pacific hotspot swells dynamically supported
by mantle flows
Claudia Adam,
1,2Masaki Yoshida,
1Takehi Isse,
3Daisuke Suetsugu,
1Yoshio Fukao,
1and Guilhem Barruol
4Received 17 January 2010; revised 12 March 2010; accepted 22 March 2010; published 24 April 2010.
[1] The dynamics of mantle plumes and the origin of their
associated swells remain some of the most controversial topics in geodynamics. Here we construct a numerical model of the mantle flow beneath the French Polynesia region. Our study is based on a new regional seismic tomography model, which high resolution allows obtaining information at the scale of plumes. We find excellent correlations between the observed and the modeled dynamic swells, between the modeled flow pattern and the active volcanism and between the buoyancy fluxes obtained from our numerical model and the ones deduced from the swells morphology. These outstanding fits reveal for the first time that a direct link exists between the surface observations and mantle flows.
Citation: Adam, C., M. Yoshida, T. Isse, D. Suetsugu, Y. Fukao, and G. Barruol (2010), South Pacific hotspot swells dynamically supported by mantle flows, Geophys. Res. Lett., 37, L08302, doi:10.1029/2010GL042534.
1.
Introduction
[2] According to the plume theory, originally proposed by
Morgan [1968], the hotspot volcanoes are created by jets of hot material (plumes) rising from the deep mantle. With later studies, troubling inconsistencies began to emerge and other phenomena are invoked to explain intraplate volca-nism [e.g., McNutt et al., 1997; Hirano et al., 2006], thus tending to nail the plume coffin [McNutt, 2006; Hofmann and Hart, 2007]. However, the problems encountered may simply be “the maturing of a valid theory to deal with the complexity of the real planet” [McNutt, 2006]. This alter-native is tested here by studying the dynamics of the South Pacific plumes through a new numerical model of mantle flow based on a highly‐resolved seismic tomography model. [3] Our study focuses on French Polynesia, a region
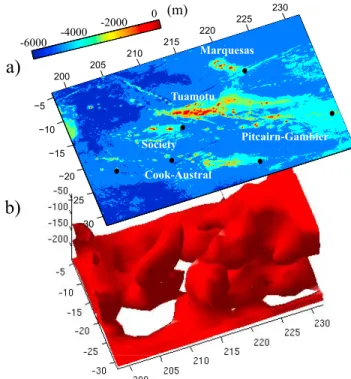
characterized by the highest concentration of hotspot vol-canism. The rate of volcanism is indeed 3–4 times greater than in the other oceans and 14% of the active hotspots of the earth are concentrated in an area covering less than 5% of the globe. We find a wide range of volcanic features like en‐echelon ridges, isolated seamounts and five chains of mid‐plate volcanoes: the Society, the Marquesas, the Tua-motu, Pitcairn‐Gambier and the Cook‐Austral (Figure 1a).
The mechanisms responsible for loading of these chains, and the origin of the associated swells are still under debate [McNutt et al., 1997; Jordahl et al., 2004; Monnereau and Cazenave, 1990; McNutt, 1988; Crough, 1978]. In order to bring new insights on these topics, we calculate the instantaneous mantle flow by using a new, highly resolved seismic tomography model.
2.
Model
[4] The shear wave tomography model is obtained through
the inversion of Rayleigh waves (see auxiliary material) [see Isse et al., 2006; Suetsugu et al., 2009], registered at two new networks of broad band seismic stations, deployed on the seafloor [Suetsugu et al., 2005] and on the islands [Barruol et al., 2002].1For shallow depths (0–240km), slow anoma-lies are found in the vicinity of the South Pacific hot spots, which could represent narrow plumes in the upper mantle [Isse et al., 2006]. The Society, Macdonald and Pitcairn hot spots appear however, to be rooted at depths greater than 240 km [Suetsugu et al., 2009].
[5] We convert the seismic velocity anomalies (dv) into
density anomalies (dr) with a conversion factor Rr/vs(=dr/dvs) of 0.17 (Figure 1b and auxiliary material). We then compute the instantaneous mantle flow driven by the density anomalies by solving the conservation equations of mass and momentum in a regional three‐dimensional spherical shell geometry. The computation domain extends between latitudes 0 and 32°S, longitudes 174 and 232°E, and depths 0–240 km. Following the work of Yoshida [2008], we used the finite volume method for the discretization of the basic equations (see auxiliary material). We impose a viscosity profile which describes a highly viscous lithosphere (1023Pas between depths 0 and 30 km) overlying a low viscosity asthenosphere (1020 Pas between depths 30 and 240 km). The impermeable and shear stress‐free conditions are adopted on the top (0 km depth) and bottom (240 km depth) surface boundaries. The flows across lateral boundaries are taken to be symmetric. Once we obtain the velocity and pressure fields, representative of the convection driven by the density anomalies within the whole model domain, we estimate the dynamic topography at the top surface bound-ary (see auxilibound-ary material).
3.
Hotspot Swells and Dynamic Topography
[6] The dynamic topography is presented in Figure 2c.
We notice a good overall correlation between the observed (Figures 2a and 2b) and the modelled swells, in spite the fact 1
Institute for Research on Earth Evolution, Japan Agency for Marine‐Earth Science and Technology, Yokosuka, Japan.
2
Centro de Geofisica de E´vora, Universidade de Évora, Évora, Portugal.
3
Earthquake Research Institute, Bunkyoku, Tokyo, Japan.
4Universite´ de Montpellier II, Montpellier, France.
Copyright 2010 by the American Geophysical Union. 0094‐8276/10/2010GL042534
1Auxiliary materials are available in the HTML. doi:10.1029/
2010GL042534.
that they have been obtained from totally independent data (bathymetry and seismic tomograms respectively). The hotspot chains are generally associated with bathymetric highs. Their emplacement, wavelength and amplitude are a priori well recovered by the model, indicating that our modelling reproduces the actual mantle flow. In particular, our model recovers the characteristics of the Society swell, the most classical hotspot chain in our study area. The swell over Pitcairn‐Gambier and the circular swell associated with Rarotonga, an isolated active volcano, are also well retrieved by our dynamic model. The good correlation we find between the observed and modelled swell over the Macdonald chain is even more relevant. Indeed, previous
studies demonstrate that most of the volcanism there is produced by non‐hotspot processes [McNutt et al., 1997; Jordahl et al., 2004]. Our result demonstrates that, whatever the mechanism responsible for the volcanism emplacement, the buoyant ascent of the mantle plays a major role in the swell morphology.
[7] The dynamic model does not recover the Marquesas
and the westernmost part of the Tuamotu swells but it has been shown that these have shallow origins, respectively crustal underplating [McNutt and Bonneville, 2000] and a large plateau capped with sediments, limestone and basalt
Figure 1. French Polynesia region. (a) Bathymetry and names of the hotspot chains. The black disks represent the young volcanoes. (b) View of the mantle density anomalies deduced from our tomographic model. The red iso‐surface represents the−30 kgm−3density anomaly.
Figure 2. French Polynesia swells. (a) The color map represents the observed swells, determined by the same method that Adam et al. [2005] used. The red dots repre-sent the location of active volcanism. The seismic station emplacement is shown by the magenta stars (permanent stations), the green squares (PLUME stations) [Barruol et al., 2002] and the black triangles (BBOBS) [Suetsugu et al., 2005]. The AB and CD profiles are used to make depth cross sections (see Figure 3 and discussion in the text). (b) Observed swells with age correction and 2° × 2° sampling. (c) Dynamic topography obtained through a computation using Rr/vs= 0.17 and a viscosity profile which describes a highly viscous lithosphere (1023 Pas between depths 0 and 30 km) overlying a low‐viscosity asthenosphere (1020
Pas between depths 30 and 240 km). The black lines represent the isocontours of the original swells displayed in Figure 2a.
ADAM ET AL.: DYNAMICS OF THE SOUTH PACIFIC PLUMES L08302 L08302
layers [Ito et al., 1995]. However our modelling points out a distinct area of localized upwelling, east of the Tuamotu plateau. Given that no volcanic ages are available, this is the first evidence that the present‐day mantle dynamics strongly contributes to the observed depth anomaly.
[8] The model also recovers the observed bathymetric
lows such as the one associated with the active Arago vol-cano, there again with the correct emplacement, wavelength and amplitude. For hotspot chains, the active volcanism is usually explained by the buoyant uplift of a plume, which consequently creates a bathymetric high. Therefore, the fact that the active volcanism observed at Arago is associated with a bathymetric low is very surprising. Further infor-mation on the volcanism emplacement are required. They can be obtained by considering the velocity field induced by the density anomalies.
4.
Convection Pattern
[9] Our main result concerning the convection pattern is
that the volcanism emplacement is not due to a simple vertical ascent of a plume but rather to a complex interaction
between upwelling and downwelling flows. The Society is the only case, in our study area, which corresponds to the definition originally proposed [Morgan, 1968; Sleep, 1990]. On the depth cross section along the AB profile (Figure 3a), we can see indeed that the buoyant source (negative den-sity anomaly) located under this chain creates a vertical upwelling reaching the lithosphere directly beneath the active volcanism. For all the other chains, the convection pattern is more complex. However, we find that the emplacement of each active volcano can be explained by our modelled flows.
[10] The Cook‐Austral chain has often been taken as an
example to argue against the plume theory [McNutt et al., 1997; Jordahl et al., 2004]. Many volcanic stages overlap on this chain [Bonneville et al., 2006] and the latest volcanic emplacement is apparently controlled by the stresses left in the lithosphere by previous loadings [McNutt et al., 1997]. On the depth cross section along the CD profile (Figure 3b), a large low density body, deeper than 50 km, creates an upwelling reaching the lithosphere immediately beneath the observed swell maximum, but far from the active volcanism occurring at Macdonald. At the base of the lithosphere the Figure 3. Flow pattern. Depth cross section along the (a) AB and (b) CD profiles displayed in Figure 2a. The color map represents the density anomalies and the arrows the convection driven by them. The schematic volcanoes represent the active volcanism emplacement.
flow becomes horizontal and streams towards the Macdo-nald. The volcanism emplacement can then be explained by these lateral flows and may be facilitated by the structural discontinuities of the lithosphere, as previously suggested [McNutt et al., 1997; Jordahl et al., 2004]. This study constitutes however the first evidence that the buoyant ascent of the plume plays a major role in the volcanism loading.
[11] Along the CD profile, we can also see that the mantle
beneath the Arago active volcano is characterized by densities slightly higher than the surrounding mantle. This explains the observed and modelled bathymetric lows but does not account for the observed active volcanism since the positive density anomalies create downwgoing flows. However, this downwelling current produces lateral tensile stresses near the base of the lithosphere, which may be responsible for crack‐associated magma ascent through the lithosphere.
[12] It is worth noticing that, according to the classical
definition, plumes should be deep‐rooted buoyant mantle upwellings. Here we demonstrate that the convection occurring in the shallowest part of the mantle (0–240 km depths) is sufficient to explain the active volcanism and the observed swells, while the roots of some hotspots are probably located at greater depths, as indicated by a recent tomography model [Suetsugu et al., 2009]. The buoyancy created by these deeper sources is apparently not required
to explain the surface observations. This result may help in providing a new, more realistic definition of the plume concept.
5.
Buoyancy Fluxes
[13] Quantitatively, the measure of the plume strength is
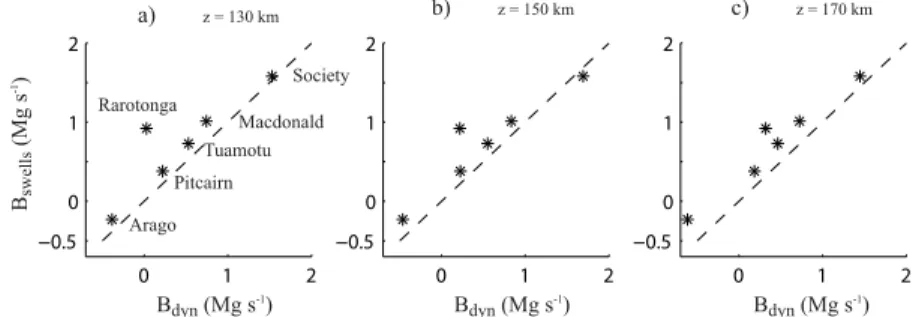
given by the buoyancy flux, which measures the flux of material from the mantle. The buoyancy flux can be com-puted through two independent ways, one based on swell morphology (Bswells), and the other on the mantle flow (Bdyn) (see auxiliary material) [Sleep, 1990; Davies, 1988]. In this study, Bdynis computed for the first time from a tomography model. The obtained values are displayed in Table 1 and represented in Figure 4. We can see that the results obtained through the two approaches are very consistent. Indeed, both of our B estimations give the same rank ordering of the hotspot strength. From the strongest to the weakest we find the Society, Macdonald, Rarotonga, Tuamotu, Pitcairn and Arago. The Society and Macdonald ones are only the “strong” plumes with B >1Mgs−1 [Courtillot et al., 2003]. The fact that the values found through the two independent approaches are consistent for all the French Polynesia hot-spots is outstanding. This implies not only that our dynamic model is supported by independent bathymetry data, but also that we can accurately evaluate the material and heat transported by mantle plumes from a careful estimation of the swell morphology. This would help constrain the role that plumes play into the total heat flow on Earth. Using the Bswellslisted in Table 1, we found that the total buoyancy flux, Btotal, of the five hotspots (except Marquesas and Arago) is 4.7 Mgs−1. Taking the thermal expansion coefficienta = 2.0 × 10⁻⁵K−1and the specific heat cp= 1250 Jkg−1K−1, the total heat flow is estimated as Q = Btotal cp/a = 0.29 TW [Davies, 1999], which accounts for 9% of the total plume heat flow, 3.4 TW [Sleep, 1990], and for around 1% of the total heat flow out of the Earth’s mantle, 36 TW [Davies, 1999].
6.
Conclusion
[14] Using a new, regional, highly resolved seismic
tomography model, we model the dynamics of the South Pacific plumes and the resulting dynamic topography. We find excellent correlations between the observed and the modeled dynamic swells and between the modeled flow
Figure 4. Buoyancy fluxes. The values of the buoyancy fluxes obtained from the observed swells (Bswell) are represented as a function of the buoyancy fluxes obtained through the dynamic computation (Bdyn) for various depths (130 km, 150 km, and 170 km). We represent the values obtained through a computation using Rr/vs = 0.17 and a viscosity profile which describes a highly viscous lithosphere (1023 Pas between depths 0 and 30 km) overlying a low‐viscosity asthenosphere (1020 Pas between depths 30 and 240 km). The dashed lines represent the Bdyn = Bswells curve.
Table 1. Buoyancy Fluxes Obtained From the Swells (Bswells) and
From the Dynamic Model (Bdyn)a
Hotspot Bswells(Mgs−1) Bdyn(Mgs−1)
Society 1.58 ± 0.15* 1.53 Marquesas 1.42* ‐ Tuamotu 0.72 ± 0.18 0.53 Rarotonga 0.92 ± 0.09* 0.04 Macdonald 1.10 ± 0.16 0.74 Pitcairn 0.38 ± 0.22 0.22 Arago −0.38 ± 0.09 −0.23 aThe values of B
dynwith an asterisk have been published by Adam et al.
[2005]. The others have been obtained in the present study. The values reported for Bdynare obtained through a modelisation considering a highly
viscous lithosphere (1023Pas between depths 0 and 30 km) overlying a
low‐viscosity asthenosphere (1020Pas between depths 30 and 240 km), and a density to velocity heterogeneity ratio Rr/vs= 0.17. The values of Bdynare taken at 150 km depth.
ADAM ET AL.: DYNAMICS OF THE SOUTH PACIFIC PLUMES L08302 L08302
pattern and the active volcanism. This demonstrates, for the first time, that a direct link exists between the surface observations and mantle flows. The excellent correlation we find between the buoyancy fluxes obtained from our numerical model and the ones deduced from the swells’ morphology has even broader implications. It implies indeed, that we can accurately evaluate the heat transported by mantle plumes from a careful estimation of the swell morphology. We show that the heat transported by the South Pacific plumes accounts for 9% of the total plume heat flux.
[15] Acknowledgments. This work has been supported by a Grant‐ in‐Aid for Scientific Research (16253002, 19253004) from the Japan Society for the Promotion of Science. The manuscript has been improved by the comments of an anonymous reviewer. The computations presented here have been performed with the supercomputer facilities (SGI Altix 4700) at JAMSTEC.
References
Adam, C., V. Vidal, and A. Bonneville (2005), MiFil: A method to char-acterize seafloor swells with application to the south central Pacific, Geo-chem. Geophys. Geosyst., 6, Q01003, doi:10.1029/2004GC000814. Barruol, G., et al. (2002), PLUME investigates South Pacific Superswell,
Eos, Trans. AGU, 83(45), 511–514.
Bonneville, A., L. Dosso, and A. Hildenbrand (2006), Temporal Evolution and Geochemical Variability of the South‐Pacific Superplume Activity, Earth Planet. Sci. Lett., 244, 251–269, doi:10.1016/j.epsl.2005.12.037. Courtillot, V., A. Davaille, B. Besse, and J. Stock (2003), Three distinct
types of hotspots in the Earth’s mantle, Earth Planet. Sci. Lett., 205, 295–308.
Crough, S. (1978), Thermal origin of midplate hotspot swells, Geophys. J. R. Astron. Soc., 55, 451–469.
Davies, G. (1988), Ocean bathymetry and mantle convection. 1. Large‐ scale flow and hotspots, J. Geophys. Res., 93(B9), 10,467–10,480. Davies, G. (1999), Dynamic Earth: Plates, Plumes and Mantle Convection,
Cambridge Univ. Press, Cambridge, U.K.
Hofmann, A. W., and S. R. Hart (2007), Another nail in which coffin?, Science, 315, 39–40.
Hirano, N., et al. (2006), Volcanism in Response to Plate Flexure, Science, 313, 1426–1428.
Isse, T., D. Suetsugu, H. Shiobara, H. Sugioka, T. Kanazawa, and Y. Fukao (2006), Shear wave speed structure beneath the South Pacific superswell
using broadband data from ocean floor and islands, Geophys. Res. Lett., 33, L16303, doi:10.1029/2006GL026872.
Ito, G., M. McNutt, and R. Gibson (1995), Crustal structure of the Tuamotu Plateau, 15°S and implications for its origin, J. Geophys. Res., 100, 8097–8114.
Jordahl, K., M. McNutt, and D. Caress (2004), Multiple episodes of volcanism in the Southern Austral Islands: Flexural constraints from bathymetry, seismic reflection, and gravity data, J. Geophys. Res., 109, B06103, doi:10.1029/2003JB002885.
McNutt, M. (1988), Thermal and mechanical properties of the Cape Verde Rise, J. Geophys. Res., 93, 2784–2794.
McNutt, M., D. Caress, J. Reynolds, K. Jordahl, and R. Duncan (1997), Failure of plume theory to explain midplate volcanism in the Southern Austral Islands, Nature, 389, 479–482.
McNutt, M., and A. Bonneville (2000), A shallow, chemical origin for the Marquesas swell, Geochem. Geophys. Geosyst., 1, 1014, doi:10.1029/ 1999GC000028.
McNutt, M. (2006), Another nail in the plume coffin?, Science, 313, 1394–1395.
Monnereau, M., and A. Cazenave (1990), Depth and geoid anomalies over oceanic hotspot swells: A global survey, J. Geophys. Res., 95, 15,429– 15,438.
Morgan, W. J. (1968), Rises, trenches, great faults, and crustal blocks, J. Geophys. Res., 73(6), 1959–1982.
Sleep, N. (1990), Hotspots and mantle plumes: Some phenomenology, J. Geophys. Res., 95(B5), 6715–6736.
Suetsugu, D., et al. (2005), Probing South Pacific mantle plumes with broadband OBS, Eos, Trans. AGU, 86(44), 429–435.
Suetsugu, D., T. Isse, S. Tanaka, M. Obayashi, H. Shiobara, H. Sugioka, T. Kanazawa, Y. Fukao, G. Barruol, D. Reymond, (2009), South Pacific mantle plumes imaged by seismic observation on islands and seafloor, Geochem. Geophys. Geosyst., 10, Q11014, doi:10.1029/2009GC002533. Yoshida, M., (2008), Core‐mantle boundary topography estimated from numerical simulations of instantaneous mantle flow, Geochem. Geophys. Geosyst., 9, Q07002, doi:10.1029/2008GC002008.
C. Adam, Y. Fukao, D. Suetsugu, and M. Yoshida, Institute for Research on Earth Evolution, Japan Agency for Marine‐Earth Science and Technology, 2‐15 Natsushima‐cho, Yokosuka, 237‐0061, Japan. (adam@ uevora.pt)
G. Barruol, Université de Montpellier II, 34095 Montpellier Cedex 5, France.
T. Isse, Earthquake Research Institute, 1‐1‐1 Yayoi, Bunkyoku, Tokyo, 113‐0032, Japan.