HAL Id: hal-02981912
https://hal.archives-ouvertes.fr/hal-02981912
Submitted on 28 Oct 2020
HAL is a multi-disciplinary open access
archive for the deposit and dissemination of
sci-entific research documents, whether they are
pub-lished or not. The documents may come from
teaching and research institutions in France or
abroad, or from public or private research centers.
L’archive ouverte pluridisciplinaire HAL, est
destinée au dépôt et à la diffusion de documents
scientifiques de niveau recherche, publiés ou non,
émanant des établissements d’enseignement et de
recherche français ou étrangers, des laboratoires
publics ou privés.
Scaling electro-thermal model of a lithium-ion battery
for time-accelerated experiments in a HIL system
Fabien Lacressonnière, Andy Varais, Xavier Roboam
To cite this version:
Fabien Lacressonnière, Andy Varais, Xavier Roboam. Scaling electro-thermal model of a lithium-ion
battery for time-accelerated experiments in a HIL system. Symposium de Génie Electrique, Université
de Lorraine [UL], Jul 2018, Nancy, France. �hal-02981912�
SYMPOSIUM DE GENIE ELECTRIQUE(SGE 2018), 3-5 JUILLET 2018, NANCY, FRANCE
Scaling electro-thermal model of a lithium-ion battery
for time-accelerated experiments in a HIL system
Fabien LACRESSONNIERE
1,2, Andy VARAIS
1,2, Xavier ROBOAM
1,2,
1 Université de Toulouse; INPT, UPS; LAPLACE (Laboratoire Plasma et Conversion d’Energie); ENSEEIHT, 2 rue Charles
Camichel, BP 7122, F-31071 Toulouse cedex 7, France.
2 CNRS; LAPLACE; F-31071 Toulouse, France
ABSTRACT– This paper describes a scaled-size electro-thermal model of a Lithium-ion (Li-ion) battery. This model is used in order to develop a physical emulation of the scaled battery in a Hardware In the Loop (HIL) process. Physical emulation allows scaling the actual process but also accelerating HIL experiments through an innovative concept: the “compacted virtual time”. According to the management strategies implemented in the HIL process and to environmental conditions (temperature) of the battery, the electrical performance (energy/power) of the actual device and its physical emulator will be different. The electrical model is coupled with a 1D thermal model of a cell. The model parameters are determined from experimental data and by using a nonlinear least-squares solver. A robustness analysis, with voltage, current and time scaling is presented in order to determinate the accuracy of the scale model.
Keywords—Li-ion battery, electro-thermal modeling, similarity, scaling, time acceleration.
1. INTRODUCTION
The use of a Battery Energy Storage System (BESS) is becoming a technical solution in the actual and future electrical applications in order to improve the fuel efficiency and
reductions in CO2 emissions.
In embedded systems, the BESS are widely integrated. Indeed, in electric vehicle applications, for several years, the market growth rate increases: the global electrical vehicle stock surpassed 2 million units in 2016 and the battery fed electrical vehicles still account for the majority of the electric car stock [1]. In the More-Electrical Aircraft (MEA) context, the BESS can be used in an aircraft hybrid propulsion system to improve the overall propulsion system efficiency and to reduce the fuel consumption [2]. For the emergency electrical architecture in the aircraft, the hybridization of the Ram Air Turbine (RAT) with a BESS, associated with an optimized energy management strategy (power sharing), would reduce the mass of the overall system [3].
The BESS presents also other advantages for stationary systems and more particularly in large power grids and microgrids. Energy storage devices can harvest energy excess during periods of low demand and inject the stored energy in the grid during power peak periods [4-6]. The BESS can also be used to manage intermittent renewable energy devices (wind and solar power smoothing) in microgrids and isolated systems [7,8]. This storage device can also provide a frequency regulation in power grids [9].
Preparing the actual implementation of the BESS in electrical systems as mentioned above, offline simulations then HIL process (also known as semi-physical real-time simulation) can be applied in order to study, optimize and verify the effectiveness of the energy management strategies which will be implemented in the real system. In complex systems, there are several loads and storage devices and the HIL real time simulation presents more advantages than off-line simulations: it is a low cost technique rather than testing on real (scale 1) system, the simulation can perform multiple tests for the same test bench. Moreover, it provides methods to accomplish non-destructive testing under extreme and fault conditions and also has strong experimental reproducibility [10].
The HIL tests have been extensively used in the automotive industry for component development [11,12]. For instance, to avoid electric and thermal abuse on the BESS used in the electrical vehicle (or in another application), a Battery Management System (BMS) has to be associated with the storage device. In an advanced BMS, in order to maximize battery capacity and to limit the aging effects, there are several functions implemented like as active or passive balancing, thermal management, charging process and diagnosis analysis (State Of Charge – SOC and State Of Health – SOH). To develop a sophisticated BMS, manufacturers may require extensive testing (software and hardware). To test the diagnostic functions of the BMS, some faults (for instance over-charge and over-discharge) has to be provoked. In comparison with tests conducted on real battery, the HIL tests appear more cost and time effective and it is easier to reproduce the same electrical and environment (i.e. thermal) conditions for BMS tests [13-16]. The HIL simulations are also built to test power electronics devices [17] for MEA power supply system and to test the automatic flight control system of the aircraft [18]. Likewise, for microgrids applications, the HIL platforms become essential for testing and validating controls and energy management strategies [19]. In [20], some alternative HIL setups are proposed for real-time simulation and testing of microgrids. For the development and testing microgrid control and protection functions, a microgrid model (including diesel generators, BESS, PV plant and wind turbine) in a HIL environment has been developed [21].
The real time emulation is one method to provide the realistic environments [19]. The emulation involves mimicking the behavior of the subsystems to be represented such as sources (PV system, wind turbine), storage (BESS, etc) and
loads (consuming profiles). Hence, to emulate a complete power system (microgrid, electrical vehicle) a number of emulators, each replacing a physical subsystem, are connected together with some physical components. Sometimes, a real subsystem, instead of an emulator, is coupled in the HIL simulator test bench. For instance, to evaluate the performance of the battery in a virtual vehicle for different ambient temperatures, a real hardware battery is used in a HIL simulator [22]. In this case, the method is called Battery In the Loop (BIL) or Battery HIL. This method can be used if the electrical characteristics of the battery are adapted to those of the HIL test bench. Otherwise, a battery emulator (or virtual battery), with scaling factors, has to be developed [23,24]. To exchange bidirectional power flow between virtual battery and the real electric test bench, the battery emulator is composed of bidirectional power supply operating in voltage source. The control signal of the voltage source can be created by the voltage response of a battery model [14] or the voltage measured from a real battery [25].
The paper deals with a scalable electro-thermal model of a Li-ion battery. This latter can be used for replacing at real time a physical battery to simulate its thermal environment and especially to accelerate HIL simulations. Indeed, thanks to the similitude process and based on the original idea proposed in [26,27], a “time acceleration” by considering a “virtual compressed time” is possible together with the reduction of physical scales (power, voltage, current, etc). The paper is organized as follows. In section 2, the electro-thermal battery model is presented and the scaling factors (voltage, current, time) are applied to the parameters of the model. In section 3, the parameterization of the model is detailed, based on experimental data from 18650 format 1.6Ah Li-ion cells with lithium iron phosphate (LFP) cathode. The experimental test bench is also described in this section. In section 4, a robustness analysis of the scaling electro-thermal model is conducted by using a typical current profile extracted from microgrid application. First, without time accelerating, a comparison of the measured and simulated battery voltage is presented. Then, in addition of both voltage and current scaling factors, the time scaling factor is applied to the model in order to reduce the total time of experimental test. Finally, section 5 gives the conclusion.
2. SCALING ELECTRO-THERMAL MODEL OF LI-ION BATTERY
The complexity of the battery model can affects the simulation time, especially for large and complex electrical systems. Hence, there is a tradeoff between accuracy and simulation time. Thus, for complex HIL simulation, simple models are used.The most common approach for battery modeling methods is electrical models bases on Equivalent Circuit Model (ECM) [14]. They are preferred to the mathematical or physic-chemical models.
The electro-thermal model presented here is used in order to develop a battery emulator in a HIL system especially for testing microgrid management strategies. The model has to provide various information about the macroscopic quantities
as SOC, the battery voltage (Vbat) and the surface temperature
of the battery (TS). Fig. 1 presents the concept of the battery
emulator connected to the power HIL.
Fig. 1. Battery emulator : power supply interfaced to a real time simulator. 2.1. Electrical model
The electrical model presented in this study is based on an extended modified shepherd model [28] in which several modifications have been made [29]. This model is commonly used in the modeling of multi-physical energy systems incorporating a battery and in particular for studies of energy management in hybrid systems [30-32]. Indeed, by its simplicity and its accuracy, this model is easy to implement in a multi-physics and multi-scale system. Nevertheless, this model cannot completely describe all phenomena in the battery like the dynamic behavior such as the diffusion phenomena, which, in an ECM, can be taken into account with several RC parallel networks [33] (for instance, Cauer or Foster structures). Furthermore, this model is based on specific assumptions noted below:
the Open Circuit Voltage (OCV) hysteresis phenomenon [34] is not taken into account,
the OCV is not parameterized as a function of the temperature (entropy changes are neglected [35]),
the aging phenomena are not taken into account,
the internal resistances are supposed constant during the charge and discharge cycles and are not varied with the amplitude of the current,
the capacity of the battery is constant (No Peukert effect), the self-discharge of the battery is neglected.
In spite of these assumptions, the internal resistances will be dependent on the temperature.
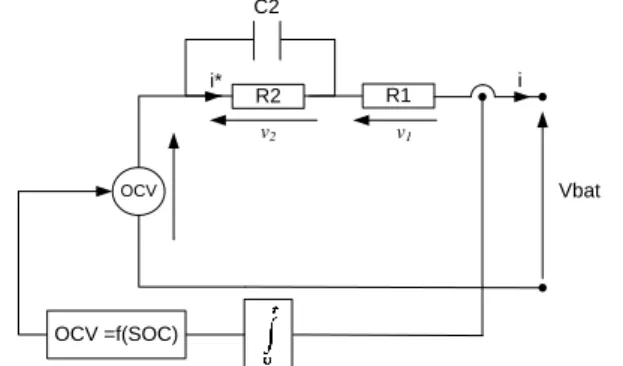
The battery model is summarized as follows:
(1)
(2) (3) where the variables are the battery current i (A), the filtered
battery current i*(A), the battery capacity Q (Ah), the battery
constant voltage E0 (V), the exponential zone amplitude A (V),
the exponential zone inverse capacity B (Ah-1), the polarization
constant K (V/Ah), the internal resistance R1 (Ω), the polarization resistance R2 (Ω), the current filter time constant
Tf = R2.C2 (s), the discharge logic variable isdch and the charge
logic variable isch. The logic variable isdch is equal to 1 in
discharging mode while in charging mode, it is equal to 0. The
logic variable isch is equal to 1 in charging mode while in
discharging mode, it is equal to 0.
From the equation (1), the OCV relationship can be obtained: (4) ELECTRICAL MODEL THERMAL MODEL INTERFACE Bidirectional power supply
Energy Management strategy SOC Heat TS generation TS SOCint Vbat Power HIL Ibat Vbat Vbat Ibat
Real Time simulator
Simulator input Simulator ouput
Power supply input Power supply output
Tamb
Tamb : ambient temperature SOCint : initial SOC
𝑉𝑏𝑎𝑡 = 𝐸0+ 𝐴𝑒−𝐵𝑄 1−𝑆𝑜𝐶 − 𝐾𝑄 1 𝑆𝑜𝐶− 1 −𝑅1𝑖 − 𝑅2𝑖∗ 𝑖𝑠𝑑𝑐ℎ 𝑆𝑜𝐶 + 𝑖𝑠𝑐ℎ 1.1 − 𝑆𝑜𝐶 𝑂𝐶𝑉 𝑆𝑜𝐶 = 𝐸0+ 𝐴𝑒−𝐵𝑄 1−𝑆𝑜𝐶 − 𝐾𝑄 𝑆𝑜𝐶1 − 1 𝑖 = 𝑖∗+ 𝑅2𝐶2𝑑 𝑑𝑡𝑖∗ 𝑑 𝑑𝑡𝑆𝑂𝐶 = − 1 𝑄𝑖
Likewise, from equation (1), the total battery voltage drop is:
(5) It is possible to translate these equations by an ECM as shown in Fig. 2.
Fig. 2. Equivalent circuit for electrical modeling.
The R2C2 parallel network, in the Fig.2, allows taking into account the dynamic behavior on the battery voltage response. However, it is not possible to dissociate the activation dynamics (charge transfer process) and the diffusion phenomena.
In the equation (2), the SOC reflects the residual capacity and it is calculated by using the common Coulomb counting method. Hence, the SOC can be expressed as the following equation (with a coulombic efficiency equal to 1. Indeed, for LFP battery, this value is near to 1 [36]):
(6)
where SOCinit is the initial capacity of the battery. For a correct
use of the battery, the minimum value of the SOC (SOCmin)
cannot reach zero. In our study, the values of the SOCmin and
SOCmax (maximum SOC) are limited in order to limit the aging
effect. Generally, the energy management strategy of the microgrid limits the battery depth of discharge (DOD) at 80%
with a SOCmax close to 90% [37].
The OCV curve, obtained by equation (4), is shown in Fig. 3. For the maximum SOCs, there is an exponential potential drop on the OCV.
Fig. 3. OCV discharge characteristic of the battery model.
In our case study (battery emulator for HIL microgrid
application), the SOCmax has been fixed at 90%. Therefore, in
order to limit the parameters of the model, it is possible to remove the exponential expression in the equation (4) thus to simplify both model and parameter identification. For the rest of the study, the OCV relationship is:
(7)
The overall parameters of the electrical model are summarized in the Table 1.
Table 1. Parameters of the electrical model.
Electrical parametres
OCV relationship voltage drop relationship
E0, K, Q R1, R2, Tf
Electrical parameters are determined from experimental data by using a nonlinear least-squares solver (Matlab’s optimization toolbox). On the one hand, E0, K and Q are obtained by the measurement of the OCV characteristic, and on
the other hand, R1, R2 and Tf are determined from the voltage
measurement of the battery when this latter is excited with a current profile of the Hybrid Pulse Power Characteristic (HPPC) test. The HPPC profile was designed in order to measure the dynamic power capability over a device’s usable charge and voltage range [38,39].
2.2. Thermal model
The goal of the thermal model is to get an estimate of the surface temperature of the battery from a simple measurement of the surface temperature. The battery used for this study is composed of several 18650 format 1.6Ah Li-ion cells. As shown in Fig. 4, these cells are assembled in several modules (connected in series and parallel) in order to obtain the characteristics of the battery (voltage and capacity). The surface temperature of the battery is measured by using a thermocouple attached on the cell (placed at half height). Hence, the thermal model of the battery is based on the thermal cylindrical cell.
Fig.4. Module of 8 Li-ion LFP cells developped by TYVA ENERGY.
By constructing this thermal model, a series of assumptions were made:
the temperature inside the cylindrical cell is uniform [40], there is no cell-to-cell temperature variance in each battery
modules,
the predominant head mode transport in the cell is the conduction (the convection and radiation modes are neglected),
the heat source in the cell is governed by the irreversible heat source (the reversible entropic heat source which depends on the entropy change in the electrode is neglected),
each module have the same inlet air temperature,
parameters of the thermal model are independent of the temperature.
The thermal model of the cell [41] (as shown in Fig.5) is
composed by a heat source p (W), a specific heat capacity Cp
(J/K), an internal heat transfer resistance Rthc (K/W) and an
external heat transfer resistance Rthv (K/W).
OCV OCV =f(SOC) i Vbat R1 C2 R2 i* v2 v1 𝑣1+ 𝑣2= 𝑅1𝑖 + 𝑅2𝑖∗ 𝑖𝑠𝑆𝑜𝐶𝑑𝑐ℎ+1.1 − 𝑆𝑜𝐶𝑖𝑠𝑐ℎ 𝑆𝑂𝐶 = 𝑆𝑂𝐶𝑖𝑛𝑡+ 𝑖 𝑡 𝑑𝑡𝑄 𝑂𝐶𝑉 = 𝐸0− 𝐾𝑄 𝑆𝑜𝐶1 − 1
Fig. 5. Simpified thermal model of the cylindrical cell.
The heat source and Rthv can be expressed as:
(8) (9)
where hv (W/m²/K) is the thermal convection coefficient and
Surf (m²) is the cell surface area (surfaces of negative and
positive terminal of the cell are neglected). The surface temperature can be calculated by:
(10) where Tamb (K) is the ambient temperature of the cell (being also the ambient temperature of the battery).
The overall parameters of the thermal model are Cp, Rthc and
hv. The parameters are obtained from experimental surface
temperature measurement and by using a nonlinear least-squares solver.
2.3. Scaling of the electro-thermal model
In order to develop the physical emulator of a scaled battery and to reduce the testing time in the HIL test bench, a previous study [26] was conducted. The scaling model is based on a dimensional analysis (well established method in fluid and thermal systems) and on the Vaschy-Buckingham’s Pi theorem. The readers are invited to consult specific literature for more details [42]. Also, the same scaling methodology based on a dimensional analysis has been used to scale a wind energy conversion system [27].
To obtain a new set of parameters for the electro-thermal model, several scaling factors are introduced:
voltage scaling factor (kv): vscaled/voriginal,
current scaling factor (ki) : iscaled/ioriginal,
time scaling factor (kt) : tscaled/toriginal.
About the thermal model, the format of the cell is always the same regardless of the size of the battery pack. Hence, these
scaling factors do not affect Cp, Rthc and Rthv (the thermal
convection coefficient is supposed to be the same for the overall cell). Only the time constant of the thermal model will be scaled by kt (as for the current filter time constant Tf).
By applying the dimensional analysis [26] and the scaling factors at the electro-thermal model, the new parameters of the scaling electro-thermal model are presented in the Table 2.
Table 2. Parameters of the scaling electro-thermal model.
Original electro-thermal model Scaled electro-thermal model E0 [Kv]E0 K [Kv/KiKt]K Q [KiKt]Q R1 [Kv/Ki]R1 R2 [Kv/Ki]R2 R2C2 [kt]R2C2 (Rthc + Rthv)Cp [kt](Rthc + Rthv)Cp
The method to obtain the parameters of the original model is explained in the next section.
3. PARAMETER EXTRACTION
The nonlinear least-squares solver of the Matlab’s optimization toolbox is used in order to identify parameters of the electro-thermal model. In this study several objective functions to be minimized are proposed:
(11) (12)
(13) Parameters in table 1 are obtained with the minimization of equations (11) and (12) whereas the minimization of equation
(13) allows determining Cp, Rthc and hv.
3.1. Experimental setup for parameter extraction
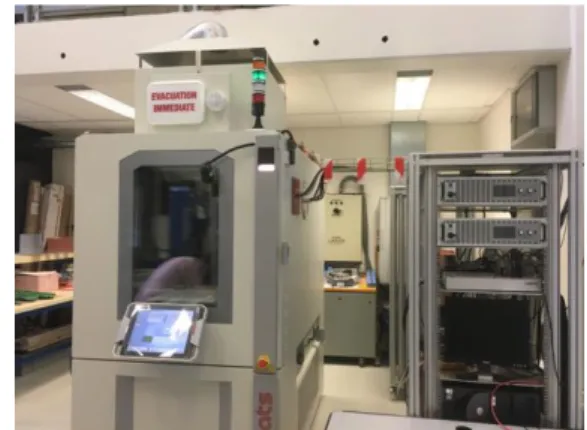
The experimental setup is shown in Fig. 6, which includes a remote controllable bidirectional source of voltage/current (configured by a Power Source PSI 9200-210 and a Controlled Load ELR 9250-210) to adjust charge and discharge profiles, a computer (with DSPACE supervisor) to control the bidirectional source and to secure the experimental test bench, a multi-channel recorder (SEFRAM – DAS 240) for data storage, a thermal chamber (CLIMATS) for environment (thermal) control and finally several LFP batteries under study (Table 3).
Fig. 6. Exprimental test bench for parameter extraction. Table 3. Characteristics of LFP Batteries and cells.
LFP Battery LFP Cell
25.6V – 13Ah 3.2V – 1.6Ah
The used batteries are not equipped neither with a battery management system nor a balancing circuit. Hence, for safety consideration in all tests, both cell voltages and surface temperatures are measured. The upper and lower cut-off voltages are 3.65V and 2.5V to fulfill the safe operating area.
3.2. OCV parameter extraction
To extract the relationship between the OCV and the SOC in order to obtain parameters E0, K and Q, a pulsed current
p Cp Rthc Rthv Ts Tamb 𝑅𝑡ℎ𝑣= 1 ℎ𝑣𝑆𝑢𝑟𝑓 𝑑𝑇𝑠 𝑑𝑡 = Σ𝑝𝑅𝑡ℎ𝑣 𝐶𝑝 𝑅𝑡ℎ𝑐+ 𝑅𝑡ℎ𝑣 − 𝑇𝑠 − 𝑇𝑎𝑚𝑏 𝐶𝑝 𝑅𝑡ℎ𝑐+ 𝑅𝑡ℎ𝑣 𝑂𝐶𝑉𝑒𝑟𝑟𝑜𝑟 = 𝑂𝐶𝑉𝑚𝑜𝑑𝑒𝑙 − 𝑂𝐶𝑉𝑒𝑥𝑝𝑒𝑟𝑖𝑚𝑒𝑛𝑡 2 𝑇𝑠𝑒𝑟𝑟𝑜𝑟 = 𝑇𝑠𝑚𝑜𝑑𝑒𝑙 − 𝑇𝑠𝑒𝑥𝑝𝑒𝑟𝑖𝑚𝑒𝑛𝑡 2 𝑣𝑏𝑎𝑡 𝑒𝑟𝑟𝑜𝑟 = 𝑣𝑏𝑎𝑡 𝑚𝑜𝑑𝑒𝑙 − 𝑣𝑏𝑎𝑡 𝑒𝑥𝑝𝑒𝑟𝑖𝑚𝑒𝑛𝑡 2 Σ𝑝 = 𝑅1𝑖2+ 𝑅2 𝑖∗ 2
profile has been used (Fig. 7). Each pulse current allows reducing the SOC by 10% with a constant rate (C/5). A rest
time (toff) of one hour has been fixed for obtaining an OCV in
equilibrium [43].
First of all, the LFP cell was fully charged (SOC=1) with a constant current constant voltage profile (CCCV) with a constant current charge at 0.2C until the voltage reaches 3.65V; then, a constant voltage of 3.65V charge until the current is below 0.02C. Then, the battery was discharged with constant current (0.2C) until reaching the desired initial SOC at 0.9. During this test, the temperature in the thermal chamber was regulated at 20°C.
Fig.7. Pulse current profile for OCV measurement.
The test result is reported in Fig.8 with the OCV hysteresis (the blue curve represents the OCV measured in charging mode while the orange curve represents the OCV measured in discharging mode). To simplify the model, the OCV hysteresis is not taken into account despite its importance for the SOC estimation accuracy [44]. Then, the OCV characteristic used to extract parameters is based on an average between the two measured OCV curves (reported in dashed line in Fig.8).
Fig.8. OCV curves for LFP cell (dashed line : OCVexperimental, solid line :
OCVmodel).
The results of the optimization problem with the objective function of equation (11) are presented in table 4. For qualifying the accuracy of the OCV model a weighted Root Mean Square Error (RMSE) is calculated (Eq. 14). A comparison of OCV curves, between measurements (dashed line) and model (solid line) with parameters in table 4, is represented by solid line in Fig. 8.
Table 4. Results of OCV parameter extraction.
E0 K Q RMSE
3.323V 0.01V/Ah 1.5Ah 0.35%
(14)
3.3. Voltage drop parameter extraction
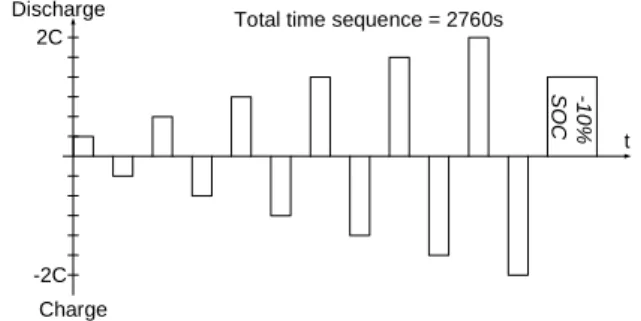
This second parameter identification method is based on the HPPC profile which is widely used for parameter identification [45]. The test procedure is conducted on the LFP battery (25.6V – 13Ah) at 10% of SOC intervals (by constant current 1C discharge segments) starting from 90% to 10% SOC, each interval being followed by 30min rest time before applying the next sequence. A sequence (Fig. 9) is composed with symmetrical charge and discharge pulses which magnitudes are inside the range from 0.1C to 2C.
Fig.9. Pulse current profile sequence.
For each HPPC profile, the battery was placed in the climatic chamber where the room temperature was regulated. In order to study the influence of the temperature on the
parameters (R1, R2, Tf), the parameters have been identified for
several ambient temperatures (0°C, 10°C, 20°C, 30°C). The battery is composed with 8 LFP modules in series each module being equipped with 8 LFP cells in parallel (module characteristics: 3.2V – 13Ah). To solve the optimization problem (minimization of the equation 12) in order to obtain overvoltage parameters, an experimental measurement is necessary. This measure is based on the voltage across one
module (Vmodule) of the battery. OCV parameters determined in
section 3.2 have been implemented in the electrical model with a current scaling factor equal to 8 (1.6Ah 13Ah). A
comparison of Vmodule curves, between measurement and model,
for the ambient temperature at 0°C is represented in Fig.10.
Fig.10. Comparison of measured (green line) and simulated (blue line) of module voltage at 0°C.
The parameter values, for different ambient temperatures, and the weighted RMSE (based on equation 14) are reported in Table 5. The RMSE values show that the simulated results are well fitted with the experimental results.
Table 5. Results of voltage drop parameter extration. Ambient temperature R1 R2 Tf RMSE
0°C 13.4mΩ 4.8mΩ 46s 0.84% 10°C 10.5mΩ 2.9mΩ 47s 0.89% 20°C 9.1mΩ 1.3mΩ 51s 0.82% 30°C 7.3mΩ 0.63mΩ 36s 0.66%
During the HPPC tests, the average surface temperature
(TS) of the cell is close to the ambient temperature. Hence, from
Charge 2C -2C Discharge t -10 % S OC
Total time sequence = 2760s
0 1 2 3 4 5 6 2.5 3 3.5 4 Time (h) V m o d u le (V ) t C/5 -C/5 ton ton toff toff 90%<SOC<10%
DSOC = 10% ttoffon = 30min = 60min
D is ch ar g e C ha rge 𝑅𝑀𝑆𝐸 % = 100 1𝑁 𝑁𝑗 =1 𝑂𝐶𝑉𝑚𝑜𝑑𝑒𝑙 (𝑗 )− 𝑂𝐶𝑉𝑒𝑥𝑝𝑒𝑟𝑖𝑚𝑒𝑛𝑡 (𝑗 )2 𝑉𝑐𝑒𝑙𝑙𝑛𝑜𝑚 (= 3.2𝑉)
the internal resistances values, noted in Table 5, the influence of the temperature on the internal resistances can be given by the following equations:
(15) (16) where R is the gas constant (8.314J/mol). The temperature dependence of resistance R1 can be given by an Arrhenius law while, for the resistance R2, the temperature dependence is given by an exponential curve fitting.The fitting parameters (K11, K12, K21, K22) of equations (15) and (16) are determined
with a nonlinear least-squares solver and presented in Table 6.
Table 6. Parameters of internal resistances.
K11 K12 K21 K22
0.26mΩ 8600J/mol 4033Ω 0.05K-1
In the electrical model, Tf is considered as constant and is
calculated from the average of the 4 values in table 5 (i.e. 45s).
3.4. Thermal parameter extraction
The parameters (Cp, Rthc and hv) are obtained with the same
method as the previous parameter extraction. Data measurements used in the optimization problem presented in (13) are the surface temperature measurements (on a cell in a LFP module). The surface temperature has been measured during the HPPC test detailed in the section 3.3. The simulated surface temperature is based on the equation (10). Thermal parameters are shown in Table 7 for different ambient temperature.
Table 7. Parameters of thermal model.
Ambient temperature Cp Rthc hv 0°C 27J/K 22.6K/W 4.7W/m²/K 10°C 26J/K 23.3K/W 5W/m²/K 20°C 27J/K 21.3K/W 4.8W/m²/K 30°C 28J/K 23.5K/W 4W/m²/K Parameters used in thermal model 27J/K 22.6K/W 4.6W/m²/K
Parameter values used in the model is based on the average of the four values in Table 7. In [46], for 18650 format LFP cell, the specific heat capacity value is around 36J/K and the thermal convection coefficient (for natural convection) is
around 4W/m²/K. The ratio Rthc/Rthv can be calculated with
parameters in the last row of Table 8. The value of Rthc/Rthv is
equal to 0.33. This value is close to that calculated in [41] for cylindrical LFP cell.
4. ROBUSNESS ANALYSIS AND TIME SCALING
4.1. Robustness analysis of the electo-thermal model
In order to assess the robustness of the identification process, a validation profile was used to ensure that the electro-thermal battery model works well in realistic settings. The current profile based on microgrid application with a specific energy management strategy [47] is shown in Fig.11. The battery current magnitude is adapted for the physical battery configuration. The battery used for this analysis has the following characteristics: 25.6V – 13Ah. A comparison between the voltage battery measurement and voltage response of the battery model is made in this section. This comparison is also conducted for the surface temperature.
Fig.11. Current battery profil for robustness analyis.
Initially, the battery SOC is set to 80% and the battery was placed in the thermal chamber with a regulated temperature. The analysis was conducted with different ambient temperatures from 10°C to 30°C.
Parameters R1, R2 and Tf were obtained from a LFP
module (3.2V – 13Ah) while parameters E0, K and Q were obtained from LFP cell (3.2V – 1.6Ah). Hence, to obtain parameters of scaled electro-thermal battery model (25.6V – 13Ah), voltage and current scaling factors have to be applied as mentioned in Table 8. Neither voltage nor current scaling factors are applied on the thermal model because the surface temperature of the battery is the same as the surface temperature of the cell.
Table 8. Parameters of scaled electro-thermal battery model. OCV Kv =8; Ki=8 Thermal Voltage drop Kv=8; Ki=1 [Kv]E0 Cp [Kv/Ki]R1 [Kv/KiKt]K Rthc [Kv/Ki]R2 [KiKt]Q hv [kt]R2C2
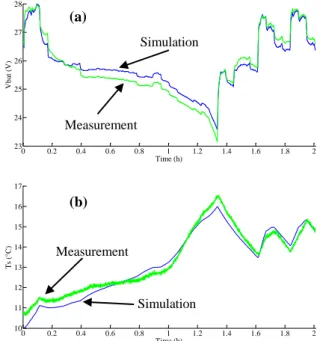
A comparison between the simulation and the
measurements at 10°C is shown in Fig. 12: there is only a small difference between the measured and simulated values for both battery voltage and surface temperature of the cell.
Fig.12. (a) voltage battery, (b) surface temperature of a cell during the cycle profile (green line : experimental measurements, blue line : responses of the scaled battery model).
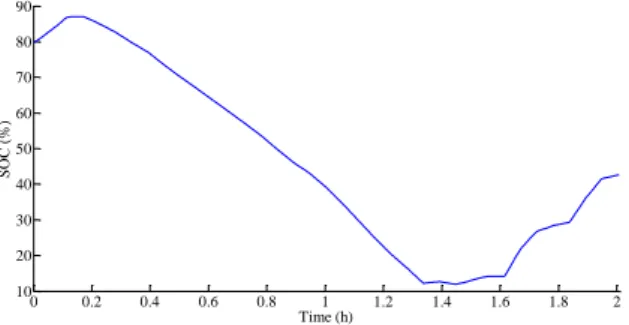
During the test, the SOC variation of the battery is depicted in Fig. 13. 0 0.2 0.4 0.6 0.8 1 1.2 1.4 1.6 1.8 2 -20 -15 -10 -5 0 5 10 15 Time (h) Cu rre n t (A ) 0 0.2 0.4 0.6 0.8 1 1.2 1.4 1.6 1.8 2 23 24 25 26 27 28 Time (h) V b a t (V ) 0 0.2 0.4 0.6 0.8 1 1.2 1.4 1.6 1.8 2 10 11 12 13 14 15 16 17 Time (h) T s (° C)
𝑅1 = 𝐾
11𝑒
𝐾12 𝑅𝑇𝑆𝑅2 = 𝐾
21𝑒
−𝐾22𝑇𝑆 (a) (b) Measurement Simulation Measurement SimulationFig.13. SOC varaitaion for the validation profile.
The performance of the scaled model was tested for several ambient temperatures (10°, 20°C and 30°C). The Table 9 presents the weighted RMSE of the battery voltage and the surface temperature (based on equation 14). The weighted RMSE of the surface temperature was calculated by the ratio between the RMSE value and the ambient temperature. These results validate the performance of the scaling electro-thermal model for large SOC variations and different ambient temperatures.
Table 9. RMSE of the scaled electro-thermal model. Ambient temperature RMSE (Vbat) RMSE (Ts)
10°C 0.9% 3.2%
20°C 0.6% 1.75%
30°C 0.5% 3.3%
The scaled model presented in this section can be implemented in a real time simulator in order to develop a physical emulator for HIL testing (Fig.1). Nevertheless, in order to accelerate the physical emulation of the battery and therefore to reduce the development cost and testing efforts, the time scaling is an original concept for reduce the testing time.
To accelerate the testing time with a real battery, the magnitude of the current profile has to be increased. However, the internal voltage drop in the battery generated by the magnitude of the current will cause a capacity reduction and a possible thermal abuse in the battery. So, if a physical emulator is based on a real battery [25], the time scaling is not possible. So, the time scaling can only be done with a scalable battery model.
4.2. Time accelerated with the scaled electro-thermal model
The total time of the current profile, presented in Fig. 11, is 2 hours. For instance, in order to reduce the test time by 60 (i.e, 2 hours at real time equal to 2 minutes in “compacted virtual time”), a time axis compression (by 60) is applied on the current profile.
Fig.14. (a) voltage battery, (b) surface temperature of a cell (green line : experimental measurements presented in Fig.12; blue line : responses of scaled battery model).
The results of the scaled electro-thermal battery model (at 10°C) with kt=1/60 (and with the same voltage and current scaling factors as in the robustness analysis) are shown in Fig.14. The simulated response of the scaled battery model is very close to the experimental measurements for which the total time is 2h. Hence, with the scaled electro-thermal model presented in this paper, it is possible to reduce testing times for HIL simulation. However, for the development of the physical emulator and for the HIL experiments, some limits can appear on kt values. Indeed, the bandwidth of the power supply or the bandwidth of the control loops of power electronic converters can limit the performance of the accelerated tests.
5. CONCLUSION
A scaled electro-thermal model of a cylindrical LFP/graphite Li-ion battery was presented. This model is used in order to develop a physical emulator in power HIL and to predict the thermal performance of the LFP cell under dynamic current profile and for different ambient temperatures. Hence, the surface temperature information can be implemented in the energy management systems of the microgrid. Good agreement was obtained, despite of simplifying assumptions, between simulated and experimental results. Moreover, the accuracy of the scaled model has been tested for several ambient temperature and for a time scaling allowing to shorten testing times.
6. REFERENCES
[1] «Global EV Outlook 2017», International Energy Agency publication, https://webstore.iea.org/global-ev-outlook-2017.
[2] M.Rashed, J.M Le Peuvedic and S. Bozhko, «Conceptual Design of Battery Energy Storage for Aircraft Hybrid Propulsion System», International Conference on Electrical Systems for Aircraft, Railway, Ship Propulsion and Road Vehicles & International Transportation Electrification Conference (ESARS-ITEC), Toulouse, France, 2016. [3] R. Rigo Mariani, F. Lacressonnière, G. Fontes and X. Roboam, «Design
of a medium voltage power converter-storage devices embedded in a hybrid emergency network for more electrical aircraft», Mathematics and Computers in Simulation, vol. 91, p. 72–90, 2013.
[4] E. Reihani, S.Sepasi, L. R. Roose and M. Matsuura, «Energy management at the distribution grid using a Battery Energy Storage System (BESS)», International Journal of Electrical Power & Energy Systems, vol. 77, p. 337-344, 2016
[5] J. Leadbetter and L.Swan, «Battery storage system for residential electricity peak demand shaving», Energy and Buildings, vol. 55, p. 685-692, 2012.
[6] M. Koller, T. Borsche, A. Ulbig and G. Andersson, «Review of grid applications with the Zurich 1 MW battery energy storage system», Electric Power Systems Research, vol. 120, p. 128-135, 2015.
[7] H. Branco, R. Castro and A. S. Lopes,«Battery energy storage systems as a way to integrate renewable energy in small isolated power systems», Energy for Sustainable Development, vol. 43, p. 90-99, 2018.
0 0.2 0.4 0.6 0.8 1 1.2 1.4 1.6 1.8 2 10 20 30 40 50 60 70 80 90 Time (h) S O C (% ) (a) (b) Measurement Simulation (kt=1/60) Measurement Simulation (kt=1/60)
[8] H. Alharbi and K. Bhattacharya, «Optimal Sizing of Battery Energy Storage Systems for microgrids», IEEE International Conference Electrical Power and Energy, Calgary, Italy, 2014.
[9] A. Oudalov, D. Chartouni and C. Ohler, «Optimizing a Battery Energy Storage System for Primary Frequency Control», IEEE Transactions on Power Systems, vol. 22, issue 3, p. 1259-1266, 2007.
[10] J. Khazaei, L. Piyasinghe, V. R. Disfani, Z. Miao,L. Fan, and G. Gurlaskie, «Real-time simulationand hardware-in-the-loop tests of a battery system»,IEEE Power Energy Soc. Gen. Meet., Denver, USA, 2015.
[11] L. Yi1, H. He, J. Peng, «Hardware-in-Loop Simulation for the energy management system development of a Plug-in hybrid electric bus», Energy Procedia, vol. 88, p. 950-956, 2016.
[12] A. Taksale, V.Vaidya, P. Shahane, G. Dronamraju, V. Deulkar, «Low cost hardware-in-loop for automotive application», IEEE International Conference Industrial Instrumentation and Control, Pune, India, 2015. [13] H.. Dai, X. Zhang, X. Wei, Z. Sun, J. Wang and F. Hu, «Cell-BMS
validation with a hardware-in-the-loop simulation,of lithium-ion battery cells for electric vehicles», International Journal of Electrical Power & Energy Systems, vol. 52, p. 174-184, 2013.
[14] J. V. Barreras, C. Fleischer and A. E. Christensen, M. Swierczynski, E. Schaltz, S. J.Andreasen and Dirk Uwe Sauer, «An Advanced HIL Simulation Battery Model for Battery Management System Testing», IEEE Transactions on Industry Applications, vol. 52, issue 6, p. 5086-5099, 2016.
[15] Dai H., Wei X., Sun Z. and Wang J., «A Hardware-in-the-Loop System for Development of Automotive Battery Management System», Measuring Technology and Mechatronics Automation in Electrical Engineering. Lecture Notes in Electrical Engineering, vol. 135, Springer, New York, NY.
[16] H. Haupt, M. Plöger and J. Bracker, «Hardware-in-the-Loop Test of Battery Management Systems», 7th IFAC Symposium on Advances in Automotive Control, Tokyo, Japan, 2013.
[17] M. Wang, L. Xu, K. Wang, Z. Zheng, Y. Li, C. Grada and He Zhang, «Hardware-in-the-loop real-time plateform», the Journal of Ingineering, 2018, DOI 10.1049/joe.2018.0017.
[18] A. Kaden, B. Boche and R. Luckner, «Hardware-in-the-Loop Flight Simulator – An Essential Part in the Development Process for the Automatic Flight Control System of a Utility Aircraft», p.585-601, In: Q. Chu, B. Mulder, D. Choukroun, EJ. van Kampen, C. de Visser, G. Looye, Advances in Aerospace Guidance, Navigation and Control. Springer, Berlin, Heidelberg.
[19] A. S. Vijay, S. Doolla and M. C. Chandorkar, «Real-Time Testing Approaches for Microgrids», IEEE Journal of Emerging and Selected Topics in Power Electronics, vol. 5, issue 3, p. 1356-1376, 2017. [20] Y.V. P. Kumar and R. Bhimasingu, «Alternative Hardware-In-the-Loop
(HIL) Setups for Real-Time Simulation and Testing of Microgrids», 1st IEEE International Conference on Power Electronics. Intelligent Control and Energy Systems, Delhi, India, 2016.
[21] F. Baccino, A. Brissette, D. Ishchenko, A. Kondabathini and P. Serra, «Real-time Hardware-in-the-Loop Modeling for Microgrid Applications», 6th International Conference on Clean Electrical Power (ICCEP), Santa Margherita Ligure, Italy, 2017.
[22] N. Shidore, N. Kim, R. Vijayagopal, D. Lee, A. Rousseau, J. Kwon, B. Honel and E. Haggard, «Battery in the Loop: Battery Evaluation in a systems context», IEEE Transportation Electrification Conference and Expo, Dearborn, USA,2014.
[23] R. Razavian, N. L. Azad and J. Mcphee, «A battery Hardware-in-the-Loop setup for concurrent design and evaluation of real-time optimal HEV power management controllers», International Journal of Electric and Hybrid Vehicles, vol. 5, issue 3, p. 177-194, 2013.
[24] C. Seitl, J. Kathan, G. Lauss and Felix Lehfuß, «Power hardware-in-the-loop implementation and verification of a real time capable battery model», IEEE 23rd International Symposium on Industrial Electronics (ISIE), Istanbul, Turkey, 2014.
[25] J. Khazaei, L. Piyasinghe, V. Rasouli Disfani, Z. Miao, L. Fan and G. Gurlaskie, «Real-time simulation and hardware-in-the-loop tests of a battery system», IEEE Power & Energy Society General Meeting, Denver, USA, 2015.
[26] J.M. Cabello, X. Roboam, S. Junco, E. Bru and F. Lacressonnière, «Scaling Electrochemical Battery Models for Time-Accelerated and Size-Scaled Experiments on Test-Benches», IEEE Transactions on Power Systems, vol. 32, Issue 6, p. 4233-4240, 2017.
[27] A.Varais, X. Roboam, F.Lacressonnière and J.M. Cabello, «Scaling of wind energy conversion system for time accelerated and size scaled experiments», Elsevier MATCOM journal (Mathematics and Computers in Simulation, Electrimacs 2017 special issue), 2018.
[28] O. Tremblay, L-A. Dessaint, and A-I. Dekkiche, «A Generic Battery Model for the Dynamic Simulation of Hybrid Electric Vehicles», IEEE Vehicle Power and Propulsion Conference, Arlington, USA, 2007. [29] J.M. Cabello, E. Bru X. Roboam, F. Lacressonnière and S. Junco,
«Battery dynamic model improvement with parameters estimation and experimental validation», IMAACA Conference, Bergeggi, Italy, 2015. [30] M.B. Camara, H. Gualous, F. Gustin, and A. Berthon, «Design and New
Control of DC/DC Converters to Share Energy Between Supercapacitors and Batteries in Hybrid Vehicles», IEEE Trans. Veh. Techn., vol. 57, issue 5, p. 2721-2735, 2008
[31] L. Boulon, D. Hissel, A. Bouscayrol, M.C. Pera, and P. Delarue, «Multi physics modelling and representation of power and energy sources for Hybrid Electric Vehicles», Proc. Vehicle Power and Propulsion Conference (VPPC), p. 1-6, 2008
[32] S. N. Motapon, L. A. Dessaint, and K. Al-Haddad, «A Comparative Study of Energy Management Schemes for a Fuel-Cell Hybrid Emergency Power System of More-Electric Aircraft», IEEE Trans. Ind. Electron., vol. 61, issue 3, p. 1320-1334, 2014.
[33] E. Kuhn, C. Forgez, P. Lagonotte, and G. Friedrich, «Modelling Ni-mH battery using Cauer and Foster structures», Journal of Power Sources, vol. 158, p. 1490-1497, 2006.
[34] M.A. Roscher, O. Bohlen and J. Vetter, «OCV Hysteresis in Li-ion Batteries inclunding Two-Phase Transition Materials», International Journal of Electrochemistry, 2011.
[35] K. E. Thomas, C. Bogatu and J. Newman, «Measurement of the Entropy of Reaction as a Function of State of Charge in Doped and Undoped Lithium Manganese Oxide», Journal of The Electrochemical Society, vol. 148, issue 6, p. 570-575, 2001.
[36] M.-H. Chang, H.-P. H. and S.-W. Chang, «A New State of Charge Estimation Method for LiFePO4 Battery Packs Used in Robots», Energies, vol. 6, p. 2007-2030, 2013.
[37] Z. Zhang, J. Wang and X. Wang, «An improved charging/discharging strategy of lithium batteries considering depreciation cost in day-ahead microgrid scheduling», Energy Conversion and Management, vol. 15, p. 675-684, 2015.
[38] G. Hunt, «PNGV battery test manual», INEEL, Rev. 3, 2001.
[39] J. Shim, and K. A. Striebel, «Characterization of high-power lithium-ion cells during constant current cycling: Part I. Cycle performance and electrochemical diagnostics», Journal of Power Sources, vol. 122, p. 188–194, 2003.
[40] D. H. Jeon and S. M. Baek, «Thermal modeling of cylindrical lithium ion battery during discharge cycle», Energy Conversion and Management, vol. 52, p. 2973-2981, 2011.
[41] C. Forgez, D.V. Do, G. Friedrich, M. Morcrette and C. Delacourt, «Thermal modeling of a cylindrical LiFePO4/graphite lithium-ion battery», Journal of Power Sources, vol. 195, Issue 9, p. 2961-2968, 2010.
[42] B. Zohuri, «Dimensional Analysis Beyond the Pi Theorem», springer, berlin, 2017.
[43] F. Baronti, R. Saletti and W. Zamboni, «Open Circuit Voltage of Lithium-ion batteries for energy storage in DC microgrids», IEEE First International Conference on DC Microgrids (ICDCM) proceedings, p. 343-348, 2015.
[44] A. Marongiu, N. Nlandi,Y. Rong and D. U. Sauer, «On-board capacity estimation of lithium iron phosphate batteries by means of half-cell curves», Journal of Power Sources, vol. 324, p. 158-169, 2016. [45] K. S. Hariharan and V. S. Kumar, « A nonlinear equivalent circuit model
for lithium ion cells », Journal of Power Sources, vol. 222, p. 210-217, 2013.
[46] L.H. Saw, K. Somasundaram, Y. Ye and A.A.O. Tay, « Electro-thermal analysis of Lithium Iron Phosphate battery for electric vehicles», Journal of Power Sources, vol.249, p. 231-238, 2014.
[47] D. Hernandez-Torres, C. Turpin, X. Roboam, B. Sareni, «Optimal techno-economical storage sizing for wind power producers in day-ahead markets for island networks», Electrimacs conference, Toulouse, France, 2017.