Publisher’s version / Version de l'éditeur:
Sensors, Instrumentation and Special Topics, Volume 6: Proceedings of the 29th
IMAC, A Conference on Structural Dynamics, 2011, 6, pp. 103-118, 2011
READ THESE TERMS AND CONDITIONS CAREFULLY BEFORE USING THIS WEBSITE.
https://nrc-publications.canada.ca/eng/copyright
Vous avez des questions? Nous pouvons vous aider. Pour communiquer directement avec un auteur, consultez la
première page de la revue dans laquelle son article a été publié afin de trouver ses coordonnées. Si vous n’arrivez pas à les repérer, communiquez avec nous à [email protected].
Questions? Contact the NRC Publications Archive team at
[email protected]. If you wish to email the authors directly, please see the first page of the publication for their contact information.
NRC Publications Archive
Archives des publications du CNRC
This publication could be one of several versions: author’s original, accepted manuscript or the publisher’s version. / La version de cette publication peut être l’une des suivantes : la version prépublication de l’auteur, la version acceptée du manuscrit ou la version de l’éditeur.
For the publisher’s version, please access the DOI link below./ Pour consulter la version de l’éditeur, utilisez le lien DOI ci-dessous.
https://doi.org/10.1007/978-1-4419-9507-0_12
Access and use of this website and the material on it are subject to the Terms and Conditions set forth at
High intensity noise generation for extremely large reverberant room
test applications
Grewal, Anant; Ramakrishnan, Ramini; Hughes, William O.; Woyski, Bill;
Elfstrom, Gary; Mech, Chon; Chen, Yong
https://publications-cnrc.canada.ca/fra/droits
L’accès à ce site Web et l’utilisation de son contenu sont assujettis aux conditions présentées dans le site LISEZ CES CONDITIONS ATTENTIVEMENT AVANT D’UTILISER CE SITE WEB.
NRC Publications Record / Notice d'Archives des publications de CNRC:
https://nrc-publications.canada.ca/eng/view/object/?id=f3525397-26a3-4d6b-a0c3-8147c8198559 https://publications-cnrc.canada.ca/fra/voir/objet/?id=f3525397-26a3-4d6b-a0c3-8147c8198559High Intensity Noise Generation for Extremely Large Reverberant Room Test
Applications
Anant Grewal
1, Ramani Ramakrishnan
2,3, William O. Hughes
4, Bill Woyski
5, Gary Elfstrom
3,
Chon Mech
5and Yong Chen
11 National Research Council Canada, Institute for Aerospace Research,1200 Montreal Road, Ottawa, ON,
Canada, K1A 0R6, email: [email protected]
2 Department of Architectural Science, Ryerson University, 350 Victoria Street, Toronto, ON, Canada, M5B 2K3 3 Aiolos Engineering Corporation, Suite 100, 2150 Islington Avenue, Toronto, ON, Canada, M9P 3V4
4 NASA Glenn Research Center, 21000 Brookpark Road, Cleveland, OH 44135, USA 5
Team Corporation, 11591 Watertank Road, Burlington, WA 98233-3626, USA
ABSTRACT
A recent operational need for the development of a large (101,000 ft3) reverberant acoustic chamber at the Space Power Facility of NASA Glenn Research Center’s Plum Brook Station with the requirement of generating sound pressure levels (SPL) as high as 163 dB has resulted in the need to re-examine the generation of noise in reverberant rooms. Early in the design stage, it was realized that the acoustic power level capability (10-30 kW) of conventional electrodynamic air modulators, such as those supplied by the Wyle Corporation, would be required in unprecedented numbers to meet the test spectra requirements. The design team then turned to a lesser known modulator, the hydraulically driven air modulator supplied by the Team Corporation, which has 150-200 kW acoustic power capability. The advantage to the project was a significant reduction in the number of modulators required to meet the requirements.
However, since only limited characterization of Team modulator’s performance has been reported, a test program was required in order to mitigate the risk of the design of the RATF. Aiolos Corporation, which is responsible for the acoustic design of the RATF, and the Institute of Aerospace Research (IAR) of the National Research Council of Canada (NRC), entered into a collaborative agreement with the objective of characterizing, optimizing and investigating the controllability of the Team modulators. The test program was performed at the NRC-IAR reverberant chamber, a 19,000 ft3 facility located in Ottawa, Ontario, Canada. The current paper provides details of the principle of operation of the Team modulators, including their servo control loops and provides of a summary of the characterization and controllability test program.
1.0 INTRODUCTION
The NASA Space Environmental Test (SET) Project is tasked to develop new environmental test facilities to support NASA’s developing space exploration program. The Space Power Facility (SPF) at the NASA Glenn Research Center’s Plum Brook Station in Sandusky, Ohio, USA is already the home of the world’s largest thermal vacuum chamber. In order to provide the aerospace customer with one-stop testing for the suite of space environmental testing, the SPF is being augmented through the NASA SET Project Office with new reverberant acoustic [1], mechanical vibration [2], and modal test [2] facilities.
In August 2007, Benham Companies, LLC (Benham), located in Oklahoma City, Oklahoma, USA, won the NASA prime contract to design and construct the acoustic, vibration and modal test facilities, as well as to provide the high speed data acquisition system to support these facilities. Benham contracted with Aiolos Engineering Corporation (Aiolos), located in Toronto, Ontario, Canada to provide the acoustic design of the Reverberant Acoustic Test Facility (RATF).
The RATF will be a unique acoustic test facility due to its combination of very large chamber test volume and extremely high acoustic sound levels. Typically, the world’s larger reverberant test chambers have a volume of ~ 50,000 to 76,000 ft3, and can produce an empty chamber overall sound pressure level (OASPL) of approximately 152 to 157 dB. However the RATF has a volume of approximately 101,000 ft3 and has been designed to produce an empty chamber test level of 163 dB OASPL. Amongst the world’s active known reverberant acoustic chambers only the Lockheed Martin test facility located in
Sunnyvale, California, USA is larger in volume at 189,200 ft3 than RATF, but that test facility produces an empty chamber level of approximately 156.5 dB OASPL, which is at least 6 dB less than RATF’s predicted capability. The RATF’s combination of size and acoustic power was necessary to meet NASA’s requirements to test the next generation of large space exploration vehicles whose acoustic environments have been predicted to be 163 dB OASPL or even higher.
2.0 RATF REQUIREMENTS
The key requirements for the RATF acoustic design were as follows:
a. The RATF shall be physically as large as possible within the given space limitations of SPF.
b. The RATF’s test chamber shall be properly sized to acoustically test four space vehicle configurations, encompassing an 18-ft diameter test article, and a 47-ft tall test article.
c. The RATF’s test chamber shall physically allow a 32.8-ft diameter test article weighing up to 120,000 pounds. d. The RATF shall generate the empty chamber acoustic test spectra shown in Figure 1, for continuous test duration of
10 minutes. These eight (8) “C” spectra represent a wide range of current and future NASA missions, including five (5) spectra with a 163 dB OASPL.
e. The RATF shall include an independent, multi-channel digital acoustic control system capable of controlling the noise sources to the sound pressure levels (SPL) and spectra shown in Figure 1, within specified tolerances ( +5dB below the 50 Hz one-third octave bands (OTOB), +3dB covering 50 Hz-2K Hz OTOB's, +5dB above 2K Hz OTOB's, +1.5dB on OASPL).
The physical size of the RATF was determined from the maximum available space within the SPF, along with following guidelines on proper room ratios and good acoustic test practices. Benham and Aiolos ultimately designed a reverberant acoustic test chamber with the following dimensions: 47.5-ft long x 37.5-ft wide x 57-ft high. After accounting for the main chamber door jamb structure the resulting chamber volume is 101,189 ft3. A picture of the RATF under construction is shown in Figure 2.
Figure 1: Acoustic Test Spectra Requirements
The next design issue was to determine the number and type of acoustic modulators or noise generators that would be needed to create the enormous sound power necessary to sustain the high SPL in this large chamber volume. Prior to the “C” acoustic spectra requirements becoming effective in September 2008, six other spectra were originally required including three spectra whose characteristics and SPL were very similar to the C2 spectrum, as shown in Figure 1. The common characteristic of the initial three spectra and C2 is very high SPL at frequencies at and below 100 Hz. The Wyle WAS3000 modulator, which has been in use since the 1960’s, with an acoustic power generation capability of 30kW, was initially considered. Preliminary analysis showed that over fifty WAS3000 would be required to meet the initial three spectra. Most of these modulators would be paired with low frequency horns, which have very large dimensions at the horn mouth, the end result being a multitude of design problems in terms of integration with the chamber structure.
110.0 115.0 120.0 125.0 130.0 135.0 140.0 145.0 150.0 155.0 160.0 10 100 1/3 Octave Frequency 1000 10000 SP L [ d B] SP L ( d B ) re : 20 µ P a (Hz) C1 C2 C3 C4 C5 C6 C7 C8
F l T a a e a ( W A a N p T th D s to u T p ( d Figure 2: On ocated behind
The need was available high a and MK-VII. T effective at the and 200 kW, re 25, 35, 50, 80 WAS-5000 mo Although the T available on th NASA, Aiolos programs [3] at
3.0
Team Corporat han 40 years. Don Skilling at shakers as the m o mass ratio of use of hydrauli Team Corporat product line in acoustic) to th design. Both ngoing Constr d the horn walclear to reduc acoustic power The Team mo low frequenci espectively. Th , 100 and 160 odulators on 25 Team modulato hem. To obta jointly with st t the Ottawa N
TEAM AI
3.1 Htion has been i The Air Mod t the Aircraft D motive force fo f the hydraulic c shakers did i tion worked w n 1983. At Te he current 150 the MK-VI a ruction of the ll shown in the ce the number r modulators w dulators, altho es (at or below hese Team mo Hz) for the fin 0 Hz horns to ors have been ain Team mod
taff at the Nati RC 19,000 ft3
IR MODUL
History involved with dulator is the ev Division of No or opening and shaker might ndeed extend t with Northrop a eam, the MK-V 0 kW (acoustic and MK-VII b e NASA Rev e photograph. of horns by s were the Team ough not widel w the 125 Hz O odulators werenal RATF desi add to the high in service for dulator characte ional Research reverberant ac
LATOR
the design, ma volutionary de orthrop Corpor d closing the p open and close the controllable as a supplier a V model was d c). The MK-V benefited from erberant Aco . selecting highe Corporation (T ly utilized wit OTOB) with a r eventually pai ign. Benham h frequency cap r over 40 years erization data, h Council of C oustic test facianufacture, app evelopment of ration. Skilling
oppet valve. I e the air valve e acoustic spec and subcontrac dropped and th VII Air Modu m Team’s serv
oustic Test Fa
er power modu Team) modula thin the reverb rated modulato ired with horn later augmente pability of the s, there was n , and to qualif anada (NRC) d ility. plication and i an acoustic ge g’s early work It then became to even higher ctrum out beyo ctor from the in
he power of th ulator was not vo valve and
acility (RATF
ulators. The on ators with mod berant acoustic r acoustic pow ns with six diff ed the RATF d RATF. ot much acous fy and mitigat designed and c nstallation of A enerator design focused on th apparent to hi r frequencies. ond 500 Hz. nitial design u he MK-VI wa altered signifi servo controll F). The modu
nly known com dels known as t
c industry, are wer of 150 kW
ferent cut-off f design with sev
stic characteriz te any associa conducted a se
Air Modulator ned in the early he use of electr
im that the sup He demonstrat until Team pur as increased fro icantly from th ler improveme ulators are mmercially the MK-VI especially (kilowatts) frequencies veral Wyle zation data ted risk to eries of test rs for more y 1960s by ro-dynamic perior force ted that the rchased the om 85 kW he original ents. The
improvements eliminated the instabilities that the very early Northrop Air Modulators exhibited, with the result that current models are repeatable and reliable.
3.2 Modulator Design
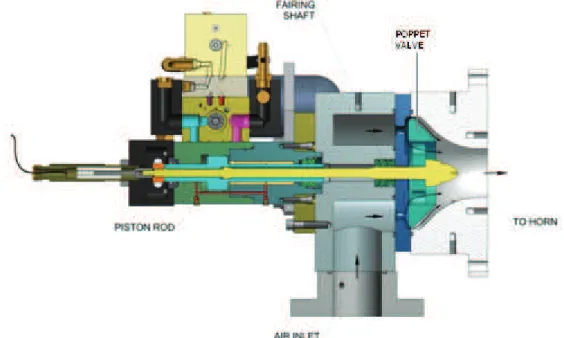
Figure 3 displays the complete Air Modulator assembly. The Air Modulator comprises the hydraulic actuator, poppet valve and seat, and an air supply plenum. The poppet valve is housed in an air plenum designed to deliver a steady uniform source of air to the poppet valve. The plenum mounts to the throat of the acoustic horn. An air supply line is also connected to the plenum. The Air Modulator is designed to operate at air supply pressures between 40 and 200 psig.
Figure 3: Team Air Modulator
The actuator is mounted on the plenum in such a way that it can drive the poppet valve via a short concentric shaft. The air valve is a reciprocating poppet valve that is driven by a special high response electro-hydraulic actuator (see Figure 4). The hydraulic actuator is driven by Team servo valves models V-20 and V-140. The V-20 valve, called the pilot valve, is a voice coil driven, four way spool valve. The V-140 valve, called the slave valve, is driven by the pilot valve and provides high flow to the actuator.
The command signal can be generated by an automatic control system or a manual random noise shaping system. The voice coil signal is generated from the command with a position servo loop and a power amplifier. The poppet valve position is monitored, and fed back and serves as the control parameter.
The hydraulic actuator features hydrostatic bearings that prevent metal to metal contact and it uses no high pressure seals. This reduces the wear on parts and increases the longevity of the actuator. Additionally, the high frequency response dual stage voice coil driven servo valve allow air modulation out to high frequencies. The frequency response of the Team air modulators is shown in Figure 5.
Figure 5: Team MK-VI and MK-VII Air Valve Displacement versus Frequency
3.3 Principle of Operation
3.3.1 Air Modulator
The Air Modulator system is developed specifically to generate broad band random noise. The main emphasis during the development was to maximize the efficiency and power output while keeping the mechanism simple and reliable. The acoustic power is given by the following equation [4]:
. 66 .
Where is the acoustic power in kilowatts; is the air flow in SCFM (standard ft3 per minute); is the air stream to acoustic power efficiency; 0.166 is a factor for units at standard condition; and is the pressure ratio (i.e. the ratio of supply pressure to outlet pressure). The air modulator theoretical efficiency of air stream power to acoustic power is approximately 33%. The Team MK-VI and VII modulators can operate with either air or gaseous nitrogen as their pressurized gas source. The RATF will use gaseous nitrogen for its operation, whereas air was used for all testing at the NRC.
3.3.2 Air Modulation by Poppet Valve
High energy noise is produced by modulating the flow of a large quantity of high pressure gas with a mechanically driven poppet valve. The Team modulator differs from other air modulators in that it closes off the air stream completely when the poppet valve is shut and, if the supply pressure is high enough, generates a shock wave in the air stream when it opens. This creates the large pressure fluctuations required to produce 160 to 175 dB sound pressure levels in the test cell. The shock waves produce a broadband acoustic spectrum in the acoustic test cell, which can be a reverberant chamber or progressive wave tube.
During random operation, the Air Modulator normally produces a broad band random spectrum that is both smooth and continuous. The spectrum shaping is done in the traditional manner of shaping the input command spectrum up to about 500
0.01 0.1 1 10 100 1000 A ir V a lv e D is p lacem en t ( in ) Frequency (Hz)
Mk VI-3.2 and MK VII-2.2 Air Valve Displacement (in) vs. Frequency (Hz)
Mk-VI Mk-VII Velocity Limit
Acceleration Limit Stroke Limit
Hz, after which the actuator can no longer produce sufficient displacement to modulate the open area of the poppet valve. The spectrum is also influenced to lesser extent by the air pressure, and force with which the poppet valve is held against its seat. The force needed to hold the poppet valve against the seat increases with increasing supply pressure, and this is accounted for with a servo bias applied toward the closed direction. A library of input settings and the resulting acoustic levels is accumulated to assist the operator in attaining a given test condition. The Air Modulator will repeat a given output if all the input parameters are duplicated.
3.3.3 MK-VI and MK-VII Specifications
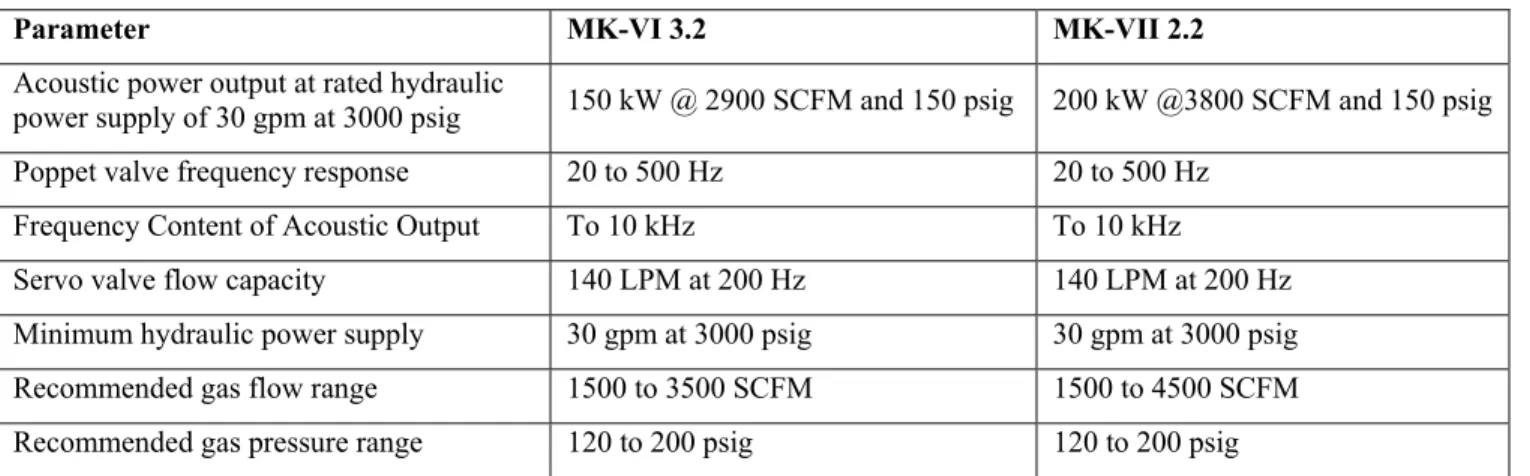
The performance specifications for the MK-VI and MK-VII modulators are summarized in Table 1.
Table 1: Performance Specification of the Team MK-VI and MK-VII Modulators.
Parameter MK-VI 3.2 MK-VII 2.2
Acoustic power output at rated hydraulic
power supply of 30 gpm at 3000 psig 150 kW @ 2900 SCFM and 150 psig 200 kW @3800 SCFM and 150 psig Poppet valve frequency response 20 to 500 Hz 20 to 500 Hz
Frequency Content of Acoustic Output To 10 kHz To 10 kHz
Servo valve flow capacity 140 LPM at 200 Hz 140 LPM at 200 Hz Minimum hydraulic power supply 30 gpm at 3000 psig 30 gpm at 3000 psig Recommended gas flow range 1500 to 3500 SCFM 1500 to 4500 SCFM Recommended gas pressure range 120 to 200 psig 120 to 200 psig
4.0 MODULATOR TEST PROGRAM
The achievable performance such as, power output, spectral shape and amplitude control, for the Team modulators was determined by conducting a series of test programs at the reverberant test chamber at NRC-IAR in Ottawa, Ontario.
The aim of the test programs was to establish the behavior of the Team modulators with different parameters such as modulator gas supply pressure, the character of the broadband random input signal (including the dc bias of the servo-amplifier and the spectral shape), and the pressure of the hydraulic fluid.
The main acoustic parameters of interest were:
• The sound pressure level inside the reverberant chamber (both overall level and spectra); • The acoustic power of the modulators at the horn mouth and at the modulator outlet; and • The spatial variation of the sound inside the chamber.
The details of the test program are presented in this section.
4.1 Test Objectives
The acoustic test objectives can be summarized as follows:
• Determine the quantitative relationship of bias to modulator efficiency, flow, and acoustic output levels with the various horns;
• Demonstrate the repeatability of the modulator’s acoustic performance;
• Demonstrate the controllability of the modulator to generate different spectral shapes by varying pressure, bias, input signal gain, and input signal spectrum; and
• Demonstrate the controllability of the modulator to generate consistent spectral shape output at full level and -6 dB settings.
4.1.1 Dynamic Range
The dynamic range of the modulator was determined as the signal within the test chamber was incremented slowly to the maximum desired specification. Ideally, the dynamic range should be at least -12 dB, with the desire to explore the range between -12 dB and -18 dB. Hence testing was performed with the modulator, whose powers were reduced from 0 to -18 dB in 3 dB increments.
4.1.2 Closed Loop Modulator Testing
The test objectives of Controlled Loop Modulator Testing were:
• Demonstrate that a Team modulator can be adequately controlled via acoustic feedback in a manner similar to other acoustic sound generators.
• Characterize the performance metrics of the Team modulators under closed loop control.
• Provide useful data for later inclusion in a performance specification for competitive bidding of an Acoustic Control System.
Acoustic closed loop testing was initially performed with a single MK-VII Team modulator coupled to the 25 Hz horn and then a single MK-VI Team modulator coupled to the 160 Hz horn in the NRC-IAR Reverberant Test Facility. The in-house NRC-IAR Acoustic Control System was employed with a total of 6 control microphones. For each target spectrum, the optimum bias was applied. The pneumatic pressure was within the range 150 to 175 psig. The closed-loop performance was characterized in terms of response time for each 1/3-octave band (25 Hz to 500 Hz) as well as the steady state error.
4.2 Modulator Hydraulic and Pneumatic Supply
For the characterization tests at the NRC, the hydraulic supply for a single modulator was provided by a MTS 30 gpm pump that was capable of supplying 3000 psig. When dual modulators were tested, a MTS pump rated at 70 gpm at 3000 psig was employed.
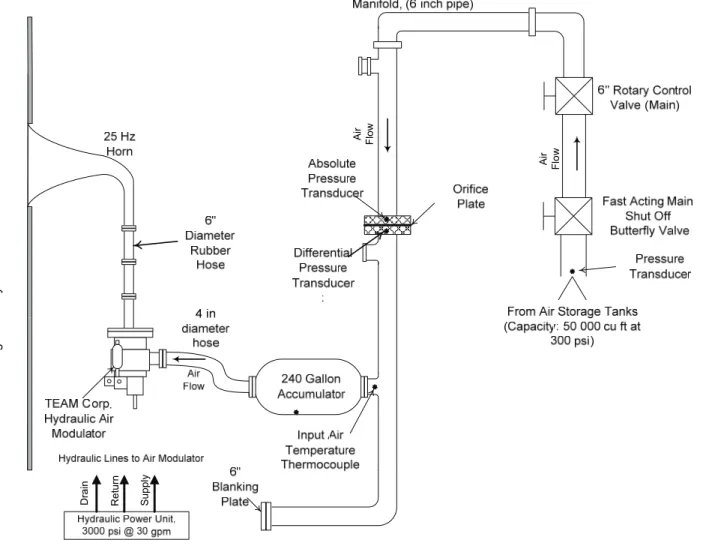
The air supply for the Team modulators is provided by a 8 MW compressor plant that fills three storage tanks with a total capacity of 50,000 ft3 to a pressure of 300 psig. Note that this system is capable of filling the tanks to the aforementioned pressure in approximately 30 minutes. The air supply to the modulator was regulated using a 6” valve and delivered using 6” diameter piping. A 240 gallon accumulator was also placed in-line between the valve and modulator to reduce the pressure fluctuations within the pneumatic supply system. A schematic diagram of the air delivery system is shown in Figure 6.
Figure 6: Schematic of Air Delivery System used in Modulator Testing.
Air Flow Air Flow Hi gh Inte nsi ty Rev e rb eran t Nois e Chamber Dra in Sup p ly Re tu rn
4.3 Data Acquisition Systems
There were two types of data collected namely acoustic and pneumatic/hydraulic data. The acoustic measurements were used to establish the sound power emitted from the modulators, while the principal use of the pneumatic data was to determine process parameters such as temperature, pressure and mass-flow, which were used to determine the efficiency of the modulators. The hydraulic data was mainly used in a monitoring capacity.
As expected, the sampling rate requirement for the two types of data were very disparate; the acoustic data was sampled at 25.6 k-samples/sec, while the process data was sampled at 100 samples/sec. The acoustic data was collected and processed using an LMS Test.Lab system, while a National Instruments/Labview system was used to collect and process the raw pneumatic measurements.
4.4 Acoustic Measurements
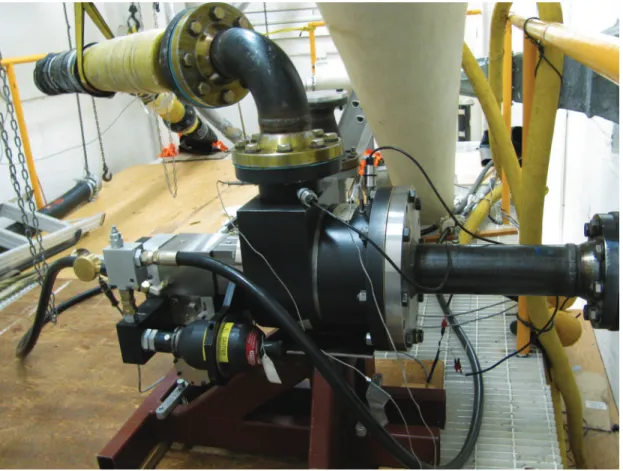
Each of the modulators with its support system and horn adapter was installed inside the horn/modulator room of the NRC test chamber in Ottawa, Ontario. A photograph showing the Team MK-VI modulator during testing at the NRC is shown in Figure 7. The supply gas was dry air at 20°C and was connected to the two modulators through a single T-junction connection. One of the modulators was connected to the 25 Hz horn and the other was connected to either a 100 Hz or 160 Hz horn. Tests were performed with each modulator operating alone on each of the two horns and also with both modulators operating at the same time. The gas pressure to each modulator was the same when two modulators were operating together.
Figure 7: Team MK-VI Modulator during Testing at NRC.
The test process was as follows: the modulator was energized at a single pressure and a broad-band noise signal, set at a particular dc bias and shaped in 1/3 octave bands, was commanded to the servo-amplifier of the modulator to control the modulator valve. The resulting sound pressure level was measured inside the chamber using a minimum of six free field microphones. Time averaged (about 30 seconds) 1/3-octave band spectra were recorded from each of the microphones. The test at the set gas pressure was repeated with several modified 1/3-octave band noise signal inputs to the servo-amplifier. Tests were also performed with a different dc-bias value. The influence of the hydraulic fluid pressure was also evaluated for a few test conditions.
The above test was repeated for six pre-set gas pressures. This test procedure was repeated for a number of different modulator-horn combinations including: MK-VI on a 25 Hz horn, MK-VI on a 100 Hz horn, MK-VII on a 25 Hz horn, and MK-VII on a 100 Hz horn; both single and dual modulator operations were tested.
In addition, the chamber reverberation time was also measured in 1/3 octave bands from 50 Hz to 10,000 Hz and the relative humidity was kept below 5% for the reverberation time tests. The following parameters were recorded for each test condition:
• 1/3-octave band sound pressure levels from each microphone in the test chamber • 1/3
-octave band sound pressure levels from a microphone placed in the horn room • Test chamber pressure
• Test chamber temperature • Chamber air humidity
4.5 Process Measurements
The following quantities also were also measured in order to allow for a complete characterization of the modulator performance:
• Modulator inlet and outlet air pressure • Modulator inlet and outlet air temperature • Modulator hydraulic supply and return pressure • Modulator air mass flow
An orifice plate was installed in the manifold to allow for mass flow measurement during testing. The mass flow, , and volume flow (in Standard ft3 per Minute, SCFM), , are obtained from the orifice plate inlet pressure, , differential pressure across the plate, ∆ , and the air temperature, , as follows:
∆ ∆
, is the gas constant for air, , is the atmospheric pressure, , is the orifice area, and is the discharge coefficient of the orifice plate, which is equal to 0.615. The mass flow computation allows for the evaluation of the air stream to acoustic power efficiency.
4.6 Acoustic Control System
The noise input to the NRC reverberant chamber is controlled using a proprietary acoustic control system, initially developed by NRC in the 1990’s. The current implementation of the control system uses a high performance National Instruments (NI) PXI Embedded Real Time Controller for deterministic real-time operation. The system consists of a NI PXI-1042 chassis equipped with a PXI-8106 embedded controller and three PXI-4461 I/O modules, each of which has a pair of analog input and output channels with 24-bits A/D and D/A convertors. The control algorithm executes on the real time controller (running a real-time operating system, RTOS), while program I/O executes on a regular Windows-based PC. Communications between both computers occurs via an Ethernet connection.
The control target is specified in terms of 1/3-octave band levels from 25 Hz to 2000 Hz. A Gaussian white noise signal is filtered by a bank of octave filters whose attenuation values are controlled by individual feedback control loops. The 1/3-octave filters are implemented in the digital domain using 10th order IIR filters that are ANSI and IEC compliant.
5.0 MODULATOR TEST RESULTS
The present section provides details of the experimental results collected during the test program. These include the modulator characterization tests as well as the closed loop tests.
5.1 Performance Characterization Test Results
In addition to measuring the acoustic output power as a function of various parameters, other aspects of the modulator behavior, including dynamic range, repeatability, and the effect of signal spectral properties were also evaluated.
5.1.1 Acoustic Power Output
The total modulator acoustic power was calculated from the averaged chamber sound pressure levels, the measured chamber reverberation time values and the various adjustment factors that are described below. The acoustic power level at the horn mouth, denoted as is given by the following equation:
where is the averaged chamber sound pressure levels, is total surface area including adjustments for vents and horns; is the wall absorption coefficient, computed from the chamber reverberation time values, is chamber volume and is the air absorption coefficient of the chamber. The acoustic power level of the modulator, denoted as is related to by the following relationship:
log(ε) + Wall corner effects + Spill over + Horn Efficiency
where ε is the coupling efficiency, defined as / , where is the Modal overlap Index, with Δ. is the Modal density and Δ is the half power-pass band. The correction for wall corner effects is given by [5]:
Wall Corner Effects log /8
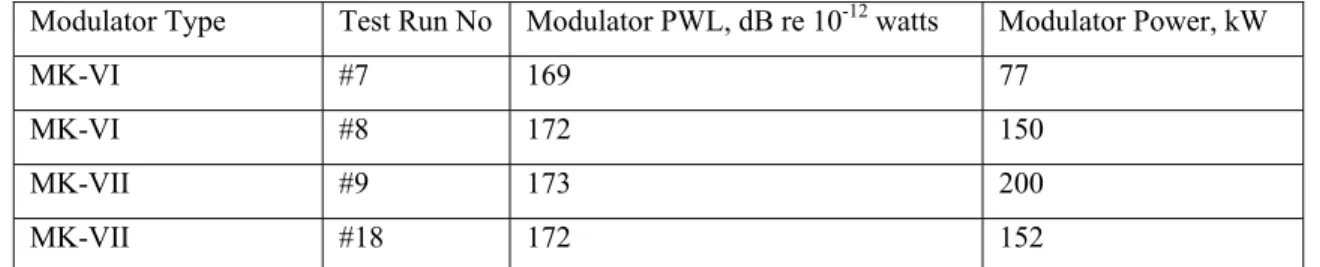
The spill-over loss is assumed to be 0.2 dB, based on typical values. The horn efficiency is assumed to be 30% for a typical exponential horn (the efficiency is usually between 30 and 35%). The acoustic powers of the modulator for typical test runs are shown in Table 2 below.
Table 2: The Sound Power Output of Team Modulators
Modulator Type Test Run No Modulator PWL, dB re 10-12 watts Modulator Power, kW
MK-VI #7 169 77
MK-VI #8 172 150
MK-VII #9 173 200
MK-VII #18 172 152
The results of Table 2 clearly shows that the Team modulators are capable of producing 150 kW (MK-VI modulator) and 200 kW (MK-VII modulator) as advertised. Note that cases that yielded less than the maximum modulator power corresponded to non-optimal servo bias, input spectra and/or gas supply pressure settings.
5.1.2 MK-VI Modulator General Behavior
For the tests described in this section, the MK-VI modulator was coupled to a 100 Hz horn. The MK-VI is designed to have improved higher frequency performance, which inherently sacrifices its low frequency behavior.
A number of different input signals were applied to the modulator: a) A flat white noise spectrum from 80 Hz to 800 Hz;
b) Several spectra obtained by shaping the flat 80 Hz to 800 Hz spectrum; c) Individual 1/3-octave band or octave band signals.
The key acoustic results obtained for the MK-VI modulator are presented in Figure 8. The effect of modulator output with supply pressure is shown in Figure 8 (a). Between 125 and 225 psig, the supply pressure has a negligible effect on the acoustic output of the modulator. Note that for the cases in Figure 8(a), the shape of the input spectra was white noise between 80 Hz and 800 Hz. The effect of the spectral shapes of the input signal is shown in Figure 8 (b). The results show that the shaping of the input signal is reflected in the shape of the output spectra, indicating a high degree of spectral controllability. These results also illustrate the affect of the 100 Hz horn characteristics on the output for a flat white noise spectrum.
The effects of applying input noise exclusively within a single 1/3-octave band are shown in Figure 8 (c) and (d), where noise is contained only within the 100 Hz and 250 Hz bands, respectively. In each case, two signal gain values, as indicated in the figure legends, are applied. These results suggest that the desired modulator output spectra and levels can be readily obtained by adjusting the input spectra shape and levels. This again demonstrates that the modulator exhibits good controllability characteristics. This aspect will be examined in greater detail later in this paper. The repeatability of the Team MK-VI modulator was evaluated simply by repeating measurements with identical input spectra, gas supply pressure and the servo bias settings. In many cases, the repeated measurements were conducted on different days. In all cases the repeatability was excellent. Figure 8 (e) and (f) shows two such cases.
(a) Effect of Supply Pressure (b) Effect of Signal Shape
(c) Effect of Signal Gain and Signal Shaping, case 1 (d) Effect of Signal Gain and Signal Shaping, case 2
(e) Repeatability Test, trial 1 (f) Repeatability Test, trial 2
Figure 8: The behavior of MK-VI Modulator.
5.1.3 MK-VII Modulator General Behaviour
With the MK-VII modulator coupled to a 25 Hz horn, a few different combinations of the input signal were also applied:
100 105 110 115 120 125 130 135 140 145 150 32 40 50 63 80 100 125 160 020 250 315 400 500 630 800 1, 00 0 1, 25 0 1, 60 0 2, 00 0 2, 50 0 3, 15 0 4, 00 0 5, 00 0 6, 30 0 8, 00 0 10, 00 0 B a n d SP L, dB
1/3 Octave Band Centre Freqeuncy, Hz Run 68- 200 psi; Bias -1.32
Run 70- 175psi; Bias -1.02 Run71 - 150 psi; Bias -0.81 Run 72 - 125 Psi; Bias -0.63 Run 73 - 104 Psi; Bias -0.44 Run 66 - 224 psi; Bias -1.38
100 105 110 115 120 125 130 135 140 145 150 32 40 50 63 80 10 0 12 5 16 0 20 0 25 0 31 5 40 0 50 0 63 0 80 0 1, 0 00 1, 2 50 1, 6 00 2, 0 00 2, 5 00 3, 1 50 4, 0 00 5, 0 00 6, 3 00 8, 0 00 10 ,0 0 0 B a n d SP L, dB
1/3 Octave Band Frequency, Hz Flat 80-880 Hz Flat 80-500 Hz Special 7 Special 8 Special 9 Special 10 100 105 110 115 120 125 130 135 140 145 150 155 160 32 40 50 63 80 100 125 160 020 250 315 400 500 630 800 10 00 12 50 16 00 20 00 25 00 31 50 40 00 50 00 63 00 80 00 10 000 B a nd S P L, dB
1/3 Octave Band Centre Frequency, Hz Run 100 - Gain 39 Run 101 - Gain 33 120 125 130 135 140 145 150 32 40 50 63 80 100 125 160 020 250 315 400 500 630 800 1 000 1250 1600 2000 2500 3150 4000 5000 6300 8000 1 000 0 B a nd S P L, dB
1/3 Octave Band Centre Frequency, Hz Run 105 - Gain 39 dB Run 104 - Gain 36 dB 115 120 125 130 135 140 145 150 32 40 50 63 80 100 125 160 200 250 315 400 500 630 800 1, 000 1, 250 1, 600 2, 000 2, 500 3, 150 4, 000 5, 000 6, 300 8, 000 10 ,0 00 B a n d SPL , d B
1/3 Octave Band Frequency, Hz Run 124 Run 98 115 120 125 130 135 140 145 150 32 40 50 63 80 100 125 160 200 250 315 400 500 630 800 1, 000 1, 250 1, 600 2, 000 2, 500 3, 150 4, 000 5, 000 6, 300 8, 000 10 ,0 00 B a n d SPL , d B
1/3 Octave Band Frequency, Hz
a) A flat spectrum from 25 Hz to 800 Hz;
b) Several spectra obtained by shaping the flat 25 Hz to 800 Hz spectrum; c) Individual 1/3-octave band or octave band signals.
Compared to the MK-VI, the MK-VII was typically tested with input signals that had greater energy content in the low frequency range to exploit its frequency response range. The effect of supply pressure on the performance is shown in Figure 9 (a). These results show that at and above a supply pressure of approximately 115 psig, the acoustic output of the MK-VII modulator is essentially invariant with pressure. The case shown with a low acoustic output is the result of an extremely low supply pressure, well below the rated minimum supply pressure of 120 psig. The variation of the output power spectrum with input signal spectrum is shown in Figure 9(b). In particular the additional energy content in the bands from 100 to 800 Hz is clearly visible when the corner frequency of the input signal is increased from 100 Hz to 800 Hz. Spectra 2 and 4 attenuate the baseline input spectrum (flat to 800 Hz) beyond 100 and 400 Hz by 3 dB per octave, and the effects are seen accordingly in the output spectra.
The combined effect of signal gain and narrowband performance is shown in Figure 9 (c) and (d). In the former case, input energy is only contained within the 50 Hz 1/3-octave band. Apart from some spill-over in the 100 Hz band, the output power is concentrated within the 50 Hz band. Furthermore, the effect of the input gain appears at the output in a linear fashion. The same can be said when the energy is contained within the 200 Hz 1/3-octave band, as shown in Figure 9 (d). The repeatability of the MK-VII is exemplified by the results shown in Figure 9 (e) and (f) for two representative cases.
(a) Effect of Supply Pressure (b) Effect of Signal Shape
(c) Effect of Signal Gain and Signal Shaping, case 1 (d) Effect of Signal Gain and Signal Shaping, case 2
100 105 110 115 120 125 130 135 140 145 150 32 40 50 63 80 100 125 160 020 250 315 400 500 630 800 10 00 12 50 16 00 20 00 25 00 31 50 40 00 50 00 63 00 80 00 10 000 B a n d SPL , d B
1/3 Octave Band Centre Frequency, Hz Run 18-200psi Run 29-167psi Run 22-63psi Run 21-115psi
100 105 110 115 120 125 130 135 140 145 150 32 40 50 63 80 100 125 160 020 250 315 400 500 630 800 1, 00 0 1, 25 0 1, 60 0 2, 00 0 2, 50 0 3, 15 0 4, 00 0 5, 00 0 6, 30 0 8, 00 0 C ha m be r B a nd SPL , dB
1/3 Octave Band Centre Frequency, Hz Spectrum 2 Flat to 100 Hz Spectrum 4 Flat to 800 Hz 100 105 110 115 120 125 130 135 140 145 150 155 32 40 50 63 80 100 125 160 020 250 315 400 500 630 800 10 00 12 50 16 00 20 00 25 00 31 50 40 00 50 00 63 00 80 00 10 00 0 B a n d SPL , d B
1/3 Octave Band Centre Frequency, Hz Run 50 - Gain 27; 50 Hz Gain = +6 dB Run 51 - Gain is 27; 50 Hz gain = +3 dB
100 105 110 115 120 125 130 135 140 145 150 32 40 50 63 80 100 125 160 020 250 315 400 500 630 800 10 00 12 50 16 00 20 00 25 00 31 50 40 00 50 00 63 00 80 00 10 00 0 B a nd S P L, dB
1/3 Octave Band Centre Frequency, Hz Run 55 - Gain +3 dB
(e) Repeatability Test, trial 1 (f) Repeatability Test, trial 2
Figure 9: The behavior of MK-VII Modulator.
5.1.4 MK-VI Modulator Dynamic Range
The achievable dynamic range of a modulator is an important parameter that contributes to the complexity of the modulator layout required during a test program. A test program for a given test article invariably consists of testing to a series of spectral targets ranging from 15 dB below flight levels to in some cases several dB above. If a given modulator does not have sufficient dynamic range, a number of modulator configurations employing a varying number of modulators is required to encompass the range of spectral targets; the lower the dynamic range of a given modulator, the greater the number of required configurations.
Three spectral shapes were applied to characterize the dynamic range of the modulator. The results are shown in Figure 10 for two of the spectral shapes. The key observation is that the dynamic range that can be obtained for the MK-VI modulator is between 6 and 9 dB. Note that the dynamic range was found to be dependent on the input signal spectral shape.
Figure 10: The Dynamic Range of MK-VI Modulator.
5.1.5 MK-VII Modulator Dynamic Range
Three spectral shapes were also applied to test the dynamic range of the modulator, and the results are shown in Figure 11 for two input spectral shapes. For the MK-VII modulator, the dynamic range is between 9 and 12 dB. As was the case with the MK-VI, the measured dynamic range is dependent on the spectral shape of the input signal.
120 125 130 135 140 145 150 32 40 50 63 80 100 125 160 020 250 315 400 500 630 800 1 000 1250 1600 2000 2500 3150 4000 5000 6300 8000 1 000 0 B a n d SPL , d B
1/3 Octave Band Centre Frequency, Hz
Run 62 Run 25 100 105 110 115 120 125 130 135 140 145 32 40 50 63 80 100 125 160 200 250 315 400 500 630 800 1000 1250 0016 2000 2500 3150 4000 5000 6300 8000 1 000 0 B a n d SPL , d B
1/3 Octave Band Centre Frequency, Hz Run 61 Run 35 80 85 90 95 100 105 110 115 120 125 130 135 140 145 150 32 40 50 63 80 10 0 12 5 16 0 20 0 25 0 31 5 40 0 50 0 63 0 80 0 1, 00 0 1, 25 0 1, 60 0 2, 00 0 2, 50 0 3, 15 0 4, 00 0 5, 00 0 6, 30 0 8, 00 0 B a n d SPL , d B
1/3 Octave Band Centre Frequency, Hz Gain 34 dB, OASPL 153.5 dB Gain 31 dB, OASPL 150.9 dB Gain 28 dB, OASPL 147.4 dB Gain 25 dB, OASPL 140.2 dB Gain 22 dB, OASPL 127.8 dB 80 85 90 95 100 105 110 115 120 125 130 135 140 145 150 32 40 50 63 80 100 125 160 020 250 315 400 500 630 800 1, 0 00 1, 2 50 1, 6 00 2, 0 00 2, 5 00 3, 1 50 4, 0 00 5, 0 00 6, 3 00 8, 0 00 B a n d SPL , d B
1/3 Octave Band Centre Frequency, Hz Gain 35 dB, OASPL 152.7 dB Gain 32 dB, OASPL 149.8 dB Gain 29 dB, OASPL 144.8 dB Gain 26 dB, OASPL 136.2 dB
Figure 11: The Dynamic Range of MK-VII Modulator.
5.2 Controllability Test Results
The closed loop control for reverberant chamber acoustic spectrum control essentially involves applying an array of feedback loops to control the attenuation values of a bank of 1/3-octave filters. In typical control operations, the initial attenuation factors for each 1/3-octave frequency band would be pre-determined during an empty chamber calibration test to allow for quick convergence once the test article is placed in the chamber.
Since the initial attenuation factors were not known a priori for each test spectrum, the current control testing is to be considered as calibration mode testing, where large attenuation factors were used to begin the test. The above process was applied so that the noise levels do not overshoot the target sound levels. Five spectral shapes, each scaled to meet the achievable overall sound pressure levels in the NRC chamber with a single Team modulator, were used for the testing. Furthermore, the controllable frequency range for the chosen shape was adjusted to be within the operational rangeof the chosen modulator-horn combination. For example, the controllable range for the MK-VII on the 25 Hz horn is 31.5 Hz to 500 Hz. Similarly, the controllable range for the MK-VI on the 160 Hz horn is 125 Hz to 500 Hz.
The following process was applied:
• one of the chosen spectra was applied to the controller with the attenuators set at 100 dB below the target levels • the controller was started
• the modulator takes a few seconds to initiate and once initiated it quickly rises to meet the target. • The average of six microphone signals was used as the control parameter.
The time signals of all the microphones as well as the control signal, i.e., the six-microphone average, were recorded for at least two minutes after stabilization of the overall signal.
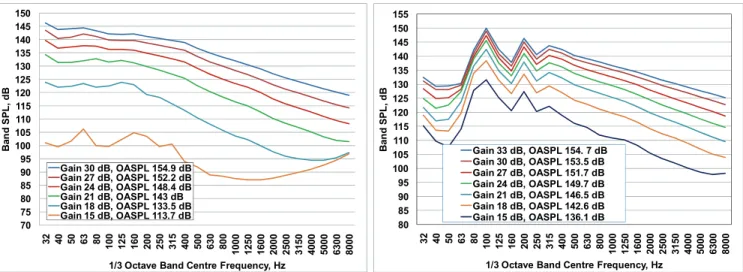
5.2.1 MK-VI Modulator Controllability
The results of the closed loop control tests for the MK-VI on the 160 Hz horn are presented as a time history to evaluate the rise time as well as the steady state statistics after the signal stabilizes to the set target. The average, standard deviation, deviation to maximum point, and deviation to minimum point were evaluated from the point of stabilization to the end of recording of that test. The results are shown in Figure 12 for one of the spectra tested.
For this specific closed loop test, the rise time is in the range of 25 to 35 seconds. Note: these rise times only represent those expected during initial empty chamber tests for a given spectrum. Once the appropriate attenuation factors are then applied for the actual test, these rise times would be reduced. The signal is seen to be reasonably steady with the standard error of one dB or less for most cases.
70 75 80 85 90 95 100 105 110 115 120 125 130 135 140 145 150 32 40 50 63 80 100 125 160 020 250 315 400 500 630 800 10 00 12 50 16 00 20 00 25 00 31 50 40 00 50 00 63 00 80 00 B a n d SP L, dB
1/3 Octave Band Centre Frequency, Hz Gain 30 dB, OASPL 154.9 dB Gain 27 dB, OASPL 152.2 dB Gain 24 dB, OASPL 148.4 dB Gain 21 dB, OASPL 143 dB Gain 18 dB, OASPL 133.5 dB Gain 15 dB, OASPL 113.7 dB 80 85 90 95 100 105 110 115 120 125 130 135 140 145 150 155 32 40 50 63 80 10 0 12 5 16 0 20 0 25 0 31 5 40 0 50 0 63 0 80 0 100 0 125 0 160 0 200 0 250 0 315 0 400 0 500 0 630 0 800 0 B a n d SPL , d B
1/3 Octave Band Centre Frequency, Hz Gain 33 dB, OASPL 154. 7 dB Gain 30 dB, OASPL 153.5 dB Gain 27 dB, OASPL 151.7 dB Gain 24 dB, OASPL 149.7 dB Gain 21 dB, OASPL 146.5 dB Gain 18 dB, OASPL 142.6 dB Gain 15 dB, OASPL 136.1 dB
Figure 12: Closed Loop testing of MK-VI Modulator
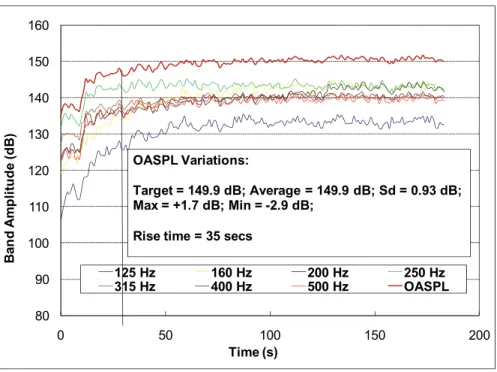
5.2.2 MK-VII Modulator Controllability
The results of the closed loop control tests for the MK-VII on the 25 Hz horn are presented as a time history to evaluate the rise time as well as the basic statistics after the signal stabilizes to the set target. The average, standard deviation, deviation to Maximum point, and deviation to Minimum point were evaluated from the stabilization point to the end of recording of that test. The results are shown in Figure 13 for one of the spectra tested.
Once again, the rise time is in the range of 25 to 35 seconds and as was the case with the MK-VI, these are the rise times from a large attenuation initial state. Calibration runs will be employed to determine appropriate initial conditions for the controller to facilitate a much quicker response time. The steady state performance of the MK-VII in this case is slightly improved over the case presented for the MK-VI earlier.
Figure 13: Closed Loop testing of MK-VII Modulator
80 90 100 110 120 130 140 150 160 0 50 100 150 200 Ban d Amp li tu d e (d B) Time (s) 125 Hz 160 Hz 200 Hz 250 Hz 315 Hz 400 Hz 500 Hz OASPL OASPL Variations: Target = 149.9 dB; Average = 149.9 dB; Sd = 0.93 dB; Max = +1.7 dB; Min = -2.9 dB;
Rise time = 35 secs
80 90 100 110 120 130 140 150 160 0 50 100 150 200 Ban d Amp li tu d e (d B) Time (s) 31.5 Hz 40 Hz 50 Hz 63 Hz 80 Hz 100 Hz 125 Hz 160 Hz 200 Hz 250 Hz 315 Hz 400 Hz 500 Hz OASPL OASPL Variations: Target = 151.0 dB; Average = 150.4 dB; Sd = 0.6 dB; Max = +1.65 dB; Min = -1.9 dB
6.0 CONCLUSIONS
An operational need for the design and development of a very large reverberant acoustic test facility at NASA Glenn Research Center with an extremely high acoustic power requirement necessitated the careful examination of the acoustic output power of available noise generators. Two models of modulators supplied by Team Corporation appeared to have the necessary acoustic output and frequency characteristics. However, a detailed characterization of these modulators was necessary to mitigate the risk of the proposed chamber design. Consequently, a series of test programs were performed that in addition to characterizing the generated noise, also examined the controllability, dynamic range and the optimal performance region of the modulator.
The test program was performed at the NRC-IAR reverberant chamber, located in Ottawa, Ontario, Canada and demonstrated that the modulators were capable of producing their rated acoustic power (150 kW for the Team MK-VI and 200 kW for the MK-VII), and had a dynamic range of between 6 and 9 dB for the MK-VI, and between 9 and 12 for the MK-VII. Furthermore, both modulators exhibited excellent repeatability and sufficiently controllability to allow for their control via currently available acoustic control systems.
7.0 ACKNOWLEDGEMENTS
The authors would like to acknowledge the contribution of their colleagues during the test program. In particular the NRC authors would like to thank Luc Hurtubise, Brent Lawrie, Viresh Wickramasinghe, David Zimcik, Sebastian Ghinet and Manouchehr Nejad-Ensan for their effort during the various test phases. Aiolos Engineering Corp would like to thank the engineering team members of Aiolos and Benham, headed up by Ralph Leitner and Neil Waggoner, respectively, for their many contributions to making this test program happen. The NASA author would like to acknowledge the NASA SET Project Office for their support and funding for this test program. He would also like to acknowledge the extensive and valuable engineering test support provided by Aron Hozman, Anne McNelis, and Mark McNelis from NASA GRC, and Dr. Jerome Manning and Dr. Patricia Manning from Cambridge Collaborative Incorporated. Team would like to acknowledge and thank Bob Tauscher from Team and Neil Waggoner from Benham.
8.0 REFERENCES
1. Hughes, W,O., McNelis, M.E., Hozman, A.D., and McNelis, A.M., “Status and Design Features of the new NASA GRC Reverberant Acoustic Test Facility (RATF)”, Proceedings of the 2010 IEST Annual Technical Meeting, ESTEC 2010, 3-6 May 2010, Reno, NV, USA.
2. Otten, K.D., Suarez, V.J. , and Le, D.K., “Status and Design Features of the new NASA GRC Mechanical Vibration Facility (MVF)”, Proceedings of the 2010 IEST Annual Technical Meeting, ESTEC 2010, 3-6 May 2010, Reno, NV, USA.
3. Hughes, W.O., McNelis, M.E., Hozman, A.D., McNelis, A.M., “The Testing Behind the Test Facility: The Acoustic Design of the NASA Glenn Research Center’s World-Class Reverberant Acoustic Test Facility”, NASA/TM-2010-216802, October 2010.
4. Fiala, W.T., Hilliard, J.K., Renkus, J.A., Van Houten, J.J., “Electropneumatic Acoustic Generator”, Journal of the
Acoustical Society of America, Volume 38, Issue 6, pp. 956-964, December 1965.