HAL Id: hal-02353972
https://hal.archives-ouvertes.fr/hal-02353972
Submitted on 7 Nov 2019
HAL is a multi-disciplinary open access
archive for the deposit and dissemination of
sci-entific research documents, whether they are
pub-lished or not. The documents may come from
teaching and research institutions in France or
abroad, or from public or private research centers.
L’archive ouverte pluridisciplinaire HAL, est
destinée au dépôt et à la diffusion de documents
scientifiques de niveau recherche, publiés ou non,
émanant des établissements d’enseignement et de
recherche français ou étrangers, des laboratoires
publics ou privés.
Estimation of the light output power and efficiency of a
XeCl dielectric barrier discharge exciplex lamp using
one dimensional drift-diffusion model for various voltage
waveforms
Doanh Le Thanh, Sounil Bhosle, Georges Zissis, Hubert Piquet
To cite this version:
Doanh Le Thanh, Sounil Bhosle, Georges Zissis, Hubert Piquet. Estimation of the light output power
and efficiency of a XeCl dielectric barrier discharge exciplex lamp using one dimensional drift-diffusion
model for various voltage waveforms. 2011 IEEE Industry Applications Society Annual Meeting, Oct
2011, Orlando, United States. pp.1-8, �10.1109/IAS.2011.6074369�. �hal-02353972�
OATAO is an open access repository that collects the work of Toulouse
researchers and makes it freely available over the web where possible
Any correspondence concerning this service should be sent
to the repository administrator:
[email protected]
To cite this version:
Le, T. Doanh and Bhosle, Sounil and Zissis, Georges and Piquet,
Hubert Estimation of the light output power and efficiency of a XeCl
dielectric barrier discharge exciplex lamp using one dimensional
drift-diffusion model for various voltage waveforms. In: 2011 IEEE Industry
Applications Society Annual Meeting, 9-13 October 2011 (Orlando,
United States)
This is an author’s version published in: http://oatao.univ-toulouse.fr/
23407
Estimation of the light output power and efficiency of aXeCI dielectric barrier
discharge exciplex lamp using one dimensional drift-diffusion model for various
voltage waveforms
T. DoanhLE
Dr
Laboratoire LAPLACE Universite Paul Sabatier,
I 18 Route de Narbonne, 31062 Toulouse, France [email protected]
Sounil BHOSLE
Dr. OLISCIE 175, chemin de la Pielle 31600 Lherm, France [email protected]Abstrat: A XeCI dielectric barrier discharge under applied
pulsed and sinusoidal voltage waveforms is simulated using a one dimensional drift diffusion model. In both waveforms, the light output depends not only on the gas mixture composition but also on the electrical parameters of the voltage waveform such as the frequency, the duty ratio ... ctc. At the same amplitude of the voltage and the frequency, the UV output efficiency of the pulsed voltage is higher than the one of sine voltage. These results obtained in this paper allow to find out an appropriate power supply mode for a DBD excilamp.
Index Terms: Dielectric barrier discharge; Excimer;
Exciplex, excilamp; Ultra-violet; UV radiation; VUV radiation
I. INTRODUCTION
An exciplex lamp operated using dielectric barrier discharges (DBDs) is one of the most powerful ultra-violet (VUV or UV) light sources. In recent years, the DBD UV light sources have been widely used in several industrial applications as well as in lighting and medical technology.
A primary feature of the excilamp is that the dielectric barrier suppresses the occurrence of an arc discharge and the damages to the metallic electrodes. Furthermore, the lamp can provide various wavelengths of narrow band UV light.
Depending on the gas composition and conditions under which an electric discharge occurs, excited molecules are produced by different mechanisms (the harpoon reaction and ion-ion recombination) with characteristic radiative life time
of 10-7 _1O-9s. Spontaneous decay of excimer and exciplex
molecules into individual atoms is accompanied by emission of a UV light. In this UV field, dielectric barrier discharges in rare gas or halide/rare gas mixtures are promising. These discharges are usually made of a silica gas chamber, including the gas or gas mixture at a pressure between 1Q4Pa and 1Q5Pa, with outer electrodes. Up to now, a number of research groups have in detail investigated UV light emission from exciplex excited using DBD plasma experimentally [10][5][6][13]. They reported that the experimental values of the UV light output efficiency were around 15% although the
Georges ZISSIS
Professor Laboratoire LAPLACE Universite Paul Sabatier,I 18 Route de Narbonne, 31062 Toulouse, France [email protected]
Hubert PIQUET
Professor Laboratoire LAPLACE Universite Paul Sabatier, 2 Rue Charles Camichel, 31071 Toulouse, Francetheoretical ones may be several tens of percent.
Xenon/Chlorine excilamps are used in skin treatment: such a gas mixture has very interesting specificity as it emits almost exclusively in the UVB range (280nm-315nm). This radiation affects the immune system and has an especially high efficiency for curing affectations due to the over activity of this system, such as psoriasis and vitiligo.
In the present paper, in order to find out optimum voltage waveforms for further improvement of the excilamp characteristics, we take pulse and sinusoidal waveforms for source voltage. We simulate XeCI DBD plasma using a one dimensional drift diffusion model in which the approximation of the local electrical field has been applied.
Basing on this developed model, we compare the dependence of the UV light output power and efficiency of the XeCI excilamp on the applied pulse and sinusoidal voltage waveforms. The influence of the waveform parameters of both voltages such as the frequency, the duty ratio, the rising time of a pulse voltage and also the gas composition such as the ratio of chlorine and the total pressure on the production of the UV have been investigated in detail.
II. MODELING
A. Drift diffusion model
The gas pressure in which the discharge is established is in the case of DBDs for UV production, between 103 and 105Pa, which makes that plasma strongly collisionnal. In those conditions, the directed energy of the particles can be neglected compared to their random motion energy (thermal energy). This collisional behavior causes the temporal variations of the studied variables (densities, fluxes, temperatures . . . ) to be much lower than the momentum exchange frequency by collision. This leads to strong simplifications of the momentum conservation equation. With additional approximations (scalar pressure, etc . . . ), the flux of particles can be written:
(1) With: qs: elementary charge of the specie s
ns: density of the specie s. It depends on the position r and the time t
lis: mobility of the species
Ds: diffusion coefficient of the specie s
E
: Electrical fieldThe first term on the left of the equation is related to the electrical field which corresponds to the drift motion of the particles (provided they have a charge). The second one corresponds to the diffusion motion which is a collisional effect which tends to uniformize the density. Including the expression of that flux in the mass conservation equation leads to the following drift -Diffusion equation:
an - -
-atS + V.( -Os Vns ± !-lsns VV) = Ss (2)
With: V: electrostatic potential Ss: source term for the specie s
In spite of the previous simplifications, the system made of the coupling of the equation 2 written for all species considered in the plasma is still not closed. Indeed, some variables are still undefined.
In order to get rid of the indetermination of the electrical field, Poison's equation can be coupled to the system but a further approximation is needed to get the transport coefficient lis and Ds·
B. Approximation of the local field
The energy gained by electrons in the electrical field during an infinitesimal lapse of time is assumed exactly balanced by their collision energy losses. This is valid for a plasma in which the electrons have a collision frequency high enough to be in equilibrium with the electrical field. In that case, their distribution function only depends on the local electrical field
�
(where N is the density of all gas atoms).N
Consequently, the collision frequencies, the mobilities and the diffusion coefficients depend as well exclusively on the electrical field.
One important implication of using the local field approximation is that the energy balance equation is not computed, reducing significantly computing resources. The counter part is that powers (radiatives and electric) are not quantitatively computed. This explains the sums of radiative efficiencies above 1 in section D. However, the optimal points are conserved, which is the focus of this work dedicated to the identification of optimal parameters for a DBD excilamp power supply.
III. GOVERNING EQUATION
Basing on the previous approximations, the phenomena of the plasma in the mixture of xenon and chlorine IS
governed by the following closed equation system (3).
This system contains a Poison's equation coupled to as many equations of all species considered in ours discharge. The subscript e, i+ and i" represent the electrons, the positive ions and the negative ions.
V (-£VV)=e(n. -n -no ). 1+ e
1-an - -
-a
;
+ V.( -De Vne ± !-lene VV) = Sean - -
-a
�
+ + V.( -Di+ Vni+ + !-li+ni+ VV)= Si+ (3)an - -
---'=-+ V.(-D Vn +" n VV) = S
at 1- 1- t""1- 1-
1-After all those approximations, the studied plasma is governed by a coupled Partial Differential Equation (PDE) system which can be numerically solved on a spatial domain o limited by a surface ao provided:
The values of the transport coefficients (motilities, diffusion coefficients) and the source terms are known as a function of the local electrical field. The boundary conditions are clearly defined included.
A. Boundary conditions for the species s
The boundary conditions for all species considered in our model such as electrons, positive and negative ions and the excited atoms or molecules are the same as those in our previous paper [Bh-l ].
B. Boundary condition for Poison's equation
The continuity of the potential involves a constraint on the metallic electrodes on the outside face of the dielectrics (Dirichlet conditions). This kind of boundary condition allows us to define the applied voltage on the DBD. For example, if the DBD is applied with a sine or pulse wave form at 50 kHz and with maximum amplitude of 8kV, the boundary condition will be:
Electrode 1: V = 0
Electrode 2: V = 8000sin(2n.50xl 03t).
c. Reaction processes and coefficient transport
The reaction processes among electrons, positive and negative ions of xenon and chlorine, excited atoms of xenon and chlorine are took from the literature [4],[7],[8],[9],[11], [12] et [14]. The frequency of collision and the coefficient of direct ionization for chlorine and xenon are calculated by the software of Bolsig+ [3].
The coefficient of absorption, desorption and recombination on the dielectric surface are the following values:
Kadse = Kadsi-= Kadsi+=
1012 (S-l),Kdes
= 107 S-l andKrec
= 1 0-12m3 .S-l.IV. RESULTS AND DICUSSION
A. Geometry of the model
The model is solved in a geometry corresponding to [2] and [12], which means a homogeneous discharge between two plane electrodes covered with the dielectrics (with a relative permittivity equal to 4, which approximately corresponds to the silica glass). The model can be numerically solved in l O using the software Com sol Multiphysics. The figure 1 presents the discharge geometry and associated resolution domains. The resolution domain for all the species considered is between two points B and C, which corresponds to the discharge domain.
The inter -electrode space (discharge volume) is filled with the mixture of Xenon/chlorine at total pressure of 400Torr and the mixture ratio ofXe/Cb = 97:03.
0 A Figure 1. domain Metal electrodes -,- -- ,-2.1003 B Discharge To the voltage generator . Discharge gap x o.cJOt.... 0.008 0.006 (Dimensions in m) 6.1003 8.1003 x (m) C D
geometry and associated resolution
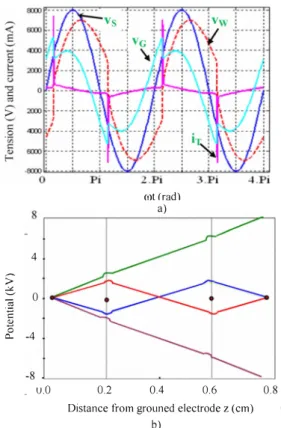
B. Waveform of voltage and discharge current
Figure 2 shows the following waveforms; vs(t), the power source voltage; vw(t) the voltage between the barriers; vG(t), the voltage in the gap and iT(t), the density current in the periodic steady state. It is shown that vw(t) is a major component in vs(t). The vw(t) waveform is similar to a sinusoidal wave, however, it increase rapidly at cot = 0,14n and drops at cot = 1, 14n due to the appearance of sharp spikes in iT (t). On the contrary the vG(t) waveform is distorted
considerably, with two peaks at cot = 0,12n and cot = 1, 12n and its fundamental wave leads vs(t) by 0,28n. At cot corresponding to the VG peaks, sharp spikes in the iT(t) waveform appear, since the electron multiplication starts in the vicinity of the anode (see A and C in figure 9) and extends to the cathode (see B and 0 in figure 9). The iy(t) phase leads vs(t) by 0,35n and vG(t) by 0,17n. This relation represents that this discharge is capacitive.
The spatial distribution of the potential at cot = 0.5n, n, 1.5n and 2n are shown in figure 2 (b). The voltage drops of the grounded and powered side barriers are equal at any phase, since the same barriers are utilized for both electrodes.
wt (rad) a) 8 r---r---,---=..---, 4 ;> 6 0 � E .s 0 -4 Q.. -8 u.o 0.2 0.4 0.6 0.8
Distance from grouned electrode z (cm)
b)
Figure 2: (a) Temporal variations of the source voltage vs(t), voltage in the gap vG(t), voltage between the barriers vw(t) and total current iT(t) under sine voltage waveform with f =50kHz, total pressure =400Torr, rate of mixture Xe/Cb =97:03,
Vs
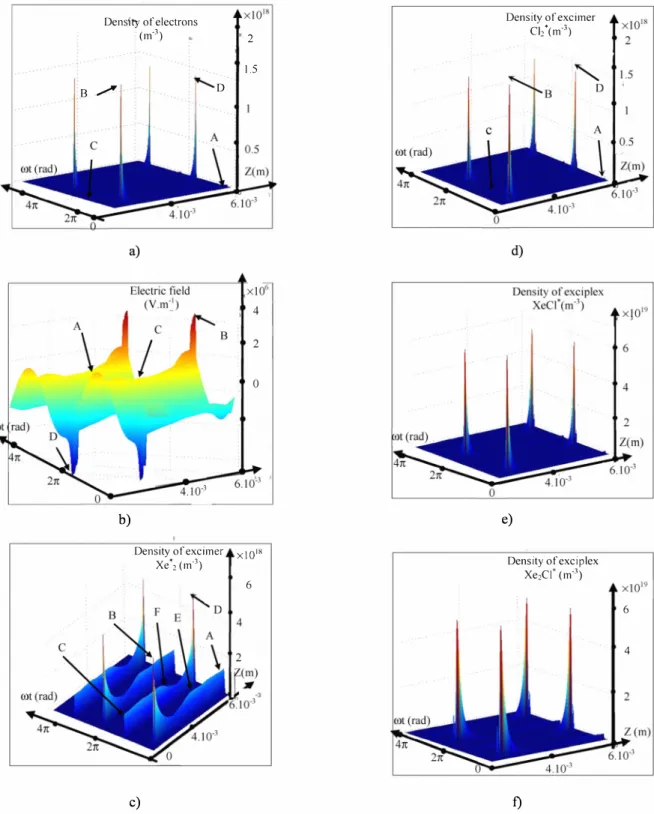
= 8kV; (b) Potential distributions between the electrodes for cot = 0,5n, n, 1.5n and 2n. Here the vertical lines at z=0.2cm and 0.6cm represent the barrier surfaces.C. Spatia-temporal profiles the discharge plasmas Figure 3 shows spatio - temporal profiles of (a) the electron concentration ne(z,t), (b) the electric field strength E(z,t), (c, d) the excimers concentration of Cl*2 and Xe*2
eI:+u),
and (e, t) the exciplexes concentration of XeCI* and Xe2C!* for the sine waveform.Density of electrons (m-3) . .' . .' B ./ b) 2 1.5 D Density of excimer x I 0'8 Xe'2 (m-3) 6 c) Density of excimer Cb'(m-3) e) Density of exciplex Xe2CI' (m-3) t) 6 4
Figure 3. Spatio-temporal profiles of (a) the electron concentration ne, (b) the electric field strength E, (c, d) the C(2, Xe*2
ez:+u)
excimers concentrations, and (e, t) the XeC)*, Xe2C1* exciplexes concentration for the sine waveform with the maximal amplitude of8kV,
frequency= 50kHz,
total pressure= 400Torr and the mixture rate of Xe/Cb =Figures 3(a) shows that two peaks in Ile indicated by B and D appear at each a half cycle because of the electron multiplication. The ne peaks appear always on the instantaneous cathode side defined by the polarity of Vo shown in figure 6. The ne value in the volume of discharge (z=3mm, 4mm and 5mm) does not appreciably and reaches the following values: 4,6x10¹⁶m-3 2,4x10¹⁶m-3 and 4,6xl 016m-3 respectively. '
Figure 3(b), E (z, t) at the barrier wall changes between ±44,6 kV cm-1. The formation of the grounded side sheath is explained by the motions of electrons and total ions. A peak in E(z,t) at point B is also explained by the electron multiplication and ni+ peaks. However, the local distortion in E (z, t) appears at A and C due to the effect of the wall charge During the period between two points A and B, the electron energy rises instantaneously all over the discharge space. Then, the electron multiplication occurs nearly the cathode site.
Figure 3 (c) shows that Xe*2
eI+u)
is generated not only in the cathode side sheath but also in the bulk region, in which the electron multiplication is significant (see B and D in figure 3 (a». In particular, two sharp peaks nXe*2 at B, and D in the cathode sheath at rot = 0,141t and rot = 1,121t in a period are appreciably high and their magnitudes are about 6.1018 m-3. The values of nXe*2 at E and F in the region of discharge volume are 2x10¹⁸m-3 and 2,2x10¹⁸m-3.Figure 3 (d) shows that the Cl*2 is similar to the profiles of ne(z,t) and nXe*2 (z, t) but the peaks in nCl*2 at A, B, C and D are much less than the ones of nxe*2 (z, t).
Figure 3 (e, t) shows the evolution of the exciplexes XeC)* and Xe2CI*. They are also similar to the electron density ne and the excimers density of Xe*2 and Cl*2' The peak values of XeC)* and Xe2Cl* are mainly generated on the cathode site because of the electron multiplication. By comparing the maximal density between the excimers C( 2 and Xe*2
eI+u)
with the exciplexes of XeC)* and Xe2Cl* considered in our model, we note that the density ofXeCI* is ",1.5 times superior to that of Xe2C\*, '" 21 times superior to that ofXe*2eI+u),
'" 32 times superior to that of Cl* 2.D. Efficiency of the UVoutput light emission
Our model ofXe/CI2 excilamp developed in the previous part permit us to access directly the radiation of Xe * 2 et C( 2 exicmers as well as XeCI* and Xe2C( exciplexes at a point x and time t. The UV flux of photons <I> (x,t) emitted by the excimers and exciplexes is calculated as the following:
<I>iCx,t)=IKi*ni(excimers or exciplex) (4) Here : Ki: Radiative dissociation rate of excimer or exciplex
ni: Density of an excimer ou exciplex
Consequently, the radiated power emitted by the discharge and the instantaneous electric power at time t is:
PiJadiation(t)=Shvi
�OL C/J; ex, t)
(5) Pi�elec(t) =SVD(t)h(t) (6)Here :
h : Planck's constant (6,626.1O-34J.s)
Vi: Frequency of a photon at Innm (1,74.1015 Hz), 308nm (9,74.1014 Hz) and 490nm (2,04.1014 Hz) S: Section of the discharge (10-4m2)
jT: Total density of current
VD: Voltage at point D as shown in the figure 1 Consequently, the efficiency of the discharge can be calculated as the ratio between the mean UV emitted power and the mean electric power delivered to the discharge.
T
_ fo Piradiation (t)dt
'7. l - T
fo Pielec(t)dt
D.l Influence of the total pressure
0.45
� : : : :
.
j
-EffiCiencyaI172nm
0.4 __ - - .�
�
�. - - - . -l---- - - --�- - - ----�--
,.-Efficiency at D3nm:
...
;..._...
...
: -e·· Efficiency al400nm0.35 - ---.�---: - - -
.
:: ---- - _ . - --r: ,", - ---;. ---�---: : ---�-- -: - - ---0.3 .- . . ----.� : .. ----.. : -.--: �: -.�, - -'\-; ... ----.. j.----: : ... --�--... - --: . . , '\, . ,�
0.25 _ ... ---- -1
- ' ----_ ..+---
_ ...--�-
_ ..-
---
�
k
-
--
--_.+----
....-�--
...-
--�
0.2 --... ,1. ---.---. -l---�---�-
-�\-----�-
---
----�----
- - --":
:
iTL,
>
E
:
j
:
:
�:
0.05.
.··�
::::::
:
;
::::::
:
�
:
::
:
::
:
t
::::::
:
��:�:
�
:
�
:�:�:
(7) 200 250 300 350 400 450 500Total pressure (Torr)
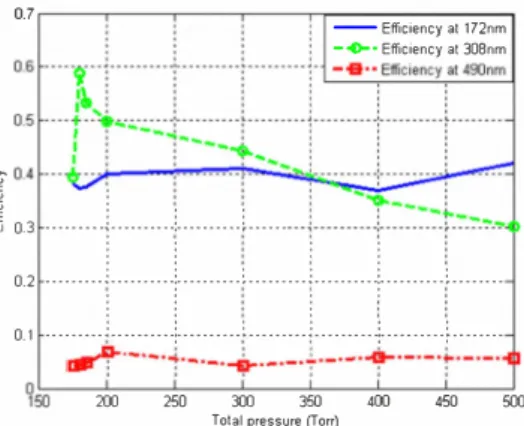
Figure 4: Influence of the total pressure on the efficiency of the XeCI excilamp supplied with a sine waveform source at V=8kV, f =50kHz and composition ofXe:CI2=97:3(%)
0.7 r--.---,---r--rr---,
-Efficiency at 172nm
_"e Efficiency al308nm
, :
:
H
-
]
-
--
-
F
J
-
�
F.,":"
·
·�
�
0.3 .-..----.j
.. ----.-. .L---.-.. ..l-.-... ---L
.-.--�
�
���.�b
·.�.�.� . . . . . , . . . , , . . , . 0.2 ... , ... ! ... , ... , ... ! ... , ... . . , , . . , . . , . . , . 0.1 ._ .... __ .; .. _. __ .... !. ___ ._ ... _,_._ ... ___ ; ... __ ._; .. ___ ... C __ ... _1III'f
·
-·-
·
�·-·-,
�
·-·-·
�
·-·-·�
·-·-·
t
·-·-·
200 250 300 350 400 450Total pressure (Torr) 500
Figure 5: influence of the total pressure on the efficiency of the Xe/CI2 excilamp supplied with a pulsed waveform voltage source at V=8kV, f =50 kHz, duty cycle =20% and composition ofXe/Ch =97:3(%)
The efficiencies of the UV radiation from the excimer of Xe*2 and the exciplexes of XeC)* and Xe2C1* respectively TJm, TJ308 and TJ490 for a sine waveform voltage (V=8kV and f=50kHz) and a pulsed voltage (V=8kV, f=50kHz and duty
cycle =20%), composition of Xe/Clz = 97:3(%) and P =(170-500)Torr are shown in the figures 4 and 5. It is shown that 11308 increases with increasing of total pressure from l 70Torr to 180Torr and then decreases more quickly when the total pressure continue to increase. While 11172 and 11490 varied also but in small range with increasing of the total pressure. Comparing the efficiencies of UV radiation between two waveforms voltages at the same conditions, we noted that the UV efficiency of a pulsed voltage is higher than a sine waveform voltage.
D.2 Influence of the el2 composition
0.7
r--r---,,---,---,---r---,-
Efficienc), al172nm
, . . . -+ ..Efficiency at l)3nm
0.6
···r···r···r···f···
-.g ..Efficiency at 49Jnm
"
'>
E
+--
I
--
L
L
[[
. . , . . . --... ' •... ' •...•... . , . . . . , , , . , , , " ,0,2
• ... ·'·· ...f
· ... ·f
... ··j
.. · .. ···: . . ... :· ... ·i
· . . . .:
:
:
:
:
:
:
0.1
·
·
�
<
t:
�
:
l
�:
�:
·i·
�:�
:
L:
�
:
·:·
�
:
�:
·:·
�:
�:
·i·
�:�:
01
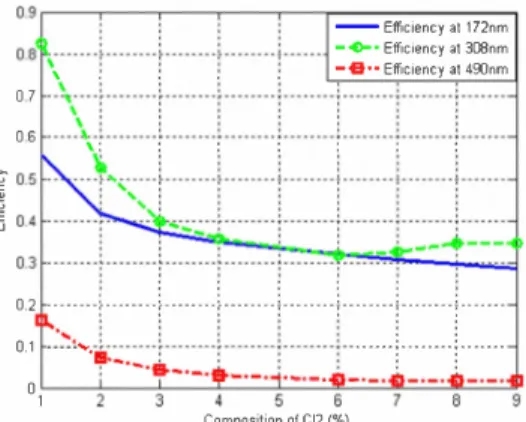
Figure 6: Influence of the Clz composition on the efficiency of the Xe/Clz excilamp supplied with a sine waveform voltage source at V=8kV, f=50 kHz and total pressure =180 (Torr). 0.9,---,----,----,----,-.---,
-
Efficiency 131 172nm
-,..
Efficiency 131 nnm
\. , . . . -e··Efficiency
131
400nm
:: '
:\
j
\.;::::::::t::::::::t::::::::t::::::::
: ::
:
l
::::::::
l
:
::::::::
:1
:::::::
i
::
t
-
'
___'
[
l
IE
· . . . . · . . . .0.2
•.
..
.<·· ... [· ... ·[ ..
.
....
. 1 .. · .... +· .... ·+·· ....
·; ....
·0.1
·
>
'
...
�
::::�:
L
:�:
·f
·
�
:�
:
·l
:�
:
�:
+
·
....
-+
...... ·l ... ·
01
Composition ofCt2 (%)
Figure 7: Influence of the Clz composition on the efficiency of the Xe/CIz excilamp supplied with a pulsed waveform voltage source at V=8kV, f=50 kHz, duty cycle =20%, total pressure = 180(Torr)
In figures 6 and 7, 11172, 11308 and 11490 of the Xe/CIz excilamp in both two waveforms voltages show the same profile of decreasing of the UV efficiencies when increasing the composition of Clz in the mixture of Xe/CI2.
Similar to the previous results, the UV efficiencies of the Xe/CIz excilamp supplied a pulsed voltage is more efficient than a sine waveform voltage as shown in the figures 6 and 7
D.3 Influence of the frequency
In this study, the voltage, the total pressure and the composition of Clz is kept constant at l OkV, 180Torr and 97:3(%). The frequency of each waveform voltage varied in a range from 50 kHz to 200 kHz for a sine voltage and 50 kHz to 150 kHz for a pulsed voltage. Our obtained results are shown in the figures 8 and 9. We noted that the more the frequency increases in the case of Xe/CIz supplied a sine voltage, the more 11308 is observed. In contrast, 11172 and 11490 remain constant with increasing f.
In the case of the excilamp supplied with a pulsed voltage, 11308 increases with increasing the frequency from 50 kHz to 100 kHz and achieves a maximum at 100 kHz. From this value of frequency, 11308 decreases rapidly with increasing f. Similar to the sine voltage, 11172 and 11490 remain constant with the variation of the frequency.
0.7
_Efficiency at
1
72nm
l
--..
Efficiency at
3Cf3
nm
::
;
�
:
::
�
;
�
�
=
:
"
:
"
!
___�
�
::l
�
-
:?
-
'
1
::
2
,·
·
:
:::
··
:
·
:
:
::
·
:
1
,·
:
·
:
·
··
:
·
:::
·
::
:
·
1
,::
:
·
::
·
:
...
.
, , , , , , , , ,0.2 ...
:
..
.
.
.
.
...
..
.
.
.
.
..
:
..
..
.
.
..
:
...
.
.
...
.
...
.
. ..
: : : , , , , , ,0
,
11
.
:
�:�:�:�:�
�
:�:�:
�
:�
:
�
�
:�
:
�:�:�:��
:
�:�:�
:�
:�
�
� @ S � BFrequency
(kHz)Figure 8: Influence of the frequency on the efficiency of the Xe/CIz excilamp supplied with a sine waveform source at V =8kV, total pressure =180(Torr) and Compostion of Xe:Clz =97:3 (%)
0.9 ,--,--,---r--,---,--,--,--,--,---,
:
:
:::
::
::::::l::::::
L
A
�
:
:
�
r�
l
�
�
I
�
�
f
;
;
l
�
J
:::::
06 . . ... : ...:
;/f.: : 1
. . ... J ..1
Efficiency a1172n��
••.• � .••••. ��.":" • ..,.-
""
·
Efficiency al 3l8n�I
: :
I::
?
t
::::::::
····:
··-
�
.. Effl�iency:'
490nm ..::::::::::r:::
0.3 ... ; ... ;... :... ,... ;... ;... ;... ,... ; .... . : : : : : : : 0.2 · · · ·t
···i
···i
···r
···t
···i
···i
···r
···r
··· 0.1·
:
�:
L
:�
i
�:�:�::::::;:::::�::::�::::::�::::
f
:
:::::
�
:::::
Frequency (kHz)Figure 9: Influence of the frequency on the efficiency of the Xe/Ch excilamp supplied with a pulsed waveform voltage source at V =SkV, total pressure =IS0(Torr) and composition ofXe:Clz =97:3 (%)
D.4 Influence of the duty cycle of the pulsed voltage The influence of the duty cycle on the UV efficiencies is presented in the figure 10. It is shown that TJ308 increases quickly with increasing the duty cycle from 10% to 40% and then keeps completely constant in a range from 50% to 60%. Beyond this last value, TJ308 decreases rapidly with increasing the duty cycle of a pulsed voltage. In contrast, there weren't significant variations in 11172 and TJ490 when the duty cycle was changed from 10% to SO%
0.9 : : • ____ .... ___ �. :
::
:::::::::l::::
::
::::
)tLz
<
r
··
·
·
··
·
·
·j·
···
·
·
·
·
i
··
>
�
�
1
<
::
.1
-Efficiency at 172nm:
I.
:
"
06 . ... 1. .... ,:'. . .:. ... -.... ·Efliciencyat3J8nm .... � ... .:
,,' : -.g ... Efficiency al400nm :i
::
?
:
t
r
"
! '
0.3 ... ; ....
.... , ...
... ; ....
... ; ... ; ... ; ... .:
: :
: :
' · , , , , 0.2 ... , ...:
... , ... , ...:
... , ... . · , , . . , , " " · , . . , 0.1 ... , ... , ... , ... , ... ; ... , ... . · -·-·..b -·-·-.·-· -·tit-·-·�· -·-·�·-·- ·.q..· -· -· Duly cycle (%)Figure 10: Influence of the duty cycle of the pulsed voltage on the efficiency of the Xe/Clz excilamp
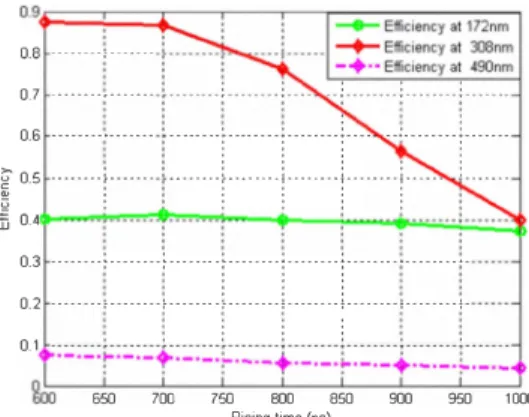
D.5 Influence of the rising time of the pulsed voltage
0.9IF==C�;:-: -:-r-e=i��;172,;;;;l O.B .•.••••• , •.••••• 0.7 .•.•••••• •.••••• 0.6 ...•...
i
0.5... � ... .
� 0.4
:
· . . . . · . . . . ... ... . . . . . · . . . . . . .:
...:
...:
.... ...:
... .:
:
:
:
· . . . . · . . . . ... � ....
. t··· ·t··· ··t··· ... . · . . . · . . .: :
:
:
0.3 ... ; ... ; ...( ... j ... (
..
....
.... . 0.2 ... , ... , ... ;... ; ... . ; ... ..,. ... + · . . · . . · . . 0.1 . . . . . :;.::;.::�:;.:::.:+::.:::.::�:::::.:+::::�:�:�:�+:�:�:�:�:� � � � � � � � � �Rising lime (os)
Figure 11: Influence of the rising time of the pulsed voltage on the efficiency of the Xe/CIz excilamp
To evaluate the influence of the rising time of a pulsed voltage on the UV efficiencies, we fixed the following parameters: V=SkV, f=50 kHz, total pressure =IS0Torr, duty cycle = 20% and composition ofXe/CI2 = 97:3(%) and varied the rising time in a range from 1000ns to 600ns. This last value corresponds to the inferior limit value for our model. Beyond this value, if we continue to decrease the rising time, our model doesn't converge because the approximation of local field isn't correct.
The figure 11 shows that decreasing the rising time is leading to a drastic increase of the efficiency 11308
It is clearly shown that TJ308 at 600ns is two times higher than at 1000ns. In contrast, TJl72 and TJ490 don't have a significant variation when changing the rising time.
V. CONCLUSION
XeCI dielectric barrier discharges were simulated using one --dimensional drift diffusion model under the application of pulsed and sinusoidal voltages waveforms. It was shown that the spatiotemporal profiles of the excimers and exciplexes are mainly produced near the barrier walls at each haft cycle. At the same parameters such as the amplitude, the frequency, total pressure, rate of mixture Xe/CI2 •.•etc, the
light output efficiencies TJl72, TJ308 and TJ490 for a pulse voltage are more effective than the ones of a sine voltage. The present results suggested that the light output efficiency of a DBD depend not only the power supply and also the composition of gas mixture. These results obtained in this paper help us in the design of innovative power supply topologies in order to achieve a high level of UV power and efficiency of excilamps
REFERENCES
[I] H. Akashi, Y. Sakai, N. Takahashi and T. Sasaki , "Modelling of the initiation and development of a filamentary discharge in XeCl excimer lasers".J.Phys.D : Appl.Phys.32, pp.2861-2870, 1999.
[2] S. Bhosle, R. Diez, H. Piquet, D. Le Thanh, B. Rahmani and D. Buso, "Modeling of a dielectric barrier discharge lamp for UV production", Comsol conference, Hanover, 2008.
[3] The Bolsig +, the Siglo Database,CPA T and Kinema Software, 1995 .. [4] B . Eliasson, U Kogelschatz , "Modeling and applications o f silent
discharge plasmas", IEEE Transaction on Plasma science, VoJ.] 9, pp.309-323, Apr 1991.
[5] V. Erofeev and V. F. Tarasenko, "XeCI-, KrCI-, XeBr- and KrBr excilamps of the barrier discharge with the nanosecond pulse duration of radiation", J. Phys. D:AppI.Phys.39, pp.3609-3614, Aug 2006. [6] M. V Erofeev, V S Skakun, E. A. Sonin, V F. Tarasenko et E. B.
Chemov, "Lifetime of working mixtures of XeCI and KrCI excilamps, Almos.Oceanic Opt, vol.13, 2000.
[7] X. Jinzhou, G. Ying, X. Lei and Z. Jing, "Discharge transitions between glow-like and filamentary in a xenon/chlorine -filled barrier discharge lamp", Plasma Sources Sci. Technol.16, pp.448-453, 2007.
[8] C. Lee, M. A. Lieberman, "Global model of Ar, O2, Ch and Ar/02 high density plasma discharges", Journal. Vac. Sci. Technol A, vol. I 3(2),pp. 368-380, 1995.
[9] T.Letardi, H. Fang and S. Fu , "Theoretical modeling of an X-ray preionized self sustained XeCI laser ", , IEEE journal of Quantum electronics, Vol. 28, pp. 1647-1652, July 1992.
[10] M. I. Lomaev, E. A. Sosnin, V. F. Tarasenko, D. V Shits, V. S. Skakun, M. V Erofeev and A. A. Lisenko, "Capacitive and barrier discharge excilamps and their applications", , Instruments and experimental techniques, Vol.49, pp.595-616, 2006.
(II] J P. Meek, L. B. Loeb , 'The mechanism of the lighting discharge", American Physical Society, vol. 55, pp. 972-977, 1939.
[12] A. O da, Y. Sakai, H. Akashi, H. Sugawara, "One-dimensional
modelling of low frequency and high-pressure Xe barrier discharges for the design of excimer lamps", J. Phys. D: Appl. Phys, vol. 32, pp. 2726-2736, 1999.
[13] A. N. Panchenko, E. A. Sosnin, V. F. Tarasenko, "Improvement of output parameters of glow discharge UV excilamps", Optics Communications 161, pp. 249-252, 1999.
[14] L. Stafford, J Q. Margot, F. Vidal, M. Chaker, K. Giroux, J S. Poitier, A. Q. Leonard and J Saussac, " Kinetics driving chlorine high density plasmas",J. Appl. Phys , vol.98, pp. 063301- 063301-11, 2005.