Thermal comfort and air quality: one-year measurement, analysis and feed
back to users of an educational building
Sébastien Thomas, Samuel Hennaut and Philippe André
University of Liège, BE, Arlon Campus Environment, 185 Avenue de Longwy, 6700 Arlon, corresponding author [email protected];
Abstract: Whereas thermal comfort and air quality in buildings are often measured locally and over a short-term period, the complaints of user may occur everywhere in the building regardless the time of the day or the season. The dynamic nature of indoor environments make it hard to closely assess and compare the comfort conditions in the day-to-day life within all the spaces of a building over time. In this study, thermal comfort and air quality have been measured in four teaching rooms in a university building located in Belgium. The analysis gives a letter (A-B-C or D) for the comfort and the air quality for each room. The computed level of thermal comfort and air-quality is shown to users on a yearly and monthly basis via the TV screen located in the building. The vulgarisation, or sharing of the results with the building occupants makes the users aware of their own impact on comfort conditions and the options available for them to improve them through their own actions. The whole year gathered data illustrates the various occupancy patterns and highlights the opportunities to improve comfort:. On the one hand, the results shown a low air quality, the CO2 thresholds
have been modified. On the other hand, the summer comfort, was found to be poor in two rooms. This argues with the landlord to do something to improve the comfort especially in these rooms.
Keywords: CO2 measurement, thermal comfort, air quality, feedback to users
1. Introduction
Buildings are expected to allow people to live, work and entertain themselves under optimum conditions of comfort. Most people spend more than 80% of their time indoors, if not more. Therefore many are concerned about comfort in buildings. This reveals multiple aspects such as hygrothermal comfort, visual comfort, acoustic comfort and air quality. All comforts are highly subjective and often lead to complaints from tenants. It is consequently crucial to objectivize the feelings of people. In the context of university buildings, a better comfort increases the value of learning and boost wellbeing of both students and teachers.
In this work it is proposed to assess the thermal comfort and air quality of several teaching spaces. Long term measurements are run, they enable to give feedback to users and to improve the comfort conditions.
2. Building description
The building monitored is a 1985-building located in the Arlon campus of University of Liège (south of Belgium). The small town, nearly rural, host the campus in a 3-hectare green park.
The 840m² net floor area building includes auditoriums, seminar rooms, and offices (named B1 to B5 on figure 2). For the purpose of this work, only rooms used for teaching are considered (4 rooms). It is a concrete building with 12 cm mineral wool insulation. The two auditoriums are half underground; this ensures a better summer thermal comfort for those areas. Another particularity of the building is the large glazed area on south façade (figure 1). External-solar protections are not working anymore. There is a buffer space behind the
south façade as viewed on figure 2. On a HVAC point of view, the building is heated by a gas burner and radiators, air handling units provide fresh air to the rooms, dampers allow selecting the destination of mass flow. There is no recirculation, no heat recovery, a heating coil and a single speed fan. All those equipment are 30-year old, the control has nevertheless been updated. Automatic control are implemented, the user has the only opportunity to turn the thermostatic valve of the radiators.
In this study, the thermal comfort and air quality have been measured in four teaching rooms (respectively 10, 20, 50 and 100-people rooms) listed in table 1. Two of them are displayed on figure 1.
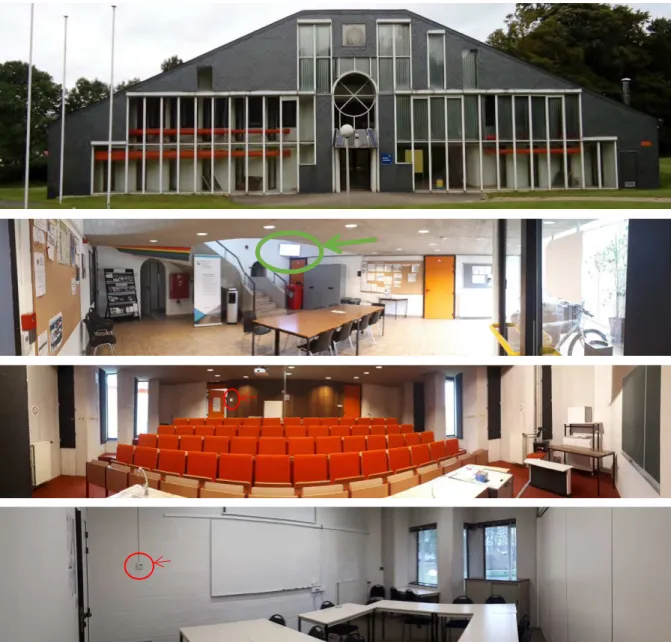
Figure 1. Picture of the Academic Building, from top to bottom: outside view of South façade, ground floor hall, auditorium 2, seminar 2.
Figure 2. Schematic view of the building (Lakrafli,2008)
Table 1. Listing of monitored rooms
Size [m²] Max. attendance [pers.] Sensors
Seminar room 1 52 24 Air t°, RH , CO2
Seminar room 2 25 12 Air t°, RH , CO2
Auditorium 1 171 120 Air t°, RH , CO2
Auditorium 2 112 50 Air t°, RH , CO2
Whole building 840 / Outdoor t°, wattmeter
3. Monitoring description
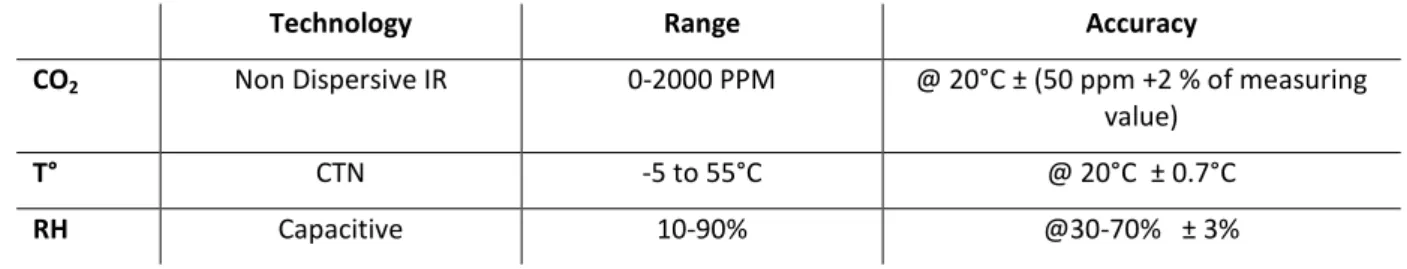
A building monitoring system is fit to the building, it consist of plenty of sensors and actuators controlling heating devices, ventilation, doors, outside lighting. The booking of rooms is also connected to the monitoring system. This implies knowledge of the occupancy of the various rooms. For this study, the air temperature, relative humidity and CO2 concentration are recorded with one integrated sensor (see technical data in table 2) using a sampling period of 5 minutes. There is permanently one sensor per monitored room, it is shown in a red circle on figure 1. All the collected data is stored on a server we consult each month for the data analysis.
3.1.Thermal comfort
The ISO 7730:2005 standard is used to evaluate the thermal comfort. The categories are described in table 2. As for the PPD computation more parameters are required, some assumptions must be drawn. We assume the following lines are a strong hypothesis, which was a compromise to have continuous PPD evaluation throughout the year.
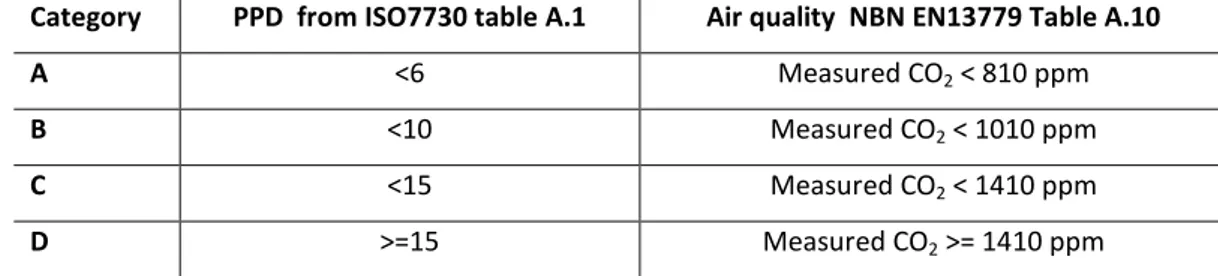
Table 2. categories of thermal environment and air quality (International Organization for Standardization ,2005) (Bureau of Standardisation NBN, 2007) Outside CO2 level is set to 410 ppm
Category PPD from ISO7730 table A.1 Air quality NBN EN13779 Table A.10
A <6 Measured CO2 < 810 ppm
B <10 Measured CO2 < 1010 ppm
C <15 Measured CO2 < 1410 ppm
- Air temperature: measured ( ) - Relative humidity: measured
- Clothing: 0.5-1 (the teachers and students are able to choose their clothing – the lowest PPD value is taken into account)
- Activity: 1.2 met (sedentary activity school)
- Surface temperature: worst case taken into account, computed using the measured outside and inside air temperatures as well wall U-value.
- Air speed: set to 0.1 m/s. Some punctual measurements were achieved, there was no high speed recorded.
The outside air temperature ( ) is measured in the building neighbourhood without any radiation effect. Inside surface temperature is computed as follows (without any dynamic effect):
= −
−
ℎ
Where = 0.298 W/(m²K) (using 10 cm concrete and 11 cm mineral wool) ℎ = 7.7 W/(m²K) (representing the heat transfer from internal surface to air).
Let’s give a few details about the air speed hypothesis. The air speed is very complicated to measure in a permanent way for each sitting place in each room. Some measurement undertaken in a short period of time did no raise any high air speed. No air draught is encountered due to lack of opening windows in the rooms and adequate sizing of the ventilation system. This is clearly an advantage for winter comfort, but a real issue in summer. This is not possible to cool the building with fresh air from windows. For summer comfort the same hypothesis is taken into account (low air speed).
Table 3. Sensor EE80-2CSD04 technical description (Airtesttechnologies.com 2017)
Technology Range Accuracy
CO2 Non Dispersive IR 0-2000 PPM @ 20°C ± (50 ppm +2 % of measuring
value)
T° CTN -5 to 55°C @ 20°C ± 0.7°C
RH Capacitive 10-90% @30-70% ± 3%
3.2. Indoor air quality
The EN13779:2007 standard is used to evaluate the air quality. The categories are also described in table 2. The assumption of base outside CO2 level of 410 ppm has been taken into account. This has clearly no impact on results as the CO2 sensor is auto-calibrated to lowest value of 410 ppm within a period of one week. The viewpoint of the standard EN13779 is the gap between inside and outside CO2 concentration.
3.3.Occupancy
As mentioned below, the booking of rooms is also connected to the monitoring system. The room can be separately booked (15 minutes sample), the comfort and air quality are only computed when the room booking flag is on.
3.4.Electrical consumption
Despite not detailed in this work, the electrical consumption has been recorded and compared to standard DIN V 18599:2007. This standard gives target but no categories. The Luxembourgish legislation besides uses this standard and specify categories (Ministry of Economy, Luxembourg, 2010). The building electricity consumption has been compared to the Luxembourgish legislation. The result are quite good due to the efficient lighting, CO2 based ventilation and low number of appliances. Those measurements are no more detailed in this work.
4. Data analysis
The measurements detailed in §3 were run throughout year 2016, they were analysed each month to give feedback to users (§5). July is not mentioned as there is no one in analysed rooms (university holidays). A deeper analysis has been done in the beginning of 2017 with all the data collected previous year.
4.1.Global results
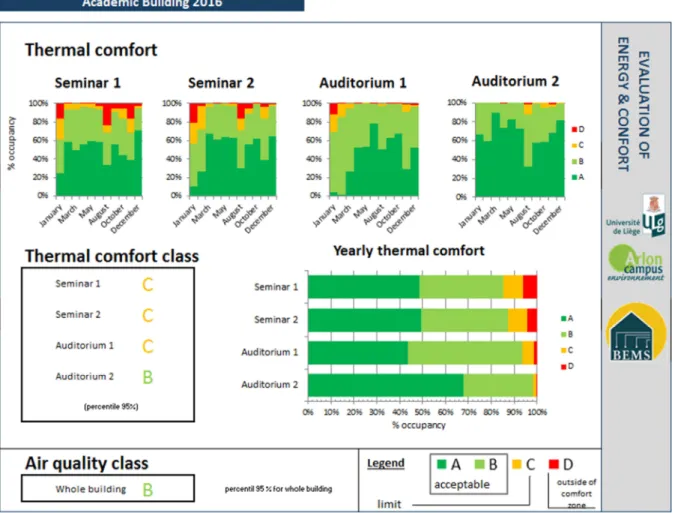
These are mainly shown on figure 7 for yearly results, this set of diagrams is purposed to feedback users and inform the landlord and staff to make decisions about the works to undertake.
The thermal comfort category for each room are gathered and displayed for each month. The y axis represents the occupancy percentage. Relative period of time has been chosen for presentation and comparison purpose.
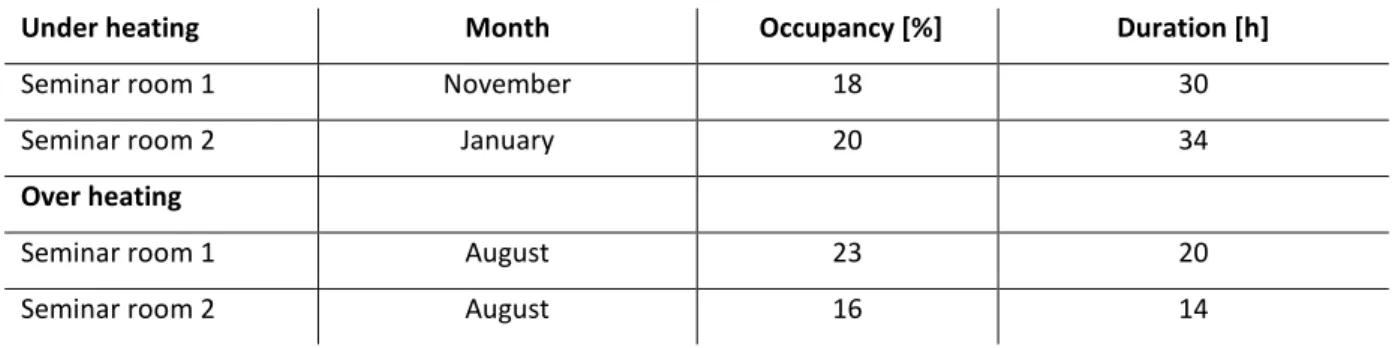
For the seminar rooms, a “D” category (meaning a significant lack of comfort) is pointed out in table 4. There is a great lack in thermal comfort especially in the 1st floor in extreme season.
Those measurements led to increase the ventilation temperature set points and to renew the motor of a roof-top fan evacuating building heat in summer.
Table 4. Worst month where “D” category was found in the seminar rooms for thermal comfort
Under heating Month Occupancy [%] Duration [h]
Seminar room 1 November 18 30
Seminar room 2 January 20 34
Over heating
Seminar room 1 August 23 20
Seminar room 2 August 16 14
For the auditorium, better comfort conditions have been encountered (semi buried rooms with large inertia increase summer comfort). Only January in Auditorium 1 encountered significant D letter 11% of the time. The ventilation set point increase seemed to solve the problem. For both type of rooms, sometimes the user turns the thermostatic valve, so the thermal comfort conditions are not met anymore for the following hours … to the following day. In other words, the user disturbs the thermal comfort. Moreover, to explain bad comfortable conditions, the occupancy period taken into account is based on room reservation, which is not always consistent as explained in §4.2.
The analysis regarding the percentages does not reveal the hour of uncomfortable conditions. Generally the occupancy taken into account is between 150 and 200h per month. August is partly holiday; the occupancy of each room is 88h.
The air quality based on CO2 measurement revealed a suitable ventilation operation for all the rooms. The CO2 based ventilation permits good air quality (class A or B) all over the year. In seminar 2, 100% of occupancy has encountered a class A or B. In seminar 1, only one hour period with class C has been encountered. For the auditorium, sometimes when both auditoriums gather a significant number of people, the class C is encountered. It appeared less than 1% of the total recorded period. The summary graph does not show much data about air quality.
4.2.Focus on specific days.
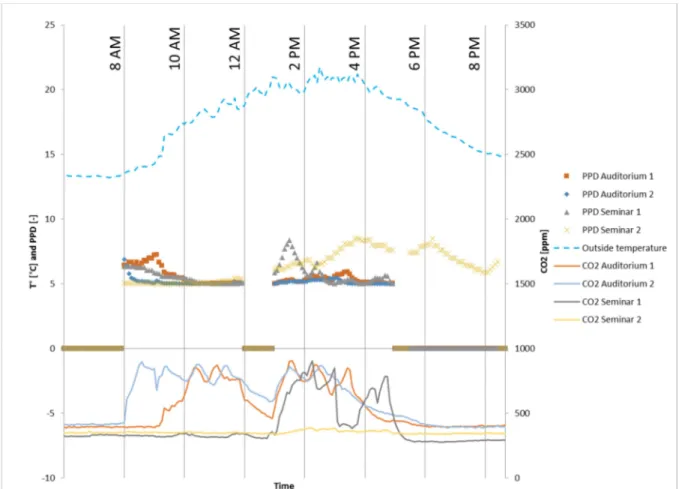
First, a typical day result is displayed on figure 3. It shows the typical operation of the building and the kind of measurement we recorded most of the time (i.e. low PPD and CO2 levels). Computed PPD is displayed with markers for each room in order to explain thermal comfort. The markers are set to zero when there is no room reservation. The CO2 levels describe the air quality and occupancy of each room. Outside temperature is displayed in all graphs of this paragraph to appreciate the weather conditions.
Figure 3 gives the typical reservation pattern: for weekdays, all rooms are booked from 8 to 12 AM, from 1 to 5 PM, and some rooms (e.g. seminar 2) are booked for evening classes or over events. Despite the reservation, the lessons take place or not, with a delay or on time! The CO2 level increasing over 500 ppm defines a presence of people in the room. In auditorium 1, the lesson started at about 9 AM, auditorium 2 it started at 8 AM. In seminar 1, the lesson was only given in the afternoon and there were no lessons this day in seminar 2. This emphasizes the lack of confidence in reservation data (it will also be the case for the next specific cold and hot days). About thermal comfort, the PPD value is generally lower than 10%, it could be a little bit higher at the beginning of the day when the building has not warmed up enough.
The CO2 level reach peaks at around 900 ppm CO2. This is the threshold for starting the ventilation. The CO2 level sail through 400 and 900 +/- the tolerance of the sensor (table 2). The sensor are auto-calibrated to 410 ppm on a weekly basis.
Figure 3. Typical day results (29th September 2016) : CO2 level, PPD computation and outside t°
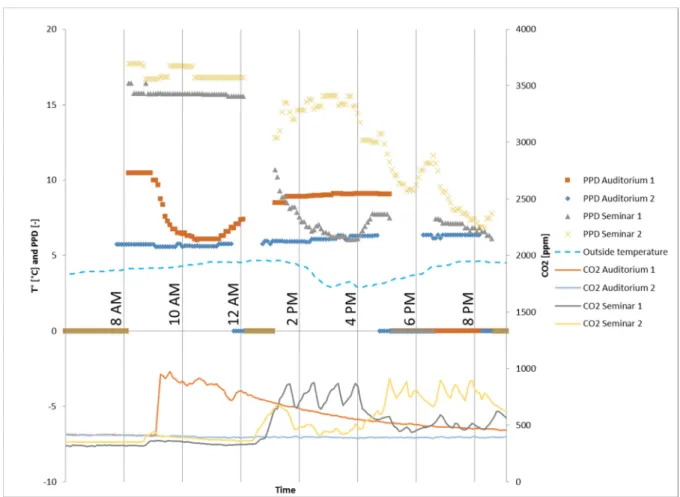
A cold day (5th January) is displayed on figure 4 to illustrate the lack of comfort recorded in winter. The occupancy patterns show a low comfort especially when there is no one in the room (low CO2 concentration). The two seminar rooms have sometimes too low comfort; the wrong position of the radiator thermostatic valve and lack of ventilation boost (i.e. 21°C set-point at that time) can explain this. As seen for seminar 1 in the afternoon, the comfort conditions become better directly after occupancy start. For seminar 2 in the afternoon, the CO2 level suggests a low occupancy, and a considerable lack of comfort for those few people (between classes C and D). The discrepancy between reservation and actual occupation is also highlighted on figure 4. The auditorium 1 has still high CO2 level in the afternoon despite there is no one in the room, so the occupancy could not be directly linked with the CO2 level (but with its evolution over time).
This cold day is representative of the experienced lack of thermal comfort in winter days due to two main reasons:
- Ventilation set-point too low
Figure 4. Cold day results (5th January 2016) : CO2 level, PPD computation and outside t°
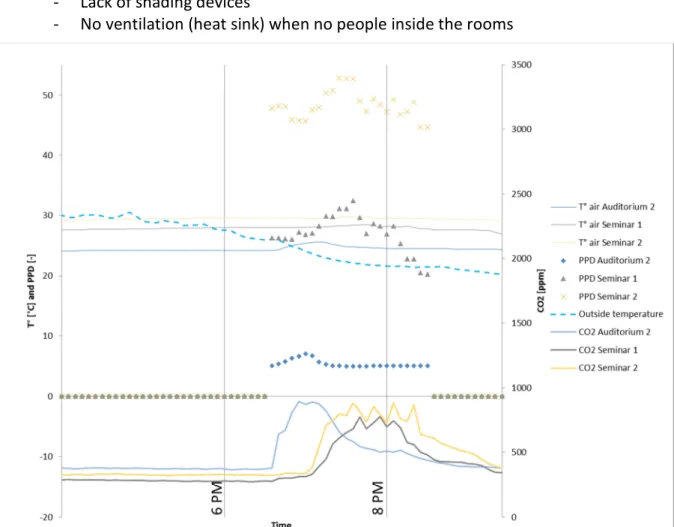
A hot period (13th September) is displayed on figure 5, it depicts what happens in the seminar rooms in case of hot weather. Some stuff differ from the two previous graphs:
- The auditorium 1 is not mentioned as it was not used this day.
- The measured air temperature in each room is displayed to emphasize the overheating.
- Only the end of the day is displayed as there was no daily lesson this day (only evening classes between 6:30 PM to 8:30 PM)
The 1st floor includes the seminar rooms and as no active cooling. During the day the solar gains enter the building and heat spreads through wall and internal windows to the seminar rooms. Those are not ventilated, the temperature stays at a high level. This implies a very high PPD at the beginning of the occupancy period (around 50% for seminar 2). The large inertia maintains a high temperature (30°C in seminar 2) despite the ventilation with lower outside air at around 22°C. Seminar 1 and 2 encounter generally high air temperature in summer, the only heat sink is the ventilation. For security reasons the doors are locked when no occupancy; the natural ventilation is therefore not influencing the temperature in those rooms.
The auditoriums meet good thermal comfort conditions whatever the outside temperature (not only for this day but for the whole hot season see fig.3). In case of long heat wave, a natural ventilation is possible through an emergency exit on the bottom of each of the auditoriums, those allows crossing natural ventilation.
This hot day is representative of the experienced lack of thermal comfort in seminar rooms in hot summer days. This is due to two main reasons:
- Lack of shading devices
- No ventilation (heat sink) when no people inside the rooms
Figure 5. Hot day results (13th September 2016) : CO2 level, PPD computation, inside and outside t°
4.3.Limitations
- With the diagram of figures 6-7 (using only letters A-D), it is not possible to check if there is a problem of under heating or over heating while analysing yearly results. The letter only specifies a gap between the current conditions and optimal conditions; care should be taken to verify the data to be sure a “D” does not mean an overheating in winter!
- Only one probe is placed in the area, this limits a lot the comfort analysis and forces us to make a set of assumptions. As a first improvement, a second probe could be placed in auditorium to catch the temperature gradient in the room. - Occupancy is based on booking of rooms, sometimes the rooms are booked and
there is no one inside as illustrated before (§4.2). This clearly affects the results: On the one hand, the air quality is better (no CO2 production) and of the other hand the thermal comfort is worse (no one to turn the thermostatic valve, no internal gains). A better way to catch occupancy should be found: CO2 level, lighting consumption, occupancy probe…)
- The CO2 is the only indicator for air-quality in this study, additional measurements could be taken to attest the air quality (e.g. : VOC probes)
- Merging comfort conditions from different rooms over a long period request weights. We decided to give the same weight to each room; to be more consistent, a weighting should be done regarding the number of people present in the rooms.
4.4.Building improvements
Actions must especially be taken to improve summer comfort; a new motor for the exhaust fan on the top of the building has been installed since the measurement. It allows evacuating heat from hall and buffer space in summer. During summer 2016, the fan was not in operation. Moreover, the ventilation could be operated to cool the seminar rooms. As mentioned in §4.2, the seminar rooms are sometimes only used during the late afternoon and thus door closed during the day. The CO2 based ventilation does not operate as there is no one inside. The operation of the ventilation should be driven by outside and inside temperature in those cases.
After the lack of comfort encountered in January 2016, the ventilation air temperature set point has been increased from 21 to 23°C. There was no more significant lack of winter comfort met in 2016. If required, a ventilation boost could be operated in winter in order to warm the room before occupancy. Likewise in summer the ventilation should be driven by inside temperature. Moreover, this ventilation boost competes against energy savings in the building.
At the end of 2015, the first measurements showed a lack of air quality. The CO2 thresholds for starting and stopping ventilation were modified before year 2016 (cut-in is 850ppm instead of 1000ppm). This allowed reaching good air quality during the period analyzed in this work.
5. Feedback to users
User feedback is rarely described in studies, but becomes more and more important while improving comfort conditions and managing complaints in building (International Well Building Institute pbc and Delos Living, 2017). In this part of the work, the scope is to inform the users and the landlord to objectivize the possible complaints and to steer building/HVAC modifications.
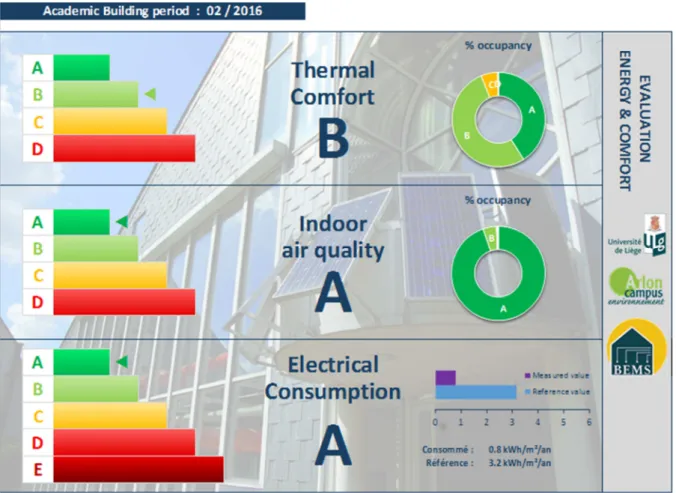
A monthly result summary has been built (figure 6), the categories are clearly shown to ensure a quick and straight understanding of the reader. So, only one letter is set for the whole building for each criterion (each room is weighted by the occupancy duration). The letter shown is the worst category reached at least half of the occupancy period. More information about the percentage in each category is given on the right side to get the reader interested. Despite a good letter, a significant part of the period could be out of comfort conditions.
The yearly results summary (figure 7) is moreover dedicated to the landlord to take actions. In comparison with the monthly results, all the separated data from the four rooms are displayed. The quick understanding is not anymore pointed out. A more adequate diagram is set for each room and the letter selection hypothesis is highlighted. The diagram for each room tells the period with lack of comfort (e.g. August for seminar 1), a horizontal bar plot helps comparing the rooms. For electricity and air quality, there was no significant variation throughout the year, a single letter is appropriate to show the result. The letters highlighted are no more representing the half time occupancy (as for monthly results figure), but the 95% percentile which is much more restrictive. Thus, a 5% duration period outside of comfort is considered as acceptable (Bureau of Standardisation NBN, 2007), at least for overheating. A legend is added, it should have been also added for monthly results. The categories definition in the standards (table 2) is not easily comprehensible for non-technical staff, another description is given in the yearly results figure. Nevertheless it does not distort with the meaning of the standards ISO7730 and NBN EN13779.
From the user point of view, there are three ways to be informed about comfort: - The sensor (red circle on figure 1) has a screen that allows the occupant to see
the current measured temperature, humidity and CO2 level.
- A web page has been set to explain the measurement to the building users (Thomas, 2016), a QR code was set to enable the occupants to easily access this page.
- A TV screen (green circle on figure 1) shows many pieces of information related to courses and events in the building. The results from the previous month are shown on this screen. The yearly results of 2016 were shown in early 2017.
Figure 7. Yearly results 6. Conclusions and perspectives
This work concerns long term comfort measurement in an academic building. The
objectives are to quantify what exactly were the comfort conditions experienced in it, to
notify users of them and based on the findings of how that affected the actions of the users and resulting conditions achieved, provide a report for the landlord on where comfort problems exist over the year and how to improve them. To turn this study into a product capable of providing such a service in this and other buildings in the future a compromise has to be found between the reporting of the complexity of a complete academic comfort study and the measurement devices required to undertake it over the longer without disturbing the users and the affordability of rolling the method out more widely. The combination of room sensors, meteorological stations and room reservation data revealed the thermal comfort and air quality in four teaching room throughout the year 2016. The normative classification of comfort given by international standards is used to transfer the huge amount of data recorded into a vulgarised summary for the building occupants and landlord.
The following conclusions are drawn:
- The air quality measurements show a good ventilation strategy whatever the room and period. The air quality is clearly a strength of this building.
- The thermal comfort analysis depicted issues concerning overheating in summer and under heating in winter.
- A short period of measurement quickly highlighted problems that can be solved without any investment: increase of ventilation temperature set point (23°C instead of 21°C), modification of ventilation CO2 threshold by the end of year 2015 (cut-in is 850ppm instead of 1000ppm).
- Despite the lack of thermal comfort measured, the data gathered shows that more than 85% of the occupancy time meets acceptable conditions in 2016. These are some perspectives for future work on comfort measurement:
- Increase the number of probes per room (at least two) to have a better evaluation of both comfort and air quality as explained in §4.3.
- The occupancy considered is sometimes far from the real building occupancy, something must be done to handle more precisely this parameter.
- Include the landlord in the process of enhancing wellbeing of building users - Measure the energy consumption in order to balance energy and comfort
- Especially in this building, compare the summer comfort rise since the installation of new roof top fan.
These are recommendations for improving this building comfort and feed back to users:
- The under heating issues can be solved by a better awareness of the use of the radiators thermostatic valve in the rooms by occupants (or hold the valve fully opened).
- The overheating can be tackled by investment on new solar protections, better control of ventilation (temperature based instead of CO2 based ventilation), modifications of security rules (doors locked implies lack of natural ventilation heat-sink).
- Display real time comfort on the screen to better inform the users and notify possible issues. To do this, some technical barriers must be raise (e.g. automatic control of measurement failures due to power cut, centralisation of all data on a web server).
- To warn the user about his impact on comfort, some pieces of advices could be displayed on the TV screen about building comfort (thermostatic valve operation, door opening policy).
Copyright Notice
Authors who submit to this conference agree to the following terms: Authors retain copyright over their work, while allowing the conference to place this unpublished work on the NCEUB network website. This will allow others to freely access the papers, use and share with an acknowledgement of the work's authorship and its initial presentation at this conference.
References
Airtesttechnologies.com. (2017). EE80 sensor data sheet. [online] Available at:
http://www.airtesttechnologies.com/support/datasheet/EE80.pdf [Accessed 15 Dec. 2017].
Bureau of Standardisation NBN (2007), NBN EN 13779:2007, Ventilation for non-residential buildings -
Performance requirements for ventilation and room-conditioning, 2nd edition, Brussels :NBN
DIN German Institute for Standardization (2007) DIN V 18599-1 :2007, Energy efficiency of buildings — Calculation of the energy needs, delivered energy and primary energy for heating, cooling, ventilation, domestic hot water and lighting, Berlin : DIN
International Organization for Standardization (2005), ISO7730:2005, Ergonomics of the thermal environment -- Analytical determination and interpretation of thermal comfort using calculation of the PMV and PPD indices and local thermal comfort criteria, Geneva : ISO
International Well Building Institute pbc and Delos Living LLC (2017), The Well Building Standard® v1 with Q4 2017 Addenda, New York, Delos Living LLC
Lakrafli, H., 2008. Application à différents outils de calcul de la ventilation du bâtiment académique de la F.U.L., Master Thesis, University of Liège
Ministry of Economy, Luxembourg (2010). Règlement grand-ducal du 31 août 2010 concernant la performance énergétique des bâtiments fonctionnels. Luxembourg: Legilux, pp.§3.1 & §7.
Available at: http://data.legilux.public.lu/eli/etat/leg/rgd/2010/08/31/n1/jo [Accessed 15 Dec. 2017]. Thomas, S. (2016). Visualisation monitoring Campus d’Arlon ULg. [online] Paper.dropbox.com. Available at:
https://paper.dropbox.com/doc/Visualisation-monitoring-Campus-dArlon-ULg-AT06MFJAlVixGIkpJ3ojK [Accessed 15 Dec. 2017