HAL Id: hal-00304213
https://hal.archives-ouvertes.fr/hal-00304213
Submitted on 30 May 2008HAL is a multi-disciplinary open access
archive for the deposit and dissemination of sci-entific research documents, whether they are pub-lished or not. The documents may come from teaching and research institutions in France or abroad, or from public or private research centers.
L’archive ouverte pluridisciplinaire HAL, est destinée au dépôt et à la diffusion de documents scientifiques de niveau recherche, publiés ou non, émanant des établissements d’enseignement et de recherche français ou étrangers, des laboratoires publics ou privés.
Influence of modelled soil biogenic NO emissions on
related trace gases and the atmospheric oxidizing
efficiency
J. Steinkamp, L. N. Ganzeveld, W. Wilcke, M. G. Lawrence
To cite this version:
J. Steinkamp, L. N. Ganzeveld, W. Wilcke, M. G. Lawrence. Influence of modelled soil biogenic NO emissions on related trace gases and the atmospheric oxidizing efficiency. Atmospheric Chemistry and Physics Discussions, European Geosciences Union, 2008, 8 (3), pp.10227-10255. �hal-00304213�
ACPD
8, 10227–10255, 2008Modelled NO soil emissions, related
trace gases and oxidizing efficiency J. Steinkamp et al. Title Page Abstract Introduction Conclusions References Tables Figures ◭ ◮ ◭ ◮ Back Close Full Screen / Esc
Printer-friendly Version Interactive Discussion Atmos. Chem. Phys. Discuss., 8, 10227–10255, 2008
www.atmos-chem-phys-discuss.net/8/10227/2008/ © Author(s) 2008. This work is distributed under the Creative Commons Attribution 3.0 License.
Atmospheric Chemistry and Physics Discussions
Influence of modelled soil biogenic NO
emissions on related trace gases and the
atmospheric oxidizing efficiency
J. Steinkamp1, L. N. Ganzeveld2, W. Wilcke3, and M. G. Lawrence1
1
Department of Atmospheric Chemistry, Max-Planck-Institute for Chemistry, Mainz, Germany
2
Department of Environmental Sciences, Chairgroup Earth System Sciences, Wageningen University and Research Centre, Wageningen, Netherlands
3
Geographic Institute, Johannes Gutenberg University, Mainz, Germany Received: 22 April 2008 – Accepted: 2 May 2008 – Published: 30 May 2008 Correspondence to: J. Steinkamp ([email protected])
ACPD
8, 10227–10255, 2008Modelled NO soil emissions, related
trace gases and oxidizing efficiency J. Steinkamp et al. Title Page Abstract Introduction Conclusions References Tables Figures ◭ ◮ ◭ ◮ Back Close Full Screen / Esc
Printer-friendly Version Interactive Discussion
Abstract
The emission of nitric oxide (NO) by soils (SNOx) is an important source of oxides of nitrogen (NOx=NO+NO2) in the troposphere, with estimates ranging from 4 to 21 Tg
of nitrogen per year. Previous studies have examined the influence of SNOx on ozone (O3) chemistry. We employ the ECHAM5/MESSy earth system model to go further in
5
the reaction chain and investigate the influence of SNOx on lower tropospheric NOx,
O3, peroxyaceltyl nitrate (PAN), nitric acid (HNO3), the hydroxyl radical (OH) and the lifetime of methane (τCH4). We show that SNOx is responsible for a significant
contri-bution to the NOx mixing ratio in many regions, especially in the tropics. On the other
hand in some regions SNOx has a negative feedback on the lifetime of NOx through
10
O3and OH, which results in regional increases in the mixing ratio of NOxdespite lower total emissions in a simulation without SNOx. Furthermore, the concentration of OH is substantially increased due to SNOx, resulting in an enhanced oxidizing efficiency of the global troposphere, reflected in a ∼10% decrease in τCH4due to soil NO emissions.
1 Introduction
15
Nitric oxide (NO) in the soil is produced by the microbial processes of nitrification and denitrification (Firestone and Davidson,1989). The NO emission originates from a nat-ural pool of nitrogen and a fraction from fertilizer application (Yienger and Levy II,1995;
Stehfest and Bouwman,2006). The estimates of NO emitted yearly by soils (hereafter called SNOx) ranges from 4 to 21 Tg(N) (Yienger and Levy II, 1995; Davidson and
20
Kingerlee, 1997, and references therein). NO reacts rapidly with other atmospheric compounds, establishing an equilibrium between NO and nitric dioxide (NO2). These
two species are frequently refered to the oxides of nitrogen (NOx). SNOx is topped by the anthropogenic combustion of fossil fuels (20–24Tg(N)yr ) (Holland et al., 1999) and is comparable to the production of NOx from lightning and biomass burning, but
25
dom-ACPD
8, 10227–10255, 2008Modelled NO soil emissions, related
trace gases and oxidizing efficiency J. Steinkamp et al. Title Page Abstract Introduction Conclusions References Tables Figures ◭ ◮ ◭ ◮ Back Close Full Screen / Esc
Printer-friendly Version Interactive Discussion inant source of NOx. Through reactions, deposition and stomatal uptake directly within
the vegetation layer not all NO emitted by the soil escapes the canopy layer as NOx
(Yienger and Levy II,1995;Ganzeveld et al.,2002b). In this work SNOx refers to the flux from the vegetation to the atmosphere. The fraction of NOx that reaches the at-mosphere reacts as a catalyst for production of ozone (O3), one of the greenhouse
5
gases. This O3 production is driven by the oxidation of carbon monoxide (CO) and
volatile organic compounds (VOC), if the concentration of NO is higher than about 5– 30 pmolmol (Brasseur et al., 1999). Atmospheric NOx is also involved in the production of the hydroxyl radical (OH), which is responsible for the oxidation and depletion of methane (CH4), another greenhouse gas. Beyond these climate related issues, high
10
NOx mixing ratios also have a direct impact on human health. NOx is removed from the atmosphere by reaction with hydroxyl radicals (OH) or oxidation to dinitrogen pen-taoxide (N2O5) and subsequent deposition as nitric acid (HNO3). It can also react with
organic tracers to form peroxyl nitrates, mainly peroxyacetyl nitrate (PAN), which, once it is lifted to higher altitudes, can be transported over large distances releasing NOx
15
when it is transported back downward again.
Previous model studies of the influence of SNOx on atmospheric chemistry mainly focused either on the NOx source itself, or on O3, mostly on a regional scale. Jaegl ´e
et al. (2005) examined the global partitioning of NOxsources using inverse modelling
and the space-based NO2 column derived by GOME (Global Ozone Monitoring
Ex-20
periment). Their a posteriori SNOx (8.9Tg(N)yr ) is 68% greater than their a priori SNOx (5.3Tg(N)yr ). Based on this,Jaegl ´e et al.(2005) suggest that the influence of SNOx on background O3could be underestimated in current chemistry transport models (CTMs).
Bertram et al.(2005) come to a similar conclusion by inverse modelling using another satellite sensor (SCIAMACHY) above the western United States, computing an
under-25
estimation of 60%. Delon et al.(2007) modelled higher O3 concentrations with higher SNOx above Western Africa. For Europe,Simpson(1995) found that SNOx hardly has any influence on controling the O3mixing ratio.Isaksen and Hov(1987) already
ACPD
8, 10227–10255, 2008Modelled NO soil emissions, related
trace gases and oxidizing efficiency J. Steinkamp et al. Title Page Abstract Introduction Conclusions References Tables Figures ◭ ◮ ◭ ◮ Back Close Full Screen / Esc
Printer-friendly Version Interactive Discussion on the oxidizing efficiency through an increase in OH concentration with increased NOx
emissions, but they neglected SNOx.
In this study, we take these analyses a step further and follow the reaction chain from SNOx through O3 and OH to its global influence on the oxidizing efficiency of the atmosphere. To do so, we compare two model runs with a state-of-the-art global
5
3-D global chemistry climate model. One is a simulation with all relevant emissions and reactions (BASE), and the second simulation is without SNOx (NOBIONO = “No biogenic NO”). We expect a considerable influence of SNOx on the mixing ratios and distribution of related global tropospheric trace gases (NOx, PAN, HNO3, O3and OH).
Furthermore the global oxidizing efficiency, indicated by the lifetime of CH4 (τCH4), is
10
expected to decrease (τCH
4 increases) if we exclude NOx emission from soils.
In the following section we briefly describe the model setup. We then compare the relevant tracer mixing ratios from the BASE simulation versus the NOBIONO simula-tion. In the final section we present our conclusions and outlook.
2 Model description and setup
15
For this study the Modular Earth Submodel System version 1.2 (MESSy) coupled to the general circulation model ECHAM5 is employed. MESSy connects, through a standardized interface, submodels for different processes with bidirectional feedbacks (J ¨ockel et al., 2005, 2006). The meteorology for these simulations is driven by sea surface temperature (SST) from the AMIPIIb dataset (Taylor et al.,2000). The
calcula-20
tion of SNOx in the BASE simulation is based on the algorithm ofYienger and Levy II
(1995), which is the most widely used SNOx algorithm in CTMs (Ganzeveld et al.,
2002a; Jaegl ´e et al., 2005; Delon et al., 2007). This calculation is performed in the submodel EMDEP (Ganzeveld et al.,2006). NOx produced by lightning is calculated in the submodel LNOX (2.2Tg(N)yr ). The remaining sources of NOx (49Tg(N)yr ) are read
25
in from the offline EDGAR database (Olivier et al., 1994) by the submodel OFFLEM (Kerkweg et al.,2006). Other relevant emissions are calculated either by the EMDEP
ACPD
8, 10227–10255, 2008Modelled NO soil emissions, related
trace gases and oxidizing efficiency J. Steinkamp et al. Title Page Abstract Introduction Conclusions References Tables Figures ◭ ◮ ◭ ◮ Back Close Full Screen / Esc
Printer-friendly Version Interactive Discussion or OFFLEM submodel.
A model spinup time of eleven months (Janurary–November 1994) was chosen and the data of the period December 1994–December 1995 is analysed here. To achieve an identical meteorology of both simulations feedback through trace gases and water vapor is switched off. Table1recapitulates the setup of the two simulations.
5
3 Results and discussion
The emission of NO from soils in the BASE simulation accounts for 15% of the to-tal annual global NO emissions (Table2). The interannual variability of SNOx is low in the model (Steinkamp,2007). The largest emissions are calculated for tropical re-gions. During JJA there are some exceptions further north in northern America, Europe
10
and north-eastern China. These are fertilizer induced emissions in agricultural regions (Fig.1and Table2).
The data is analysed by season with a focus on the winter and summer season. There is a notable seasonal variation with larger SNOx in the summer period of each hemisphere and with a larger contribution of SNOx to the total NO emissions during the
15
northern hemispheric spring and summer (Table2). The first point can be explained by the temperature dependence and the second one by the greater landmasses in the Northern Hemisphere. In the northern mid-latitudes SNOx plays a less important role relative to other NOxemissions, except during the JJA period.
3.1 Influence of SNOx on related trace gases
20
The column mean mixing ratios of NOx, PAN, HNO3and O3and the column mean
con-centration of OH in the gridcells (weighted by the air mass in the gridcells) in the lower troposphere (below 500 hPa; hereafter “LT”) from the BASE simulation are compared with the values from the NOBIONO simulation.
As expected, in the LT the difference between the NOx column mean mixing ratio in
25
ACPD
8, 10227–10255, 2008Modelled NO soil emissions, related
trace gases and oxidizing efficiency J. Steinkamp et al. Title Page Abstract Introduction Conclusions References Tables Figures ◭ ◮ ◭ ◮ Back Close Full Screen / Esc
Printer-friendly Version Interactive Discussion all regions (Table3). A low correlation is computed for the Northern Hemisphere during
DJF, as could be expected due to the small SNOx compared to the anthropogenic emissions.
In the low-latitudes and in the northern mid-latitudes the correlation between SNOx and the difference in the PAN column mean mixing ratio of the two simulations is low
5
(Table 3). This is likely due to the stronger dependence of PAN formation on VOC mixing ratios than on NOx mixing ratios (Singh et al., 1986). In contrast, there is a
much better correlation in the southern mid-latitudes between the difference in the LT PAN column mixing ratio and SNOx. This suggests a dominating role of NOx in the
formation of PAN in the mid-latitudes of the Southern Hemisphere. This hypothesis is
10
partially confirmed by the calculation of the correlation coefficient of the difference in the PAN column mixing ratio with SNOx up to a lower altitude (750 hPa). R2increases slightly for the northern mid- and low-latitudes and stays nearly the same for the south-ern mid-latitudes (Table3). In the low-latitudes, convective downdrafts and subsiding airmasses, combined with the strong temperature dependence of the decomposition
15
of PAN decreases the correlation.
The correlation between SNOx and the difference in the LT O3column mean mixing
ratio is lower than for NOx. This is partly due to the longer lifetime of O3, which is better
mixed in the LT. Furthermore the production of O3is not only determined by the NOx
mixing ratio, but also by the concentration of VOC. The correlation of the OH column
20
mean concentration difference in the LT with SNOx is similar to O3. OH is a very short
lived tracer, whose production depends on the one hand on the photolysis of O3 and
the water vapor concentration and on the other hand on the reaction of NO with HO2 in the troposphere. This results, depending on the dominating reaction, in a higher or lower correlation of the OH column concentration difference versus SNOx than the O3
25
ACPD
8, 10227–10255, 2008Modelled NO soil emissions, related
trace gases and oxidizing efficiency J. Steinkamp et al. Title Page Abstract Introduction Conclusions References Tables Figures ◭ ◮ ◭ ◮ Back Close Full Screen / Esc
Printer-friendly Version Interactive Discussion 3.1.1 NOx
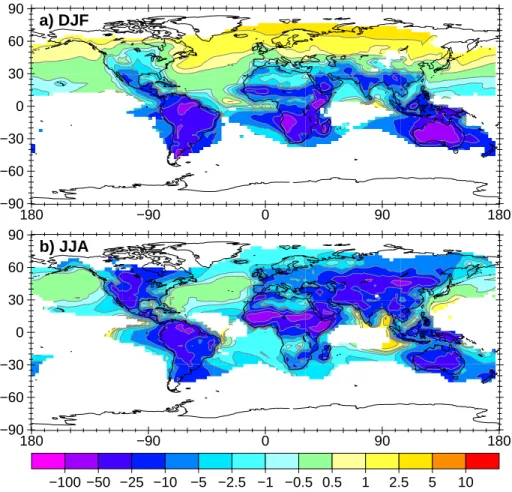
The global mean mixing ratio of NOx in the LT during DJF decreases by 6% in the NOBIONO simulation compared to the BASE simulation. During JJA it decreases by 12%. In both cases the decrease in the mixing ratio is less than the contri-bution of SNOx (12% and 17% respectively). The maximum decrease is 78% in
5
DJF and 68% in JJA, while the maximum absolute decreases in the DJF and JJA periods are 139 and 209 pmolmol, respectively (figures with absolute differences can be found in the supplement: http://www.atmos-chem-phys-discuss.net/8/10227/2008/
acpd-8-10227-2008-supplement.pdf).
Interestingly, during DJF the mixing ratio above large parts of the Northern
Hemi-10
sphere even increases by up to 3.5% (Fig.2a), with the largest absolute increase of 15.2pmolmol above Europe. In the JJA period the maximum relative increase of 4.8% is larger than in the DJF period, but the maximum absolute difference is only 3.0pmolmol
(Fig.2b).
A similar result has been noted for model sensitivity simulations with and without
15
NOx from lightning (Stockwell et al.,1999;Labrador et al.,2005), in which a decrease
in near surface NOx mixing ratios was computed for similar regions with increasing
production of NOx by lightning. Although NOx produced by lightning is formed in the free troposphere and SNOx originates from the surface, we achieve comparable results with SNOx. To explain why the NOx mixing ratio decreases less than the relative
de-20
crease in the emission of the NOBIONO simulation compared to the BASE simulation, and why it increases during the DJF period in large areas in the Northern Hemisphere, the feedback through O3and OH has to be taken into account. Stockwell et al.(1999)
assumed that the general increase in O3with lightning NOxcauses an increase in OH. This OH reduces the lifetime of NOx(τNOx) through Eq. (1) above regions with high
non-25
lightning NOxsources.Labrador et al.(2005) showed that the conversion to HNO3via
N2O5also contributes to the shorter τNO
x (Eq.2) with higher NOxemissions.
ACPD
8, 10227–10255, 2008Modelled NO soil emissions, related
trace gases and oxidizing efficiency J. Steinkamp et al. Title Page Abstract Introduction Conclusions References Tables Figures ◭ ◮ ◭ ◮ Back Close Full Screen / Esc
Printer-friendly Version Interactive Discussion NO2+ O3→ NO3+ O2 (2a) NO3+ NO2→ N2O5 (2b) N2O5+ H2O → 2 HNO3 (2c) 5 2 NO2+ O3+ H2O → 2 HNO3+ O2 (2)
Similarly we find that without SNOx, O3and OH levels decrease, resulting in enhanced
τNO
x, and due to Eqs. (1) and (2) the NOx mixing ratio increases in regions with low
SNOx. The changes in HNO3, O3and OH related to this are discussed in the following
10
sections.
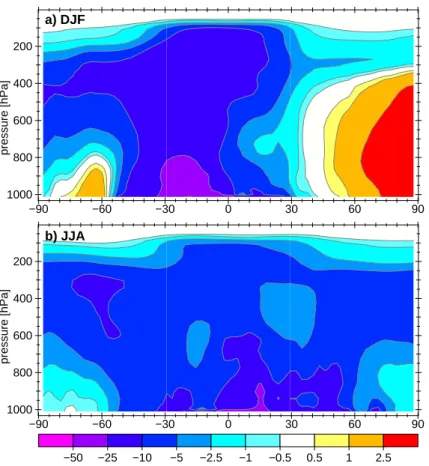
In the vertical direction the strongest effects of SNOx are simulated near the sur-face (DJF: 53%, JJA: 42%), and a decrease of up to 10 to 25% for higher altitudes in the zonal mean is calculated if SNOx was switched off (Fig.3). The effect of con-vective transport to higher altitudes has a stronger influence on the difference in the
15
total burden between 500 and 250 hPa during DJF (relative: 11.3%, absolute: 1.85 Gg) than during JJA (relative: 6.5%, absolute: 1.22 Gg). This is because the main regions, where the convective transport is most effective, are in the Southern Hemisphere es-pecially the Amazon Basin and the southern tropics of Africa (not shown).
3.1.2 PAN
20
The LT PAN mixing ratio decreases globally by 4% during DJF and 8% during JJA without SNOx. In both periods the PAN mixing ratio decreases nearly everywhere above the continents (Fig.4). Above the tropical oceans, especially during JJA, there is a high relative but a negligible absolute increase in the PAN mixing ratio associated with a decrease in SNOx. As mentioned above, the formation of PAN in the northern
mid-25
and low latitudes relies more on VOC than on NOx, but more on NOx in the southern mid-latitudes. This explains the larger decrease during DJF than during JJA. There is
ACPD
8, 10227–10255, 2008Modelled NO soil emissions, related
trace gases and oxidizing efficiency J. Steinkamp et al. Title Page Abstract Introduction Conclusions References Tables Figures ◭ ◮ ◭ ◮ Back Close Full Screen / Esc
Printer-friendly Version Interactive Discussion also no increase of PAN in the Northern Hemisphere during DJF despite higher NOx
mixing ratios, which confirms a dominating role of VOC in PAN formation.
Interestingly, in the upper troposphere between 500 hPa and 250 hPa the largest decrease in the PAN mixing ratio is during DJF (7%), whereas it is 5% during JJA. In the zonal mean of the relative difference in PAN mixing ratio with and without SNOx
5
(Fig.5), the effect of convective transport in the lower latitudes is more effective during DJF than during JJA. At the higher altitudes PAN does not increase anymore, due to its longer lifetime resulting in better mixing.
The differences in the PAN mixing ratio should be interpreted with caution, because the model generally overestimates its levels compared to observations (J ¨ockel et al.,
10
2006), though this may improve with a new isoprene oxidation scheme (Butler, personal communication).
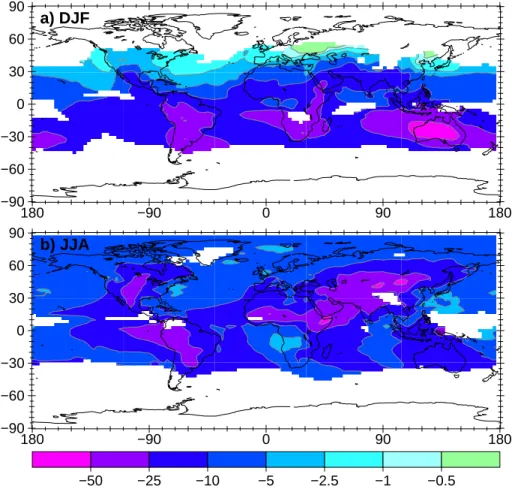
3.1.3 HNO3
The global LT mixing ratio of HNO3 decreases by 16% (DJF) and 15% (JJA) without
SNOx. The greatest decrease occurs above continental regions of the low-latitudes
15
and in the summer months in the Northern Hemisphere (Fig.6). The larger decrease in the mixing ratio of HNO3compared to the decrease of NOx mixing ratio is because
the formation of HNO3 is not only determined by the NOx mixing ratio, but also relies
on the mixing ratios of O3and OH, which also decrease, as discussed in the following sections.
20
Nitric acid is mainly deposited on aerosol particles, taken up by cloud water or di-rectly deposited on the earth’s surface. The deposition of HNO3 is decreased by 14% throughout the year without SNOx. During DJF the decrease is 12% and during JJA it is 15%.
3.1.4 O3
25
The mixing ratio of O3in the NOBIONO simulation compared to the BASE simulation
conti-ACPD
8, 10227–10255, 2008Modelled NO soil emissions, related
trace gases and oxidizing efficiency J. Steinkamp et al. Title Page Abstract Introduction Conclusions References Tables Figures ◭ ◮ ◭ ◮ Back Close Full Screen / Esc
Printer-friendly Version Interactive Discussion nents (Fig.7). The maximum relative decrease during DJF is 37% and during JJA it is
28%. The maximum absolute decrease (17.6nmolmol) occurs during DJF above Australia (Fig. 7a). In contrast to what was found for NOx, there is no region with increasing
O3 mixing ratios. The decrease of the NOx mixing ratio in the LT during JJA (12%) is
less effective in reducing the O3mixing ratio than the decrease in the NOxmixing ratio
5
during DJF (6%). This is because the formation of O3 through SNOx competes with
other strong sources of NOx during JJA in the Northern Hemisphere, whereas SNOx
is relatively much more important for the formation of O3 during DJF in the Southern Hemisphere. Furthermore, as was noted above for the PAN formation in the Northern Hemisphere the simulated O3production may be more dependent on VOC than NOx.
10
In the zonal mean distribution (not shown) a similar pattern of the influence of con-vection can be seen as already discussed for NOx and PAN. But due to the longer
lifetime of O3the relative change has only a maximum of 17% in DJF and 14% in JJA.
These changes are smaller than for NOx and are more evenly distributed above all latitudes and also in the vertical direction. In the vertical direction there is, as with the
15
horizontal, no increase in the O3mixing ratio throughout the troposphere.
3.1.5 OH
Excluding the contribution of SNOx, the mean OH concentration declines by 10% dur-ing DJF and 8% durdur-ing JJA in the LT. The largest relative decrease is 58% durdur-ing DJF and 42% during JJA above the tropical land regions. During DJF the decrease is
20
shifted to the southern tropics and to the northern tropics during JJA (Fig.8). Note that during JJA an absolute increase above the Antarctic region is calculated, but the OH concentration here is less than 1×10⁴ moleccm3 .
The decrease is on the one hand induced directly by NOx through Eq. (3), and on
the other hand indirectly by the lower O3mixing ratio, leading to less primary OH
pro-25
duction, and therefore in a decrease of the OH concentration in the LT.
ACPD
8, 10227–10255, 2008Modelled NO soil emissions, related
trace gases and oxidizing efficiency J. Steinkamp et al. Title Page Abstract Introduction Conclusions References Tables Figures ◭ ◮ ◭ ◮ Back Close Full Screen / Esc
Printer-friendly Version Interactive Discussion The largest relative decrease in the zonal mean concentration of OH is 18% during DJF
and 14% during JJA. This maximum of the relative decrease in the OH concentration without SNOx is nearly detached from the surface, despite the surface source of SNOx (Fig.9). At the surface OH production is mainly related to the reaction of O(1D) with water, while at higher altitudes it depends more on the reaction of NO with HO2(Eq.3).
5
In the zonal mean the shift to the Southern Hemisphere during DJF is stronger than the shift during JJA to the Northern Hemisphere.
3.2 Influence of SNOx on the oxidizing efficiency
The oxidation of CO and VOC in the atmosphere is mainly driven by OH. As a measure for the oxidizing efficiency of the atmosphere, τCH4 is calculated for both simulations
10
according toLawrence et al.(2001). The trend of monthly mean values is depicted in Fig.10. The mean τCH4averaged for one year (December 1994 to November 1995) for
the BASE simulation is 7.26 years and 7.93 years for the NOBIONO simulation, a 9.2% increase without SNOx. The maximum prolongation of 0.89 years occurs in December 1994 (10.3%) and January 1995 (10.4%).
15
The changes in τCH
4 are not equally distributed over the globe. In the southern and
low-latitudes the relative influence is noticeably greater than in the northern latitudes (Fig. 11). This agrees with the smaller relative change in the OH concentration in the northern latitudes (Fig.8). In the vertical direction, the relative changes are slightly larger above 500 hPa, even though the origin of SNOx is at the surface. Beginning from
20
the surface source of SNOx and following the reaction chain from NOxover O3and OH
in each step, the relative difference of our two simulations becomes smaller near the surface and larger at higher altitudes. This trend corroborates the larger relative change of the oxidizing efficiency at higher altitudes. However, only ∼15% of the absolute amount of CH4in the troposphere is oxidized above 500 hPa (Lawrence et al.,2001).
25
Labrador et al. (2004) modelled a decrease of 15% in τCH4 in a simulation with
5 Tg(N) NOx produced by lightning relative to one with no lightning NOx. Compared
atmo-ACPD
8, 10227–10255, 2008Modelled NO soil emissions, related
trace gases and oxidizing efficiency J. Steinkamp et al. Title Page Abstract Introduction Conclusions References Tables Figures ◭ ◮ ◭ ◮ Back Close Full Screen / Esc
Printer-friendly Version Interactive Discussion sphere, which is interesting, given that CH4oxidation is more effective near the surface
where SNOx is emitted, due to the strong temperature dependence of the reaction of OH with CH4. The change in the oxidizing efficiency due to lightning NOx is larger
than due to SNOx, even though the total emission rate is lower. This is because at higher altitudes the NO:NO2 ratio is greater, so that with more NO the NOx lifetime is
5
not diminished as strongly as near the surface. Furthermore at higher altitudes more NO results in higher OH yields by reaction with HO2.
4 Conclusions and outlook
The emission of NO from soils plays an important role for chemical reactions in the atmosphere. Lower global mean NOx mixing ratios without SNOx lead to lower global
10
O3 mixing ratios in the LT. The lower O3 mixing ratios result in lower OH
concentra-tions. This results in an enhanced lifetime of NOx in regions with other dominating
sources of NOx. Hence the NOxmixing ratios increases in some regions, despite lower emissions when SNOx is neglected in our NOBIONO simulation. From this it follows, that although NOx is a short-lived tracer it indirectly influences chemical processes in
15
regions with low SNOx through feedback with O3 and OH. By following the reaction chain up to PAN and HNO3, we detected a dominating role of SNOx compared to VOC
in the mid-latitudes of the Southern Hemisphere. Also by following the reaction chain (SNOx→NOx→O3→OH), the magnitude of relative effects are shifted step by step to
higher altitudes in the troposphere.
20
Through reaction of NO with HO2SNOx is directly involved in the production of OH.
SNOx also has, through O3, an indirect influence on OH production. With OH formed
by SNOx through these pathways τCH
4 is decreased considerably, and the influence of
SNOx on the tropospheric oxidizing efficiency is considerable, in the range of 10%. The notable modelled influence of SNOx on directly and indirectly related trace gases
25
shown in this work supports further efforts to improve the parameterization of SNOx in CTMs, as also proposed byJaegl ´e et al.(2005).
ACPD
8, 10227–10255, 2008Modelled NO soil emissions, related
trace gases and oxidizing efficiency J. Steinkamp et al. Title Page Abstract Introduction Conclusions References Tables Figures ◭ ◮ ◭ ◮ Back Close Full Screen / Esc
Printer-friendly Version Interactive Discussion Acknowledgements. We appreciate the help of the the modellers and the MESSy team,
espe-cially T. Butler, P. J ¨ockel, R. Sander, M. Tanarhte and H. Tost. We acknowlegde the International Max Planck Research School on Atmospheric Chemistry and Physics for financial support.
References
Bertram, T. H., Heckel, A., Richter, A., Burrows, J. P., and Cohen, R. C.: Satellite measurements 5
of daily variations in soil NOx emissions, Geophys. Res. Lett., 32, L24 812, doi:10.1029/ 2005GL024640, 2005.10229
Brasseur, G. P., Orlando, J. J., and Tyndall, G. S. (Eds.): Atmospheric chemistry and global change, Oxford University Press, New York, 1999.10229
Davidson, E. A. and Kingerlee, W.: A global inventory of nitric oxide emissions from soils, Nutr. 10
Cycl. Agroecosys., 48, 37–50, 1997.10228
Delon, C., Reeves, C. E., Stewart, D. J., Serc¸a, D., Dupont, R., Mari, C., Chaboureau, J.-P., and Tulet, P.: Biogenic nitrogen oxide emissions from soils – impact on NOxand ozone over West Africa during AMMA (African Monsoon Multidisciplinary Experiment): modelling study, Atmos. Chem. Phys., 8, 2351–2363, 2008,
15
http://www.atmos-chem-phys.net/8/2351/2008/. 10229,10230
Firestone, M. K. and Davidson, E. A.: Mikrobiological basis of NO and N2O production and consumption in soil, In: Exchange of trace gases between terrestrial ecosystems and the atmosphere, Edited by: Andreae, M. O. and Schimel, D. S., 7–21, 1989.10228
Ganzeveld, L. N., Lelieveld, J., Dentener, F. J., Krol, M. C., Bouwman, A. F., and Roelofs, G.-J.: 20
Global soil-biogenic NOx emissions and the role of canopy processes, J. Geophys. Res., 107, 4321, doi:10.1029/2001JD001289, 2002a.10230
Ganzeveld, L. N., Lelieveld, J., Dentener, F. J., Krol, M. C., and Toelofs, G.-J.: Atmosphere-biosphere trace gas exchanges simulated with a single-column model, J. Geophys. Res., 107, 4320, doi:10.1029/2001JD000684, 2002b.10229
25
Ganzeveld, L. N., van Aardenne, J. A., Butler, T. M., Lawrence, M. G., Metzger, S. M., Stier, P., Zimmermann, P., and Lelieveld, J.: Technical Note: Anthropogenic and natural offline emissions and the online EMissions and dry DEPosition submodel EMDEP of the Modular Earth Submodel system (MESSy), Atmos. Chem. Phys. Discuss., 6, 5457–5483, 2006,
http://www.atmos-chem-phys-discuss.net/6/5457/2006/. 10230,10242
ACPD
8, 10227–10255, 2008Modelled NO soil emissions, related
trace gases and oxidizing efficiency J. Steinkamp et al. Title Page Abstract Introduction Conclusions References Tables Figures ◭ ◮ ◭ ◮ Back Close Full Screen / Esc
Printer-friendly Version Interactive Discussion
Holland, E. A., Dentener, F. J., Brasswell, B. H., and Sulzman, J. M.: Contemporary and pre-industrial global reactive nitrogen budgets, Biogeochemistry, 46, 7–43, 1999. 10228
Isaksen, I. S. A. and Hov, Ø.: Calculation of trends in the tropospheric concentration of O3, OH, CO, CH4and NOx, Tellus, 39B, 271–285, 1987. 10229
Jaegl ´e, L., Steinberger, L., Martin, R. V., and Chance, K.: Global partitioning of NOx sources
5
using satellite observations: relative roles of fossil fuel combustion, biomass burning and soil emissions, Faraday Discuss., 130, 407–423, 2005.10229,10230,10238
J ¨ockel, P., Sander, R., Kerkweg, A., Tost, H., and Lelieveld, J.: Technical Note: The Modular Earth Submodel System (MESSy) – a new approach towards Earth System Modeling, At-mos. Chem. Phys., 5, 433–444, 2005,http://www.atmos-chem-phys.net/5/433/2005/. 10230
10
J ¨ockel, P., Tost, H., Pozzer, A., Br ¨uhl, C., Buchholz, J., Ganzeveld, L., Hoor, P., Kerk-weg, A., Lawrence, M. G., Sander, R., Steil, B., Stiller, G., Tanarhte, M., Taraborrelli, D., van Aardenne, J., and Lelieveld, J.: The atmospheric chemistry general circulation model ECHAM5/MESSy1: consistent simulation of ozone from the surface to the mesosphere, At-mos. Chem. Phys., 6, 5067–5104, 2006,
15
http://www.atmos-chem-phys.net/6/5067/2006/. 10230,10235,10242
Kerkweg, A., Sander, R., Tost, H., and J ¨ockel, P.: Technical Note: Implementation of prescribed (OFFLEM), calculated (ONLEM) and pseudo-emissions (TNUDGE) of chemical species in the modular earth submodel system (MESSy), Atmos. Chem. Phys., 6, 3603–3609, 2006,
http://www.atmos-chem-phys.net/6/3603/2006/. 10230,10242
20
Labrador, L., von Kuhlmann, R., and Lawrence, M. G.: The effects of lightning-produced NOx and its vertical distribution on atmospheric chemistry: sensitivity simulations with MATCH-MPIC, Atmos. Chem. Phys., 5, 1815–1834, 2005,
http://www.atmos-chem-phys.net/5/1815/2005/. 10233
Labrador, L. J., von Kuhlmann, R., and Lawrence, M. G.: Strong sensitivity of the global mean 25
OH concentration and the tropospheric oxidizing efficency to the source of NOx from light-ning, Geophys. Res. Lett., 31, L06 102, doi:10.1029/2003GL019229, 2004. 10237
Lawrence, M. G., J ¨ockel, P., and von Kuhlmann, R.: What does the global mean OH concen-tration tell us?, Atmos. Chem. Phys., 1, 37–49, 2001,
http://www.atmos-chem-phys.net/1/37/2001/. 10237,10254,10255
30
Olivier, J. G. J., Bouwman, A. F., Vandermaas, C. W. M., and M, B. J. J.: Emission database for global atmospheric research (EDGAR), Environ. Monit. Assess., 31, 93–106, 1994. 10230
ACPD
8, 10227–10255, 2008Modelled NO soil emissions, related
trace gases and oxidizing efficiency J. Steinkamp et al. Title Page Abstract Introduction Conclusions References Tables Figures ◭ ◮ ◭ ◮ Back Close Full Screen / Esc
Printer-friendly Version Interactive Discussion
atmospheric chemistry module MECCA, Atmos. Chem. Phys., 5, 445–450, 2005,
http://www.atmos-chem-phys.net/5/445/2005/. 10242
Simpson, D.: Biogenic emissions in Europe: 2. Implications for ozone control strategies, J. Geophys. Res., 100, 22 891–22 906, 1995.10229
Singh, H. B., Salas, L. J., and Viezee, W.: Global distribution of peroxyacetyl nitrate, Nature, 5
321, 588–591, 1986. 10232
Stehfest, E. and Bouwman, L.: N2O and NO emission from agricultural fields and soils under natural vegetation: summarizing available measurement data and modeling of global annual emissions, Nutr. Cycl. Agroecosys., 24, 207–228, 2006.10228
Steinkamp, J.: Globale Stickstoffmonoxid-Emissionen aus dem Boden: Literaturauswertung 10
und Evaluierung des Modells ECHAM5/MESSy, Diploma thesis, Johannes-Gutenberg Uni-versity, Mainz/Germany, 2007. 10231
Stockwell, D. Z., Giannakopoulos, C., Plantevin, P.-H., Carver, G. D., Chipperfield, M. P., Law, K. S., Pyle, J. A., Shallcross, D. E., and Wang, K.-Y.: Modelling NOx from lightning and its impact on global chemical fields, Atmos. Environ., 33, 4477–4493, 1999.10233
15
Taylor, K., Williamson, D., and Zwiers, F.: The sea surface temperature and sea ice concentra-tion boundary condiconcentra-tions for AMIP II simulaconcentra-tions; PCMDI Report, Tech. Rep. 60, Program for Climate Model Diagnosis and Intercomparison, 2000.10230
Tost, H.: Global Modelling of Cloud, Convection and Precipitation Influences on Trace Gases and Aerosols, Ph.D. thesis, Rheinische Friedrich-Wilhelms-University, Bonn/Germany, 2006. 20
10242
Tost, H., J ¨ockel, P., Kerkweg, A., Sander, R., and Lelieveld, J.: Technical note: A new compre-hensive SCAVenging submodel for global atmospheric chemistry modelling, Atmos. Chem. Phys., 6, 565–574, 2006a.10242
Tost, H., J ¨ockel, P., and Lelieveld, J.: Influence of different convection parameterisations in a 25
GCM, Atmos. Chem. Phys., 5475–5493, 2006b.10242
Tost, H., J ¨ockel, P., and Lelieveld, J.: Lightning and convection parameterization – uncertainties in global modelling, Atmos. Chem. Phys., 4553–4568, 2007. 10242
Yienger, J. J. and Levy II, H.: Empirical model of global soil-biogenic NOx emissions, J. Geo-phys. Res., 100, 11 447–11 464, 1995. 10228,10229,10230
ACPD
8, 10227–10255, 2008Modelled NO soil emissions, related
trace gases and oxidizing efficiency J. Steinkamp et al. Title Page Abstract Introduction Conclusions References Tables Figures ◭ ◮ ◭ ◮ Back Close Full Screen / Esc
Printer-friendly Version Interactive Discussion
Table 1. Setup of the ECHAM5/MESSy model and used submodels.
Horizontal resolution T42 (∼2.8◦
×2.8◦) Vertical resolution L31 (up to 10 hPa)
Internal timestep 20 min
Timestep of output 5 h
Period of simulation 1994–1995
Used submodels Calculation of Literature ref.
CLOUD Clouds and precipitation J ¨ockel et al.(2006)
CONVECT Convection Tost et al.(2006b)
CVTRANS Convective tracer transport Tost(2006)
EMDEPa Emission and deposition Ganzeveld et al.(2006)
JVAL Rates of photolysis J ¨ockel et al.(2006)
LNOX Lightning NOx Tost et al.(2007)
MECCA Chemical atmospheric reactionsb Sander et al.(2005)
OFFLEM Offline emissions Kerkweg et al.(2006)
RAD4ALL Radiation J ¨ockel et al.(2006)
SCAV Wet deposition Tost et al.(2006a)
TNUDGE Tracer nudging Kerkweg et al.(2006)
TROPOP Calculation of the tropopause J ¨ockel et al.(2006)
a
Extended version; soil NO emissions switched off in NOBIONO simulation
b
ACPD
8, 10227–10255, 2008Modelled NO soil emissions, related
trace gases and oxidizing efficiency J. Steinkamp et al. Title Page Abstract Introduction Conclusions References Tables Figures ◭ ◮ ◭ ◮ Back Close Full Screen / Esc
Printer-friendly Version Interactive Discussion
Table 2. Simulated total NOxemissions, SNOx in Tg(N) of the BASE simulation and in brackets relative contribution of SNOx to the total NO emissions for different regions and periods.
Global Low-latitudes Mid-latitudes
(30◦N–30◦S) (30◦N–60◦N) (30◦S–60◦S)
Seasona total soil total soil total soil total soil
DJF 12.53 1.53 (12%) 7.09 1.34 (19%) 4.93 0.06 (1%) 0.46 0.12 (26%) MAM 11.93 2.03 (17%) 6.07 1.60 (26%) 5.40 0.35 (6%) 0.40 0.08 (20%) JJA 13.67 2.34 (17%) 7.04 1.43 (20%) 6.15 0.88 (14%) 0.33 0.04 (12%) SON 13.03 1.81 (14%) 7.33 1.45 (20%) 5.27 0.29 (6%) 0.38 0.07 (18%) All 51.17 7.72 (15%) 27.52 5.82 (21%) 21.76 1.58(7%) 1.57 0.31 (20%) a
DJF = December 1994, January, February 1995; MAM = March, April, May 1995; JJA = June, July, August 1995; SON = September, October, November 1995
ACPD
8, 10227–10255, 2008Modelled NO soil emissions, related
trace gases and oxidizing efficiency J. Steinkamp et al. Title Page Abstract Introduction Conclusions References Tables Figures ◭ ◮ ◭ ◮ Back Close Full Screen / Esc
Printer-friendly Version Interactive Discussion
Table 3. Correlation coefficient (R2) between surface SNOx flux values and the difference (NOBIONO–BASE) of the tracer burden in the overlying lower troposphere (> 500 hPa for all gases and > 750 hPa for PAN values in brackets) by gridcell, both averaged over the corre-sponding period; only gridcells with a land surface fraction of at least 75% were included.
Seasona NOx PAN HNO3 O3 OH NOx PAN HNO3 O3 OH
Global Low-latitudes (N=2462) 30◦N–30◦S (N=646) DJF 0.86 0.53 (0.60) 0.43 0.62 0.58 0.68 0.17 (0.25) 0.18 0.29 0.22 MAM 0.90 0.47 (0.53) 0.60 0.58 0.64 0.79 0.14 (0.24) 0.42 0.29 0.33 JJA 0.82 0.27 (0.35) 0.37 0.37 0.43 0.69 0.07 (0.07) 0.15 0.21 0.22 SON 0.86 0.44 (0.52) 0.43 0.55 0.58 0.66 0.14 (0.24) 0.07 0.14 0.14 Year 0.88 0.46 (0.54) 0.51 0.56 0.60 0.72 0.11 (0.23) 0.16 0.19 0.21
Northern Mid-latitudes Southern
30◦N–60◦N (N=637) 30◦S–60◦S (N=46) DJF 0.55 0.02 (0.09) 0.40 0.07 0.31 0.80 0.45 (0.45) 0.62 0.67 0.39 MAM 0.82 0.19 (0.30) 0.43 0.20 0.27 0.76 0.71 (0.60) 0.45 0.70 0.59 JJA 0.75 0.10 (0.22) 0.26 0.13 0.18 0.83 0.46 (0.51) 0.54 0.46 0.69 AON 0.80 0.09 (0.19) 0.40 0.19 0.32 0.87 0.74 (0.77) 0.65 0.77 0.47 Year 0.77 0.12 (0.23) 0.33 0.16 0.16 0.79 0.66 (0.65) 0.64 0.78 0.56 a
ACPD
8, 10227–10255, 2008Modelled NO soil emissions, related
trace gases and oxidizing efficiency J. Steinkamp et al. Title Page Abstract Introduction Conclusions References Tables Figures ◭ ◮ ◭ ◮ Back Close Full Screen / Esc
Printer-friendly Version Interactive Discussion 180 −90 0 90 180 −90 −60 −30 0 30 60 90 180 −90 0 90 180 −90 −60 −30 0 30 60 90 0 1.25 2.5 3.75 5 6.25 7.5 8.75 a) DJF b) JJA
Fig. 1. Simulated SNOx flux for (a) December 1994 to February 1995 and (b) June to August
ACPD
8, 10227–10255, 2008Modelled NO soil emissions, related
trace gases and oxidizing efficiency J. Steinkamp et al. Title Page Abstract Introduction Conclusions References Tables Figures ◭ ◮ ◭ ◮ Back Close Full Screen / Esc
Printer-friendly Version Interactive Discussion 180 −90 0 90 180 −90 −60 −30 0 30 60 90 180 −90 0 90 180 −90 −60 −30 0 30 60 90 −100 −50 −25 −10 −5 −2.5 −1 −0.5 0.5 1 2.5 5 10 a) DJF b) JJA
Fig. 2. Relative difference (NOBIONO−BASEBASE ×100%) of the lower tropospheric mixing ratio of NOx
in % – values below 30pmolmol in the BASE simulation excluded from calculation – averaged for
ACPD
8, 10227–10255, 2008Modelled NO soil emissions, related
trace gases and oxidizing efficiency J. Steinkamp et al. Title Page Abstract Introduction Conclusions References Tables Figures ◭ ◮ ◭ ◮ Back Close Full Screen / Esc
Printer-friendly Version Interactive Discussion −90 −60 −30 0 30 60 90 200 400 600 800 1000 −90 −60 −30 0 30 60 90 200 400 600 800 1000 pressure [hPa] −50 −25 −10 −5 −2.5 −1 −0.5 0.5 1 2.5 pressure [hPa] a) DJF b) JJA
Fig. 3. Zonal mean relative difference (NOBIONO−BASEBASE ×100%) of NOxmixing ratio in % averaged
for (a) December, January, February and (b) June, July and August. Note that the y-axis is linearly scaled, since the focus of this work lies in the lower troposphere.
ACPD
8, 10227–10255, 2008Modelled NO soil emissions, related
trace gases and oxidizing efficiency J. Steinkamp et al. Title Page Abstract Introduction Conclusions References Tables Figures ◭ ◮ ◭ ◮ Back Close Full Screen / Esc
Printer-friendly Version Interactive Discussion 180 −90 0 90 180 −90 −60 −30 0 30 60 90 180 −90 0 90 180 −90 −60 −30 0 30 60 90 −50 −25 −10 −5 −2.5 −1 −0.5 0.5 1 2.5 5 10 a) DJF b) JJA
Fig. 4. Relative difference (NOBIONO−BASEBASE ×100%) of the lower tropospheric mixing ratio of PAN in % – values below 50pmolmol in the BASE run excluded from calculation – averaged for (a) December, January, February and (b) June, July and August.
ACPD
8, 10227–10255, 2008Modelled NO soil emissions, related
trace gases and oxidizing efficiency J. Steinkamp et al. Title Page Abstract Introduction Conclusions References Tables Figures ◭ ◮ ◭ ◮ Back Close Full Screen / Esc
Printer-friendly Version Interactive Discussion −90 −60 −30 0 30 60 90 200 400 600 800 1000 −90 −60 −30 0 30 60 90 200 400 600 800 1000 pressure [hPa] −25 −10 −5 −2.5 −1 −0.5 0.5 1 2.5 5 pressure [hPa] a) DJF b) JJA
Fig. 5. Zonal mean relative difference (NOBIONO−BASEBASE ×100%) of PAN mixing ratio in % averaged for (a) December, January, February and (b) June, July and August.
ACPD
8, 10227–10255, 2008Modelled NO soil emissions, related
trace gases and oxidizing efficiency J. Steinkamp et al. Title Page Abstract Introduction Conclusions References Tables Figures ◭ ◮ ◭ ◮ Back Close Full Screen / Esc
Printer-friendly Version Interactive Discussion 180 −90 0 90 180 −90 −60 −30 0 30 60 90 180 −90 0 90 180 −90 −60 −30 0 30 60 90 −50 −25 −10 −5 −2.5 −1 −0.5 a) DJF b) JJA
Fig. 6. Relative difference (NOBIONO−BASEBASE ×100%) of the lower tropospheric mixing ratio of HNO3
in % – values below 30pmolmol in the BASE simulation excluded from calculation – averaged for
ACPD
8, 10227–10255, 2008Modelled NO soil emissions, related
trace gases and oxidizing efficiency J. Steinkamp et al. Title Page Abstract Introduction Conclusions References Tables Figures ◭ ◮ ◭ ◮ Back Close Full Screen / Esc
Printer-friendly Version Interactive Discussion 180 −90 0 90 180 −90 −60 −30 0 30 60 90 180 −90 0 90 180 −90 −60 −30 0 30 60 90 −50 −25 −10 −5 −2.5 −1 −0.5 a) DJF b) JJA
Fig. 7. Relative difference (NOBIONO−BASE
BASE ×100%) of the lower tropospheric mixing ratio of O3in
% – values below 25nmol
mol in the BASE simulation excluded from calculation – averaged for (a)
ACPD
8, 10227–10255, 2008Modelled NO soil emissions, related
trace gases and oxidizing efficiency J. Steinkamp et al. Title Page Abstract Introduction Conclusions References Tables Figures ◭ ◮ ◭ ◮ Back Close Full Screen / Esc
Printer-friendly Version Interactive Discussion 180 −90 0 90 180 −90 −60 −30 0 30 60 90 180 −90 0 90 180 −90 −60 −30 0 30 60 90 −100 −50 −25 −10 −5 −2.5 −1 −0.5 a) DJF b) JJA
Fig. 8. Relative difference (NOBIONO−BASEBASE ×100%) of the lower tropospheric concentration of OH in % – values below 104 molec
cm3 in the BASE simulation excluded from calculation – averaged for
ACPD
8, 10227–10255, 2008Modelled NO soil emissions, related
trace gases and oxidizing efficiency J. Steinkamp et al. Title Page Abstract Introduction Conclusions References Tables Figures ◭ ◮ ◭ ◮ Back Close Full Screen / Esc
Printer-friendly Version Interactive Discussion −90 −60 −30 0 30 60 90 200 400 600 800 1000 −90 −60 −30 0 30 60 90 200 400 600 800 1000 pressure [hPa] −10 −5 −2.5 −1 −0.5 −0.25 0.25 0.5 1 2.5 5 10 25 pressure [hPa] a) DJF b) JJA
Fig. 9. Zonal mean relative difference (NOBIONO−BASEBASE ×100%) of OH mixing ratio in % averaged for (a) December, January, February and (b) June, July and August.
ACPD
8, 10227–10255, 2008Modelled NO soil emissions, related
trace gases and oxidizing efficiency J. Steinkamp et al. Title Page Abstract Introduction Conclusions References Tables Figures ◭ ◮ ◭ ◮ Back Close Full Screen / Esc
Printer-friendly Version Interactive Discussion 6.5 7.5 8.5 9.5
Date from Dec 1994 to Dec 1995
τCH
4
in years
Jan Mar May Jul Sep Nov
BASE NOBIONO
Fig. 10. Seasonal cycle of monthly mean lifetime of CH4 from December 1994 to December 1995 in years (calculated according toLawrence et al.,2001).
ACPD
8, 10227–10255, 2008Modelled NO soil emissions, related
trace gases and oxidizing efficiency J. Steinkamp et al. Title Page Abstract Introduction Conclusions References Tables Figures ◭ ◮ ◭ ◮ Back Close Full Screen / Esc
Printer-friendly Version Interactive Discussion
90°S
30°S
30°N
90°N
Surface
500hPa
Tropopause
0.1%
5.9%
10.9%
9.6%
5.6%
12.5%
8.9%
11.4%
250hPa
Fig. 11. Relative increase of τCH
4 (
τCH4,NOBIONO−τCH4,BASE
τCH4,BASE ×100%) in various zonal subdomains of the atmosphere (calculated afterLawrence et al.,2001).