HAL Id: hal-00522360
https://hal-brgm.archives-ouvertes.fr/hal-00522360
Submitted on 30 Sep 2010HAL is a multi-disciplinary open access archive for the deposit and dissemination of sci-entific research documents, whether they are pub-lished or not. The documents may come from teaching and research institutions in France or abroad, or from public or private research centers.
L’archive ouverte pluridisciplinaire HAL, est destinée au dépôt et à la diffusion de documents scientifiques de niveau recherche, publiés ou non, émanant des établissements d’enseignement et de recherche français ou étrangers, des laboratoires publics ou privés.
Palaeoproterozoic gold-rich Ashanti belt, Ghana
Virginie Harcouët, Laurent Guillou-Frottier, Alain Bonneville, Jean-Louis
Feybesse
To cite this version:
Virginie Harcouët, Laurent Guillou-Frottier, Alain Bonneville, Jean-Louis Feybesse. Pre-mineralization thermal evolution of the Palaeoproterozoic gold-rich Ashanti belt, Ghana. Geological Society Special Publication, 2005, 248, pp.103-118. �hal-00522360�
Pre-mineralization thermal evolution of the Palaeoproterozoic gold-rich
Ashanti belt, Ghana
Virginie HARCOUËT1-2, L. GUILLOU-FROTTIER1, A. BONNEVILLE2, and J.L. FEYBESSE1
1: Bureau de Recherches Géologiques et Minières, Orléans, France 2: Institut de Physique du Globe, Paris, France
October, 29th, 2004
Revised version submitted to Geological Society, Special Publications, for the Proceedings of the Fermor Conference on
World Class Mineral Deposits and Earth Evolution, Cardiff, August 2003.
Number of words in the main text: ~ 6050 Number of references: 48
Number of figures: 8 Number of tables: 4
Abbreviated title: Thermal modelling of the Ashanti belt, Ghana
V. Harcouët, L. Guillou-Frottier and J.L. Feybesse: BRGM, Service des Ressources Minérales, 3, av. C. Guillemin, BP 6009, 45060 Orléans Cedex 2, France; v.harcouet@brgm.fr; l.guillou-frottier@brgm.fr; jl.feybesse@brgm.fr
A. Bonneville: IPGP, Laboratoire de Géosciences Marines, 4, Place Jussieu, 75252 Paris Cedex 05, France; bonnevil@ipgp.jussieu.fr
Abstract
The region of the gold-rich Ashanti belt in southern Ghana was chosen as the subject for a detailed regional thermal modelling study. Geological studies, in addition to laboratory measurements of thermal properties and heat-production rates, allow us to constrain a finite-element thermal modelling. Scenarios integrating variations of the structure of the crust and various chronological settings were examined. We calculated the thermal regime before and after the thrust tectonism that affected the region during the Eburnean orogeny (2130 to 2095 Ma), just before ore deposit formation. This gives a new insight into the regional thermal state of the crust before the mineralizing events. To satisfy the thermobarometric observations, the most probable mantle heat flow must be 60 mW.m-2, which is at least three times greater than the present-day value. At shallow depths, our results also indicate anomalies of lateral heat flow reaching 25 mW.m-2, focused on the margins of each lithological unit, including the Ashanti belt. These anomalies are related to the distortion of the isotherms in the first few kilometres that can be mostly explained by lateral contrasts in thermal conductivity. Such anomalies could be of importance for the mineralizing events, as they would favour fluid circulation locally.
Keywords: Ashanti, Ghana, mantle heat flow, Eburnean tectonism, gold mineralization,
1 Introduction
Over the past decade, the increasing volume of high-precision geochronological data has demonstrated that gold deposition was not a continuous process through geological time. The pattern for orogenic gold deposits in the Precambrian shows distinct peaks separated by several hundreds of m.y. (Goldfarb et al. 2001). Two main periods (at 2800-2500 and 2100-1800 Ma) correlate well with episodes of increased continental growth. Geochronological data on juvenile continental crust have been compiled and revised by Condie (2000), who suggested that the three major crustal formation episodes (estimated at 2700, 1900, and 1200 Ma) were related to 'superevents' in the mantle. For the Palaeoproterozoic peak (1900 Ma), a superplume event has been proposed (e.g. Condie et al. 2000). Similarly, the associated periods of orogenic gold formation are "most commonly explained by major mantle overturning in the hotter early
Earth, with associated plumes causing extreme heating at the base of the crust" (Goldfarb et al.
2001). Indeed, it is now generally agreed that global geodynamics played a key role in the formation of several classes of ore deposits (e.g. Barley et al. 1998; de Boorder et al. 1998; Isley & Abbott 1999; Pirajno 2001). If the occurrence of superevents in the mantle, the formation of supercontinents, and the genesis of world-class orogenic gold deposits (or 'superdeposits') are all related, then studies on the possible thermal conditions prevailing at the time of ore deposit formation could provide useful results.
Deep thermal processes beneath continents are well constrained below thermally stable areas for present times (e.g. Jaupart & Mareschal 1999; Lenardic et al. 2000). Heat flow studies in the Canadian and Fennoscandian shields (e.g. Rolandone et al. 2002; Kukkonen 1998), as well as petrological studies on mantle xenoliths (Russell & Kopylova 1999; Kukkonen & Peltonen 1999), have shown that mantle heat flow values at the base of the Precambrian crust range from 10 mW.m-2 to 16 mW.m-2. However, these present estimates cannot be applied to Precambrian times, and the possibility of studying thermal regimes billions of years ago thus becomes a real challenge. A number of distinct arguments suggest that the thermal regime of the Archaean continental crust was not very different from that of the present-day crust (e.g. Richter 1985). If this were indeed the case, one would expect similar, low mantle heat flow values at the base of continents, unless some large-scale thermal perturbation, such as a superplume event, affected the base of the crust. The formation of world class deposits probably requires anomalous thermal processes, located at shallow depth or at the crust-mantle interface. The use of various geological data, and in particular, thermobarometric data, should help to quantify thermal regimes of the past.
In this study, we start from the apparent relationship between Palaeoproterozoic orogenic gold deposits and the deep thermal processes prevailing at the time of their formation. Since numerous geological data have been acquired in mineralized areas, the modelling of past thermal regimes before and during mineralizing events should help constrain thermal conditions at depth.
Among the major orogenic gold deposits, the Ashanti belt of Ghana possesses several features that are particularly well-suited to studying deep thermal processes 2000 Ma ago. Firstly, the Ashanti belt of Ghana was formed during the 'Palaeoproterozoic event' of Condie (2000). Secondly, many thermobarometric data are available and can provide strong constraints to any thermal model. Moreover, numerous rock samples collected during several field campaigns in the area (Milesi et al. 1991, 1992; Feybesse and Milesi 1994) can be used to measure thermal properties of the main lithological units, thus reducing the number of unknown parameters in the models. Thirdly, the volcanic and sedimentary belts in Ghana are sufficiently parallel (over a distance reaching 10 times the crustal thickness) to consider the area as a two-dimensional structure, thus justifying the 2D approach to the modelling.
This study presents the preliminary results of thermal modelling of the Ashanti and surrounding belts, before and during the collisional tectonics leading to the pre-mineralizing stage. After defining a geological model according to the available thermobarometric and geochronological data, various hypotheses on crustal structure, erosion rates and sediment thickness were tested, corresponding to different geological scenarios. As the model strongly depends on thermal properties, measurements of thermal conductivities and heat-production rates were performed. In all cases, thermobarometric data are the main constraints. As a consequence, our results argue for a suggested geological scheme, provide quantitative constraints on the deep thermal processes prevailing immediately before this particular Palaeoproterozoic mineralizing event, and suggest some shallow thermal processes that may lead to particular fluid-rock interactions. This latter consequence is the subject of an ongoing study.
2 Geological setting
2.1 . Main stages of crustal evolution
The Palaeoproterozoic rocks covering a large parts of southwest Ghana (Figure 1) belong to the Birimian Supergroup and the Tarkwaian Group. The Birimian Supergroup
includes sedimentary basins separated by sub-parallel N-E-trending volcanic belts consisting of basalts and some interflow sediments. The Tarkwaian conglomerates overlie the Birimian rocks and were probably derived from the erosion of these rocks.
A detailed chronology for the emplacement of these different groups is proposed. We first consider a phase of magmatic accretion between 2250 and 2170 Ma, corresponding to a period of volcano-plutonism, leading to the emplacement of the greenstone belts constituting the so-called volcanic belts. The addition of extensive monzogranitic plutonism, which occurred between 2160 and 2150 Ma (Opare-Addo et al. 1993b), led to the formation of a juvenile continental crust. After this crust-formation stage, basin opening and sedimentation took place within the Birim, Afema and Comoé basins between 2150 and 2100 Ma.
The emplacement of the Birimian rocks was followed by a period of tectonic accretion, the Eburnean orogeny, for which two main phases of deformation (D1 and D2) can be described (Figure 2). The main deformation is associated with the initial D1 thrust tectonism that took place between 2130 and 2105 Ma. This compressive deformation along a SE-NW direction results in crustal thickening by stacking of the different units. During this compressive stage, the Birimian rocks were deformed and subsequently uplifted and eroded. The resulting Tarkwaian detrital rocks were deposited mainly after the D1 tectonic stage between 2133 ± 4 and 2097 ± 2 Ma (Pigois et al. 2003). Regional metamorphism associated with D1 ranges from lower greenschist facies to lower amphibolite facies and is dated at around 2100 Ma (Pigois et al. 2003). A second tectonic phase, D2, affecting both the Tarkwaian and Birimian rocks, began at 2095 Ma. The major epigenetic Birimian lode-gold event can be placed late in the Eburnean orogeny, after the peak of metamorphism was reached. The age of hydrothermal alteration has been determined by Oberthür et al. (1998), who give ages of 2092 ± 3 and 2086 ± 4 Ma. The most robust age for mineralization, determined at 2063 ± 9 Ma, was given by Pigois et al. (2003). Most of the gold deposits are concentrated along the western flank of the Ashanti belt. They are located in the vicinity of major fault zones, along NE-striking shear zones, at the contact between the Birimian sedimentary basins, Tarkwaian conglomerates and volcanic belts (Figure 1).
2.2 . The Ashanti belt
The Ashanti belt in south Ghana hosts the largest gold deposits known in West Africa. It contains potential resources of ~ 1500 tons of gold (Milesi et al. 1991; Pigois et al. 2003). The mineralization is temporally related to the late stage of the Eburnean orogeny, which took place between 2130 and 1980 Ma and affected the supracrustal rocks. It has the characteristics of
syn-orogenic, mesothermal gold deposits and occurs mainly along shear zones on the western margin of the belt. Figure 2 shows the main successive events that affected the Ashanti belt.
There is still no general agreement concerning the nature of the basement in Ghana. Some authors have proposed the presence of an Archaean basement, at least beneath the Birim basin and southeastern Ghana (Milesi pers. comm.), but the type of basement underlying the Ashanti belt is still controversial. The Ashanti belt might represent the boundary of a continental domain, with the basement below this belt and the western units possibly being of oceanic type just below the greenstone belts. Such hypotheses, as well as distinct scenarios for crustal evolution,could have been tested if field constraints had been sufficient in number. However, in this study we assume a continental basement below the Ashanti belt and the western units.
3 Field constraints and thermal properties
3.1 Thermobarometric constraints
3.1.1 Pre-Eburnean.
The pressure estimates from the migmatites yield pressures in excess of 5 kbars at temperatures between 600 and 1000°C, corresponding to emplacement at a relatively deep crustal level (Opare-Addo et al. 1993a). The anatexis, indicated by the presence of deformed neosomes in these migmatites, began just before 2130 Ma (pre-D1 stage) at a deep crustal level (~ 6 kbars). At this depth, the temperature conditions required for partial melting to occur fall between 650°C and 800°C, depending on water content. In the following, a value of 700°C is adopted.
3.1.2 Syn-D1 Eburnean tectonism.
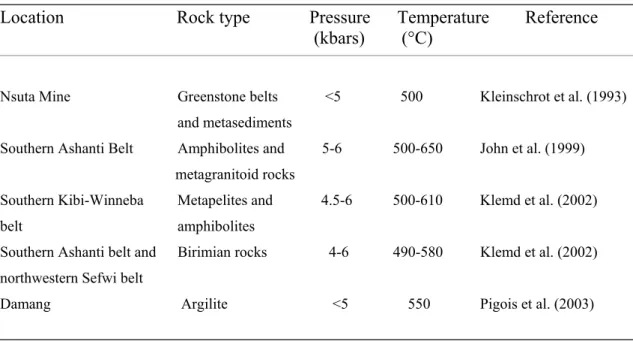
The minimum peak-metamorphism conditions reported for the Eburnean orogeny are 500-610°C at ~ 4.5-6 kbars (Table 1) in the southern Kibi-Winneba belt. They were measured from samples of metapelites and amphibolites (Klemd et al. 2002). Pigois et al. (2003) suggest peak-metamorphism conditions of 550 °C at minimum pressures of 5 kbars in the southern part of the Ashanti belt, which is consistent with previous estimates of 490-650 °C at 4-6 kbars (John et al. 1999; Klemd et al. 2002). These thermobarometric data are shown in Table 1 and were taken into account during construction of the geological model (section 4).
3.2 Thermal properties
In order to introduce petrophysical constraints into the model, measurements of thermal conductivity and heat-production rates were made on representative rock samples collected in Ghana (greenstones, monzogranites, sediments and Tarkwaian conglomerates) and Guinea (basement and sediments).
3.2.1 Thermal conductivity
For the thermal conductivity measurements, we used a QTM (Quick Thermal conductivity Meter) based on a modified hot wire method and commercialized by Showa Denko K.K. The measurement principle is the following (Tavman & Tavman 1999): a thin wire fixed to an insulating material of known thermal properties receives a constant electrical current. This process generates a constant heat (Q) per unit length and per unit time. According to Galson et al. (1987), specific experimental conditions yield measurements as precise as those obtained by the divided-bar apparatus method. These authors provide the experimental procedure required to use the QTM method. In our study, optimal conditions for the number of measurements on each sample were respected with at least six measurements per sample. In most cases, the size of the rock sample exceeded the minimum requirements (20 × 50 × 70 mm). With this procedure, the obtained reproducibility is ± 5% and uncertainty remains lower than ± 10-20% (for dry samples).
By supplying a constant power to the heater element, a temperature rise (ΔT) of the wire is generated. The value of ΔT is then measured by a thermocouple as a function of time during a short heating interval. This temperature versus time record is used to calculate the thermal conductivity (k) according to the following equation (Carlsaw and Jaeger, 1984):
, ) / ln( 1 2 1 2 H T T t t Q F k − − = (1)
where and are temperatures at time and respectively, Q is the heat flow per unit
time and per unit length of the heating wire, and F and H are specific constants of the probe, determined by calibration.
1
T T2 t1 t2
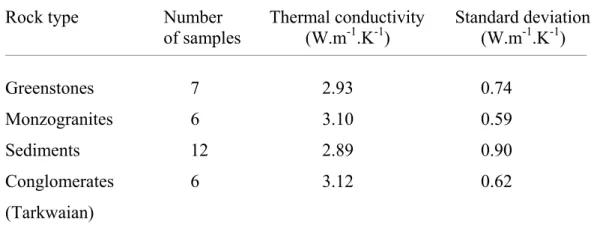
Measurements were made on 31 rock samples representative of the main lithological units (Table 2). The measured thermal conductivities for greenstones and monzogranites fall within the range of classical values for these rock types. The apparently high thermal conductivity of the Birimian sediments and Tarkwaian conglomerates is a result of metamorphism and burial, as compaction is the dominant controlling factor in the variation of thermal conductivity in the
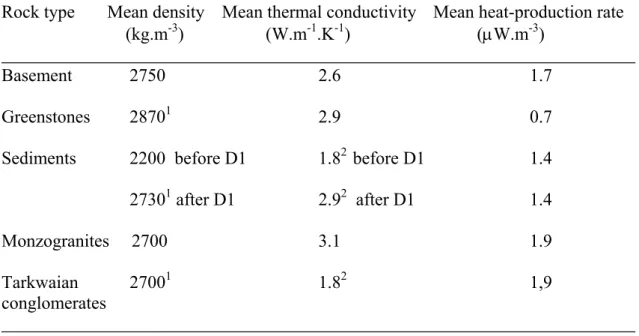
first few kilometres (e.g. Clauser & Huenges 1995). However, since the basins were still opening and erosion and conglomerate deposition were still occurring during D1, we have to use a thermal conductivity value of sediments and conglomerates before metamorphism and burial. In accordance with the thermal conductivity values proposed by Jaupart & Provost (1985), an identical value of 1.8 W.m-1.K-1 was taken for both lithologies during their deposition. After compaction due to burial, the measured thermal conductivity of the sediments was adopted, namely 2.9 W.m-1.K-1 (see a similar case in Serban et al. 2001). For the basement and the mantle, mean values from the literature (Turcotte & Schubert 2002) were taken at 2.6 W.m-1.K-1 and 3.3 W.m-1.K-1, respectively.
3.2.2 Heat-production rate
The concentration in heat-producing elements is also an important factor controlling the geotherm. Heat-production rates were thus calculated for each unit, using the concentrations in the radiogenic elements U, Th and K (Table 3). U and Th concentrations were determined by ICP-MS, and K concentration by X-ray fluorescence spectrometry.
Since the emplacement of the Ashanti belt took place at around 2100 Ma, heat-production rates for this period had to be calculated using present-day concentrations of radiogenic elements. Mean production rates in the past can be calculated with the present concentrations in radiogenic elements by the following equation (Turcotte & Schubert 2002):
{
[ ]
0 9846 . 0 5 155 . 0 5 0.439910 ) 10 3919 . 9 ( ) (t e e U A = ρ − t× + − t×[ ]
[ ]
0}
5545 . 0 5 0 04951 . 0 5 ) (3.47510 ) 10 64 . 2 ( − et× Th + − et× K + (2)where A(t) is the heat-production rate at time t, for a material of density ρ.
[ ]
U0 ,[
Th0]
and[ ]
K 0are the present concentrations of the different isotopes measured in the laboratory. Table 3 shows 104 present-day heat-production rates, measured on rock samples representative of the area and their corresponding values 2100 Ma ago.
4 Geological model for crustal evolution from the initial to the pre-D2
stages
4.1 Structural constraints
The detailed structure and composition of the modelled area is described below. Figure 3 illustrates a geological cross-section inferred from more than 15 years of various field campaigns in the area. Figure 4 summarises different stages of crustal evolution from the initial to the pre-D2 stages. In order to build a realistic geological model, we first had to constrain the thickness and lateral extent of the different rock units.
4.1.1 Lateral extent of the rock units
In the following, lateral extent refers to a NW-SE direction, since a 2D model is considered. The volcanic belts are typically 15-40 km wide and separated from each other by 60 to 90 km (Taylor et al. 1992). From field observations and previous maps (Klemd et al. 2002; Pigois et al. 2003), the width of the Ashanti belt ranges from 15 to 50 km, and is surrounded to the west by the Afema basin (~ 70 km wide) and to the east by the Birim basin (~ 20-60 km wide), the Kibi-Winneba belt (~ 40 km) and the monzogranite unit (~ 40 km wide). We chose a mean lateral extent of 40 km for all the different rock units, in order to simplify the calculations and to take into account a certain amount of crustal shortening that occurred during the Eburnean orogeny.
4.1.2 Thickness of the lithological units
The geophysical constraints on the region are poor and we did not have direct access to the data related to crustal thickness, for which a value of 30 km was assigned. To estimate the thickness of the different units, available thermobarometric data were used. Considering that partial melting started at the base of the monzogranites, conditions of at least 700°C at ~ 6kbars, implies a thickness of at least 23 km for these rocks during the pre-thrusting stage. For our modelling approach, this partial melting condition is used solely to constrain temperature and depth at this given location.
Concerning the volcanic units, we chose a thickness of 20 km for the Ashanti and Kibi- Winneba belts, in accordance with the peak pressure of 4-6 kbars that was recorded in these rock units. The minimum and maximum thicknesses proposed for the sedimentary basins are 3 and 8 km. Different values were tested and the results for 6 km are presented. Pigois et al. (2003) estimate the present minimum thickness of the sedimentary basins at 2 km (within the
basin facies). This is the lower boundary for the thickness of the final sedimentary unit, after thrusting, erosion and the D2 stage (which is beyond the scope of this study). The thickness of the present-day Tarkwaian unit ranges from 1800 to 3000 m (see a detailed description in Pigois et al. 2003). This megasequence resulted from the stacking of different lithostratigraphic formations: the Kawere conglomerate (250-700 m), the Banket conglomerate (150-600 m), the Tarkwa formation (120-400m) and the Huni formation (<1300 m). 1 km is taken for the Kawere, which was deposited just after the thrusting event; 3 km of conglomerates was then added to the pile, leading to a final value of 4 km for the Tarkwaian conglomerates.
4.2 Chronological constraints
The stage just before 2130 Ma is considered to represent the initial condition for the numerical modelling (Figure 2). At that time, all the units except the Tarkwaian conglomerates were emplaced. From west to east, the 40 km-wide units are: the Afema basin, which covers the greenstone belts, the Ashanti volcanic belt, the Birim basin, the Kibi-Winneba belt and the monzogranites.
The initial stage of tectonic accretion, D1, began at 2130 Ma. It resulted in unit stacking that can be evaluated using the thermobarometric data at peak-metamorphism conditions (Table 1). The pressure constraints of 4-6 kbars imply that the sediments of the Birim basin, the Ashanti greenstone belts and rocks of the Kibi-Winneba belt were buried to a depth of ~ 15-22.5 km, when a density of 2700 kg.m-3 is used. This value appears representative for most
rocks of the area, except for fresh sediments (Table 4).
The Kawere unit was deposited on the Ashanti belt contemporaneous to D1. It contains polygenic conglomerates deposited after 2132 ± 2 Ma (age of the youngest detrital zircon from the base of the series; Davis et al. 1994; Oberthür et al. 1998). Following D1 tectonism, auriferous Tarkwaian conglomerates from the Banket series were deposited between 2104 ± 6 Ma (age of the youngest detrital zircon, Milesi et al. 1989) and 2097 ± 2 Ma (age of the Banso granitoid that is assumed to intrude the Tarkwaian deposits, Oberthür et al. 1998).
4.3 Constraints for erosion
The estimate of the erosion rate between the regional peak metamorphism (2100-2105 Ma) and the end of deposition of the Tarkwaian Banket series (2097 Ma) is constrained by the presence of mineralized pebbles of quartz in the conglomerate dated at 2105 Ma (Milesi et al. 1989). Orogenic gold deposits related to an earlier Eburnean compressional event represents one of the sources of gold for the auriferous conglomerates (Milesi et al. 1989; Oberthür et al.
1997; Klemd et al. 1993; Pigois et al. 2003). These pebbles result from the reworking of orogenic deposits that are estimated to have formed under the same conditions as the lode-gold deposits of the western margin of the Ashanti belt (Klemd et al. 1993). The estimated depth of formation for the deposits of the Ashanti area is ~ 4-15 km (~ 1-4 kbars ) (Oberthür et al. 1997; Yao et al. 2001; John et al. 1999; Schmidt Mumm et al. 1997). These data suggest the erosion of 4 to 15 km of strata within these 10 Ma. For modelling purposes, we adopted a value of 10 km, which is in accordance with the abundance of cataclastic and mylonitic pebbles (Milesi pers. comm.).
5 Thermal modelling
5.1 Equations, boundary conditions, parameters and variables
The general form of the heat conduction equation to account for heat transfer in a solid, involving both internal heat production and material advection in Cartesian coordinates, is:
0 ) ( + ∇ + = ∂ ∂ + ∇ ∇ c T A t T c T f fvf k ρ ρ (3)
where T is temperature in K, k the thermal conductivity tensor depending on direction and temperature (W.m-1.K-1), A the heat-production rate (W.m-3), ρ the density (kg.m-3), c the specific heat (J.kg-1.K-1), ρfcf the fluid heat capacity (J.K-1.m-3), and the Darcy velocity field (m.s-1). In our present study, fluid advection is not taken into account, and = 0.
Moreover, is considered to be isotropic, temperature-independent and with the 2D
approximation for the Ashanti belt, equation (3) reduces to:
f v f v k 0 ) ( 2 2 2 2 = + ∂ ∂ + ∂ ∂ + ∂ ∂ A t T c z T x T k ρ (4)
where x is the horizontal distance and z is depth.
5.2 Numerical modelling
The source code THERMIC, used to solve the 2D conductive and advective heat-transfer equation, was developed by Bonneville & Capolsini (1999). Based on a finite-element method it can incorporate realistic geometries, heterogeneous material properties and various boundary and initial conditions (e.g. Vasseur et al. 1993).
The original code was improved in order to take into account phenomena often encountered in earth sciences, such as erosion, deposition and instantaneous thrusting. Tests
were performed to validate the modifications, and it turned out that our results are in excellent agreement with those of Nisbet & Fowler (1982a, 1982b).
5.3 Description of the numerical model
The model is a rectangular grid 200 km long and 150 km thick. This represents the crust and the lithospheric mantle. This grid is divided into 9600 4-node isoparametric elements of 1 by 1 km, down to 47 km depth. We used the thickness deduced for each rock unit (see §4) to build the initial model (Figure 4a). Each 40 km-wide lithological unit corresponds to a specific material, whose thermal properties are defined by the thermal conductivity, the heat-production rate and the heat capacity.
The solution of the thermal problem is a function of the imposed boundary conditions, and the thermal properties of the different rock types. The chosen boundary conditions involve a constant deep heat flow qm entering the base of the grid, and a constant surface temperature
(T=0°C). Various values of the mantle heat flow (qm) are used in order to adjust
thermobarometric data from the pre-Eburnean stage to the different stages of Eburnean tectonism.
5.4 Transient evolution
We chose to represent the tectonic evolution during D1 stage by two different thrusting events (Figures 4b and c). Firstly, the westward compression exerted by the Archaean craton caused thrusting in which both the monzogranites (10 km) and half of the sediments of the Birim basin (3 km) were involved. The activation of two thrust faults located at the margin of these blocks led to an intermediate stage where the monzogranites and the sediments were overthrusted onto the Kibi-Winneba greenstone belt and the Ashanti volcanic belt, respectively. The mean burial depth, estimated at 18 km (~ 5 kbar), at the base of the sedimentary Birim basins can be met only if they were covered by 15 km of rocks. We thus assume that the unit overthrusted onto the Birim basin is a sequence comprising monzogranites (10 km) and volcanics from the Kibi-Winneba belt (5 km).
Numerical calculations are greatly simplified by keeping the Earth surface flat during the thrusting, which – at the time scale of the model – can be considered as 'instantaneous'. The choice of instantaneous thrusting can be justified. The rate of burial does not influence the time lapse between the end of thrusting and maximum temperature. It plays only a minor role in determining the maximum temperature of rocks during the later unroofing stage (Ruppel & Hodges 1994). Moreover, these authors demonstrate that the maximum temperature depth is
linked only slightly to the rate of burial or to the amount of syn-tectonic heating. As we are interested in the thermal state after D1 tectonism, the instantaneous approach is acceptable.
The period of thrusting was followed by a stage of uplift and erosion, of which the Tarkwaian conglomerates are the products. As a consequence of isostatic response to burial, the unit that is the most overthrusted, the Birim sedimentary basin, will be the most affected by erosion and uplift. Based on geological observations of Tarkwaian samples (see section 4.3), we assumed a rate of erosion of 1 km/Ma, so that 10 km were uplifted and eroded within the 10 Ma separating the end of instantaneous thrusting and the beginning of D2 tectonism. In the model, erosion began immediately after instantaneous burial, with a rate of 1 km/Ma.
6 Results and discussion
6.1 Pre-thrusting
The thermobarometric conditions related to monzogranites, ~ 700°C at ~ 6 kbars, appear to be reached only if the amount of heat is sufficient at the base of this unit. These data allow to constrain the pre-thrusting stage (Figure 4a) by fitting temperature and pressure conditions with adequate model parameters. The models where the temperature at the base of the crust exceeds 900°C were rejected.
Tests were initially performed using mean measured values of thermal conductivities and heat-production rates for the different lithological units (Table 4). Several experiments were performed to evaluate mantle heat flow values that would be consistent with the thermobarometric conditions. Using average thermal properties (Table 4), the minimum mantle heat flow that leads to ~ 700°C at 22.5km, is 60 mW.m-2 (Figure 5a). For lower mantle heat flow values, the isotherm 700°C is located beneath the base of the unit whereas for higher values, temperatures at the base of the crust unit exceed 900°C.
In Figure 5a, the thermal anomaly that appears at the base of the crust below the Birim basin is due entirely to the thermal properties of the rocks, the basal heat flow being constant at this depth. This figure also illustrates the effect of thermal refraction caused by a thermal
conductivity contrast between the sediments (k = 1.8 W.m-1.K-1) and the surroundings
(k = 2.9 W.m-1.K-1). Figure 5c shows lateral heat transfer before the thrusting event . The crustal scale anomalies are focused towards the boundaries between the different rock units, emphasizing the role of lateral conductivity contrasts in the heat transfer pattern. Lateral contrasts in heat-production rates also contribute to lateral heat transfer anomalies, but with a much lesser importance than conductivity contrasts (see section 6.3).
6.2 Post-thrusting: Eburnean Tectonism
The results need to fit the data recorded for regional peak- metamorphism:
- in the greenstone belts, a temperature of 500-650 °C is required at ~ 4-6 kbars; - in the sediments of the Birim basin, greenschist facies is reached
The stage before thrusting was calculated with mean thermal conductivities and a mantle heat flow of 60 mW.m-2. Then, the different units were stacked instantaneously (see section 4.3 and figures 4b, 4c). The resulting final thermal field, after thrusting, uplift and erosion, is shown in Figure 5b.
In order to validate the modelling, P-T paths from various rocks within the Ashanti belt were investigated. Figure 6 shows the paths for rocks situated in the Ashanti belt, in the middle of the unit at different initial depths (at the base of the greenstones, in the middle and in between these two levels). The rocks with an initial depth of 15 km, which were first buried to 18 km during the instantaneous thrusting and then received deposition of the Tarkwaian conglomerates, reach P-T conditions that are in good agreement with the amphibolite facies conditions recorded in the greenstones. It must be noted that a thickness of ~ 12 km of greenstones (equivalent to an initial burial of 15 km) would also enable the P-T domain defined by the peak-metamorphism conditions to be reached, in accordance with the upper boundary estimates of Sylvester & Attoh (1992).
The P-T paths of sediments located at the base of the Birim basin were also investigated and are reported in Figure 7. The rock, originally located at the base of the basin (18 km depth), follows a retrograde P-T path as it travels towards the surface until it reaches its final location at 8 km depth. Computed values are in good agreement with thermobarometric data, which suggest that these rocks reached greenschist facies conditions. The retrograde P-T path is representative of the response to burial, with an increase in temperature during the first million years and then a decrease corresponding to the erosion phase. During the period of unroofing to shallower crustal levels, the time lag observed between the end of the compressional interval and the reaching of peak temperatures is in accordance with the theoretical prediction of England & Richardson (1977).
Moreover, in all cases, the peak temperature is reached after 4 m.y. of erosion, which corresponds to 2101 Ma. This correlates well with the timing of the regional peak metamorphism, dated between 2092 ± 3 and 2105 ± 3 Ma by Oberthür et al. (1998) and at 2100 ±3 Ma by Hirdes et al. (1996).
In order to look into the details of the resulting shallow heat transfer mechanisms after D1 tectonism and the associated erosion-deposition phase, the lateral heat flow calculated 11 m.y. after thrusting (corresponding to 2094 Ma) is illustrated in Figure 5d. Compared to the initial lateral heat flow (Figure 5c), it shows an important lateral heat transfer (20-25 mW.m-2) within the upper crust (maximum values are reached within the upper 5 km, Figure 5d). These thermal anomalies are more important at each belt boundary, including the eastern and western boundaries of the Ashanti belt. As the thermal conductivity contrasts are the same as for the initial stage, the anomalies cannot be attributed to heat refraction effects alone. Indeed, it is the particular tectonic history of the Ashanti belt that could explain these shallow thermal anomalies: (a) before thrusting, isotherms were uplifted beneath the surrounding sedimentary basins (Afema, Birim) due to the insulating effect of fresh sediments, (b) thrusting of these anomalously hot sediments disturbed the shallow temperature field, yielding the observed lateral heat flow pattern (Figure 5d) and (e) the deposition of insulating conglomerates enhanced this effect.
6.3 Sensitivity to thermal parameters
The thermal regime of the crust is controlled by boundary conditions (i.e. mantle heat flow in this study) and the thermal properties of representative rocks. In order to constrain our results on mantle heat flow values, the effects of variations (and uncertainty) in thermal conductivity and heat-production rates were also investigated.
We tested the sensitivity of the modelling to extreme values of thermal conductivity. If the minimum values of thermal conductivity for all rock types are taken (mean values minus the standard deviation), then the temperature is higher than in previous cases because of the enhanced insulating effect. In this case, a value of 43 mW.m-2 for the mantle heat flow would be sufficient to satisfy the thermobarometric conditions. On the contrary, if the highest values of thermal conductivity are considered, then a value of 70 mW.m-2 for the basal heat flow is necessary to comply with thermobarometric conditions before and after thrusting.
Tests were also performed to constrain the influence of heat-production rates. When maximum values of heat-production rates are considered for all rock types, a value of 42 mW.m-2 for mantle heat flow is necessary to fit the thermobarometric conditions. This value is much higher when minimum heat-production rates are taken, since qm must reach 75 mW/m².
Increasing the heat-production rate of the monzogranites to its maximum (2.7 μW.m-3) enables higher temperatures to be reached within this unit, without changing dramatically the temperature at the base of the crust.
When combining the effects of maximum heat-production rates and minimum thermal
conductivity, 25 mW.m-2 is the minimum mantle heat flow value required to fit the
thermobarometric data. It should be noted that this value is the lower valid boundary for basal heat flow. It represents the most extreme case, which is quite unlikely: Figure 7, which also shows the case with such parameters for heat production and thermal conductivity, demonstrates that the associated P-T paths fall in the uppermost limit of the greenschist facies domain. Tests using minimum heat-production rates and maximum thermal conductivity present solutions that are not in accordance with the thermobarometric data, and were thus rejected.
The lateral heat flow value also depends on these thermal properties. Indeed, lateral thermal conductivity contrasts are the most determinant parameters for the presence of lateral heat flow anomalies. The contribution of lateral contrasts in heat-production rate was estimated. Firstly, by taking a thermal conductivity of 2.9 W.m-1.K-1 for all the rock types, the effects of
lateral thermal conductivity contrasts are cancelled. In such a case, lateral heat flow values decrease dramatically compared to the standard case, and only a maximum value of 6 mW.m-2, which is thus due to lateral contrasts in heat-production rates, is observed. Secondly, when uncertainties in heat production are considered, and contrasts between units are maximized (e.g. heat-production rate minimum for the sediments and maximum for greenstone belts) it appears that lateral heat flow anomalies are modified by a factor lower than 25%.
Finally, the localization of the Tarkwaian conglomerates (here inferred from field observations) also influences the pattern of lateral heat flow anomalies. For example, if deposition only occurs within the surrounding units of the Birim basin, namely the belts of Ashanti and Kibi-Winneba, then the anomalies will be higher than in the standard case and will be concentrated along the margins of these units.
7 Conclusion
The thermal evolution of southern Ghana from 2130 to 2095 Ma gives insight into the regional thermal state of the crust before the mineralizing events that led to the emplacement of the giant gold deposits of the Ashanti belt.
Thermal modelling of tectonic and surface processes with adequate thermal parameters has allowed us to reproduce the thermobarometric conditions. Amphibolite- to greenschist-facies conditions are encountered for the rocks of the volcanic belts and the Birimian
sediments, which is in agreement with the regional peak-metamorphism conditions indicated by previous studies (John et al. 1999; Kleinschrot et al. 1993; Klemd et al. 2002, Oberthür et al. 1998; Hirdes et al. 1996).
The obtained mantle heat flow values range from 25 mW.m-2 to 75 mW.m-2, with a most probable value of 60 mW.m-2, which is at least three times greater than the present-day value. This relatively high value may be related to deep thermal perturbations. Indeed, the opening of sedimentary basins during the first stage of D1 tectonism, not taken into account in the model, could be related to a regional increase in mantle heat flow. Nevertheless, when present-day mantle heat flow values are considered, a value of 60 mW.m-2 does not represent a dramatic increase in subcontinental heat flow, and the 'mantle overturning' phenomenon (Goldfarb et al. 2001; Condie 2000) may not be so catastrophic. Indeed, even deep and large mantle plumes impinging at the base of the continental lithosphere does not necessarily induce sharp increases in mantle heat flow (Lenardic et al. 2000). If superevents in the mantle are related to anomalous deep processes such as superplumes, then the associated thermal signatures would not necessarily imply strong modifications in mantle heat flow values. One must also indicate that a temperature-dependent thermal conductivity (not tested in this study) would tend to lower the mantle heat flow values since the decreasing conductivities would enhance crustal temperatures. Finally, our results show that thermal equilibrium of the crust can be easily disturbed as soon as mantle heat flow increases by only a few tens of mW.m-2.
The results also indicate anomalies of lateral heat flow reaching ~ 20-25 mW.m-2, mainly focused on the western and eastern margins of the Ashanti belt and other belt boundaries. Such anomalies, where associated with fractures, could be of importance for the mineralizing events, as they would favour fluid circulation locally. Indeed, field studies have emphasized the heterogeneous strain partitioning and the highly focused fluid flow at shallow depths, which could be partly triggered by such lateral heat transfer anomalies. The correlation between the location of these anomalies on both flanks of the Ashanti belt and the location of the major ore deposits is an encouraging result.
A number of first-order simplifications were taken in this study. On one hand, the choice of a depth-independent thermal conductivity could slightly overestimate the results since lateral contrasts may decrease with increasing temperature. Additional tests are required to quantify second-order effects, but the first-order physical mechanisms are expected to be sufficiently important to affect local fluid circulation.
Although our study does not take into account fluid circulation, which is critical in understanding the details of the mineralizing processes, it is a first and necessary step in the
comprehension of the regional thermal evolution of the area. A second stage of modelling, investigating the mineralizing processes at a more local scale and integrating fluid circulation, is the objective of an ongoing project. It will be based on the results of this regional study.
Acknowledgements
VH was supported by a grant from BRGM (Bureau de Recherches Géologiques et Minières). The authors wish to thank sincerely Vincent Bouchot, Jean-Luc Lescuyer, Francis Lucazeau, and Jean-Pierre Milesi for their support and advice. We are grateful to the two reviewers, J. Gallagher and P.E.J. Pitfield, for their valuable comments and suggestions. We thank Rowena Stead for proofreading the final text and English editing. This is IPGP contribution #2919, and BRGM publication BRGM-CORP-03163.
References
Bonneville, A. & Capolsini, P. 1999. THERMIC: a 2-D finite-element tool to solve conductive and advective heat transfer problems in Earth sciences. Computers and Geosciences, 25, 1137-1148.
Barley, M.E., Krapez, B., Groves, D.I. & Kerrich, R. 1998. The Late Archean bonanza : metallogenic and environmental consequences of the interaction between mantle plumes, lithospheric tectonics and global cyclicity. Precambrian Res., 91, 65-90.
Barrit, S.D. & Kuma, J.S. 1998. Constrained gravity models of the Ashanti belt, southwest Ghana. J. Afr. Earth sciences, 26, 4, 539-550.
Carslaw, H. S. & Jaeger, J.C. 1984. Conduction of heat in solids. Clarendon Press, Oxford, 2nd edition, 510pp..
Clauser, C. & E. Huenges, E. 1995. Thermal conductivity of rocks and minerals. In: Ahrens, T.J. (ed) Rock Physics and Phase Relations : A Handbook of Physical Constants. AGU, Washington, D.C., AGU Ref. Shelf, vol 3, pp 105-126.
Condie, K.C. 2000. Episodic continental growth models : afterthoughts and extensions. Tectonophysics, 322, 153-162.
Condie, K.C., Des Marais, D. J., & Abbott, D. 2000. Geologic evidence for a mantle superplume event at 1.9 Ga. Geochem. Geophys. Geosyst., vol 1, Paper number 2000GC000095.
Davis, D.W., Hirdes, W., Schaltegger, U. & Nunoo, E.A. 1994. U-Pb age constraints on deposition and provenance of Birimian and gold bearing Tarkwaian sediments in Ghana, West Africa. Precamb. Res., 67, 89-1997.
De Boorder, H., Spakman, W., White, S.H. & Wortel, M.J.R. 1998. Late Cenozoic mineralization, orogenic collapse and slab detachment in the European Alpine Belt. Earth Planet. Sci. Lett., 164, 569-575.
England, P.C. & Richardson, S.W. 1977. The influence of erosion upon mineral facies of rocks from different metamorphic environments. J. Geol. Soc. Lond., 134, 201-213.
Feybesse, J.-L. & Milesi, J.-P. 1994. The Archean/Proterozoic contact zone in West Africa : a mountain belt of decollement thrusting and folding on a continental margin related to 2.1 Ga convergence of Archaean cratons ?. Precamb. Res., 69, 199-227.
Galson, D.A., Wilson, N.P., Schärli, U. & Rybach, L. 1987. A comparison of the divided-bar and QTM methods of measuring thermal conductivity. Geothermics, 16, 3, 215-226. Goldfarb, R.J., Groves, D.I. & Gardoll, S. 2001. Orogenic gold and geologic time : a global
synthesis. Ore Geol. Rev., 18, 1-75.
Hirdes, W., Davis, D.W., Lüdtke, G. & Konan, G. 1996. Two generations of Birimian (Paleoproterozoic) volcanic belts in northeastern Côte d’Ivoire (West Africa): consequences for the ‘Birimian controversy’. Precamb. Res., 80, 173-191.
Isley, A.E. & Abbott, D.H. 1999. Plume-related mafic volcanism and the deposition of banded iron formation. J. Geophys. Res., 104, 15461-15477.
Jaupart, C. & Mareschal, J.-C. 1999. The thermal structure and thickness of continental roots. Lithos, 48, 93-114.
Jaupart, C. & Provost, A. 1985. Heat focussing, granite genesis and inverted metamorphic gradients in collision zones. Earth Planet. Sci. Let., 73, 385-397.
John, T., Klemd, R., Hirdes, W. & Loh, G. 1999. The metamorphic evolution of the Paleoproterozoic (Birimian) volcanic Ashanti belt (Ghana, West Africa). Precamb. Res., 98, 11-30.
Kleinschrot, D., Klemd, R., Bröcker, M., Okrusch, M. & Schmidt, K. 1993. The Nsuta manganese deposit, Ghana: geological setting, ore-forming process and metamorphic evolution. Z. Angew. Geol., 39, 48-50.
Klemd, R., Hirdes, W., Olesch, M. & Oberthür, T. 1993. Fluid inclusions in quartz-pebbles of the gold-bearing Tarkwaian conglomerates of Ghana as guides to their provenance area.
Mineral. Deposita, 28, 334-343.
Klemd, R., Hünken, U. & Olesch, M. 2002. Metamorphism of the country rocks hosting gold-sulfide-bearing quartz veins in the Paleoproterozoic southern Kibi-Winneba belt (SE-Ghana). J. Afr. Earth Sci 35, 199-211.
Kukkonen, I.T. & Peltonen, P. 1999. Xenolith-controlled geotherm for the central Fennoscandian Shield : implications for lithosphere-astenosphere relations. Tectonophysics, 304, 301-315.
Kukkonen, I.T. 1998. Temperature and heat flow density in a thick cratonic lithosphere: the sveka transect, Central Fennoscandian shield. J. Geodyn., 26, 111-136.
Lenardic, A., Guillou-Frottier, L., Mareschal, J.-C., Jaupart, C., Moresi, L.-N. & Kaula, W.M. 2000. What the mantle sees : the effects of continents on mantle heat flow, in M. Richards et al. (eds). The history and dynamics of global plate motions, Geophysical Monograph 121, AGU, pp 95-112.
Milesi, J.-P., Feybesse, J.L., Ledru, P., Dommanget, A., Ouedraogo, M.F., Marcoux, E., Prost, A., Vinchon, C., Sylvain, J.P., Johan, V., Tegyey, M., Clavez, J.Y. & Lagny, Ph. 1989. Mineralisations aurifères de l’Afrique de l’ouest, leurs relations avec l’évolution litho-structurale au Paleoproterozoïque inférieur. Chron. Rech. Min..
Milesi, J.-P., Ledru, P., Ankrah, P., Johan, V., Marcoux, E. & Vinchon, C. 1991. The metallogenic relationship between Birimian and tarkwaian gold deposits in Ghana. Mineral. Deposita, 26, 228-238.
Milesi, J.-P., Ledru, P., Feybesse, J.-L., Dommanget, A. & Marcoux, E. 1992. Early Proterozoic ore deposits and tectonics of the Birimian orogenic belt, West Africa. Precamb. Res., 58, 305-344.
Nisbet, E.G. & Fowler, C.M.R. 1982a. The thermal background to metamorphism- 1. Simple one-dimensional conductive models. Geosciences Canada 9, 3, 161-164.
Nisbet, E.G. & Fowler, C.M.R. 1982b. The thermal background to metamorphism- II. Simple two-dimensional conductive models. Geosciences Canada 9, 4, 208-214.
Oberthür, T., Weiser, T., Amanor, J.A. & Chryssoulis, S.L. 1997. Mineralogical siting and distribution of gold in quartz veins and sulfide ores of the Ashanti mine and other deposits in the Ashanti belt of Ghana: genetic implications. Mineral. Deposita, 32, 2-15.
Oberthür, T., Vetter, U., Davis, D.W. & Amanor, J.A. 1998. Age constraints on the gold mineralization and Paleoproterozoic crustal evolution in the Ashanti belt of southern Ghana. Precamb. Res., 89, 129-143.
Opare-Addo, E., Browing, P. & John, B.E. 1993a. Pressure-Temperature constraints on the evolution of an early Proterozoic plutonic suite in southern Ghana, West Africa. J. Afr. Earth Sci 17, 13-22.
Opare-Addo, E., John, B.E. & Browing, P. 1993b. Field and geochronologic (U-Pb) constraints on the age and generation of granitoids and migmatites in southern Ghana, AGU Spring meeting, Baltimore, EOS Trans. Abst. Suppl., 74, 16, 301.
Pigois, J.P., Groves, D.I., Fletcher, I.R., McNaughton, N.J. & Snee, L.W. 2003. Age constraints on Tarkwaian paleoplacer and lode-gold formation in the Tarkwa –Damang district, SW Ghana. Mineral. Deposita, 38, 695-714.
Pirajno, F. 2001. Ore deposits and mantle plumes. Kluwer Academic Publishers, Dordrecht, 576 pp.
Richter, F.M. 1985. Models for the Archean thermal regime. Earth Planet. Sci. Lett., 73, 350-360.
Rolandone, F., Jaupart, C., Mareschal, J.-C., Gariépy, C., Bienfait, G., Carbonne, C. & Lapointe, R. 2002. Surface heat flow, crustal temperatures and mantle heat flow in the Proterozoic Trans-Hudson Orogen, Canadian shield. J. Geophys. Res., 107, B12, 2341. Ruppel, C. & Hodges, K.V. 1994. Pressure-temperature-time paths from two-dimensional
thermal models: Prograde, retrograde, and inverted metamorphism. Tectonics, 13, 1, 17-44.
Russel, J.K. & Kopylova, M.G. 1999. A steady-state conductive geotherm for the north central Slave, Canada : inversion of petrological data from the Jericho kimberlite pipe. J. Geophys. Res., 104, 7089-7101.
Schmidt Mumm, A., Oberthür, T., Vetter, U. & Blenkinsop, T.G. 1997. High CO2 content of fluid inclusions in gold mineralisations in the Ashanti belt, Ghana: a new category of ore forming fluids?. Mineral. Deposita, 32, 107-118.
Serban, D.Z., Nielsen, S.B. & Demetrescu, C. 2001. Transsylvanian heat flow in presence of topography, paleoclimate, and groundwater flow. Tectonophysics, 335, 331-344.
Sylvester, P.J. & Attoh, K. 1992. Lithostratigraphy and composition of 2.1 Ga greenstone belts of the West African craton and their bearing on crustal evolution and the Archean-Proterozoic boundary. J. Geol., 100, 377-393.
Tavman, I.H. & Tavman, S. 1999. Measurement of thermal conductivity of dairy products. Journal of engineering, 41, 109-114.
Taylor, P.N., Moorbath, S., Leube, A. & Hirdes, W. 1992. Early Proterozoic crustal evolution in the Birimian of Ghana: constraints from geochronology and isotope geochemistry. Precamb. Res., 56, 97-111.
Taylor, S.R. & McLennan, S.M. 1995. The geochemical evolution of the continental crust. Rev. Geophys., 33, 241-265.
Turcotte, D. & Schubert, G. 2002. Geodynamics : Applications of Continuum Physics to Geological Problems, 2nd ed., 456 pp., Cambridge Univ. Press, New York.
Vasseur, G., Demongodin, L. & Bonneville, A. 1993. Thermal effects arising from water circulation through thin inclined aquifers. Geophysical Journal International, 112, 276-289.
Yao, Y., Murphy, P.J. & Robb, L.J. 2001. Fluid characteristics of granitoid-hosted gold deposits in the Birimian Terrane of Ghana: a fluid inclusion microthermometric and Raman spectroscopic study. Econ. Geol., 96, 1611-1643.
Location Rock type Pressure Temperature Reference
(kbars) (°C)
Nsuta Mine Greenstone belts <5 500 Kleinschrot et al. (1993) and metasediments
Southern Ashanti Belt Amphibolites and 5-6 500-650 John et al. (1999) metagranitoid rocks
Southern Kibi-Winneba Metapelites and 4.5-6 500-610 Klemd et al. (2002) belt amphibolites
Southern Ashanti belt and Birimian rocks 4-6 490-580 Klemd et al. (2002) northwestern Sefwi belt
Damang Argilite <5 550 Pigois et al. (2003)
Table 1: Thermobarometric data (pressure and temperature estimates) for peak-metamorphism
conditions at various locations in the Ashanti area. The spatial distribution of these estimates is shown on Figure 1.
Rock type Number Thermal conductivity Standard deviation of samples (W.m-1.K-1) (W.m-1.K-1) Greenstones 7 2.93 0.74 Monzogranites 6 3.10 0.59 Sediments 12 2.89 0.90 Conglomerates 6 3.12 0.62 (Tarkwaian)
Table 2: Thermal conductivity measurements of Birimian and Tarkwaian rock samples from
the Ashanti belt and Guinea. For each sample, six measurements were made and thermal conductivity is the mean value of all the samples.
Rock type Number U K Th Heat-production rate of samples (ppm) (%) (ppm) μW.m-3 __________________________________________________ s.d. s.d. s.d. present s.d. t=2100 Ma s.d. _________________________________________________________________________________________________________________________ _______________________________________________________________________________________________ Basement 48 0.98 1.03 2.00 1.29 8.47 9.60 1.05 0.90 1.71 1.28 Greenstones 12 0.81 0.64 0.60 0.42 1.76 1.49 0.40 0.28 0.69 0.45 Monzogranites 9 1.83 1.26 2.25 1.19 4.87 2.44 1.04 0.44 1.88 0.82 Sediments 25 1.71 1.38 1.96 1.44 4.32 2.17 0.77 0.43 1.38 0.75 Tarkwaian 10 2.79 3.42 1.64 1.49 6.78 4.52 1.12 0.92 1.85 1.62 Conglomerates __________________________________________________
Table 3: Heat-production rates and their standard deviations (s.d.) for Birimian and Tarkwaian rock samples from the Ashanti belt, at present (measurements) and 2100 Ma ago (see equation (2)).
(kg.m-3) (W.m-1.K-1) (μW.m-3)
Basement 2750 2.6 1.7
Greenstones 28701 2.9 0.7
Sediments 2200 before D1 1.82 before D1 1.4
27301 after D1 2.92 after D1 1.4
Monzogranites 2700 3.1 1.9
Tarkwaian 27001 1.82 1,9
conglomerates
Table 4: Main lithological units with associated density values and thermal properties. Density
measurements are from Turcotte and Schubert (2002) except (1) from Barritt and Kuma (1997). Thermal properties are from this study except (2) from Jaupart and Provost (1985).
Figure captions
Figure 1: Simplified geological map of south Ghana. Locations of samples where the
thermobarometric data are inferred are. Cross section A-A’ is shown in Figure 3. Also shown are the locations of the major gold mines 1-14.
Figure 2: Succession of the different lithological units (top) and the main tectonic phases
(bottom). This simplified scheme allows the reconstruction of a geological scenario prior to the mineralizing event (after the D1-phase). Time intervals are positioned according to geochronological data from several studies (see text for references)
Figure 3: Geological cross-section through A-A’ (Figure 1) as deduced from field campaigns.
The N-W direction of thrusting events is outlined. Some critical information, such as the main lithological units, is also indicated (see text).
Figure 4: Model for the Ashanti and surrounding belts, between 2130 and 2105 Ma. The initial
stage (top) accounts for thermobarometric data in the monzogranites. At 2105 Ma, the central unit has been overthrusted by those from the east, implying the burial of sediments and metamorphism in the greenschist facies, while the Ashanti belt was recovered by sediments and barren conglomerates (Kawere). The third stage is the result of erosion and deposition.
Figure 5: Temperature field before (a) and after (b) the D1 tectonic phase, as inferred from
thermobarometric data (see text) and from a maximum temperature at the base of the crust of 900°C. The undulated shape of the isotherms (labelled) is due to the thermal properties of each lithological unit since mantle heat flow (60 mW.m-2) stays constant at the base of the model. This value allows the conditions for partial melting in the monzogranites to be reached. After the D1 phase (bottom), the deposition of sediments and Tarkwaian conglomerates distorts the shallow isotherms and yields temperature gradients higher than 40°C/km within the Ashanti belt. Lateral heat flow before the thrusting events (c) and after the entire D1 phase (d). Positive values correspond to a westward heat flow. Ore deposits have formed after the D1 phase and are mainly concentrated at the edges of the Ashanti belt, where shallow anomalous lateral heat flow is observed (see e) zoomed area, at bottom).
Figure 6: Results of numerical experiments (P-T paths) compared with thermobarometric data.
Each P-T path corresponds to the burial of greenstones of the Ashanti belt, after deposition of the Tarkwaian conglomerates. The greenstones buried to 19 km record P-T paths that are in agreement with the thermobarometric data.
Figure 7: Results of numerical experiments (P-T paths) for Birim sediments, compared with
the greenschist facies domain. Each P-T path corresponds to the erosion phase after thrusting, but before the end of D1 tectonism (i.e. from 2105 to 2095 Ma). The five curves reflect different values for thermal parameters: (kmin and kmax) = minimum and maximum
values of thermal conductivity, (Amin and Amax) = minimum and maximum values of
heat-production rate, and (k, A ) = mean values for thermal conductivity and heat-production rate. The highest temperatures (peak-metamorphism conditions) are reached at 2100 Ma, as suggested by Hirdes et al. (1996) and Oberthür et al. (1998).