Publisher’s version / Version de l'éditeur:
Proceedings: IEEE Canada Electrical Power and Energy Conference (EPEC
2018), 2018-10
READ THESE TERMS AND CONDITIONS CAREFULLY BEFORE USING THIS WEBSITE. https://nrc-publications.canada.ca/eng/copyright
Vous avez des questions? Nous pouvons vous aider. Pour communiquer directement avec un auteur, consultez la première page de la revue dans laquelle son article a été publié afin de trouver ses coordonnées. Si vous n’arrivez pas à les repérer, communiquez avec nous à [email protected].
Questions? Contact the NRC Publications Archive team at
[email protected]. If you wish to email the authors directly, please see the first page of the publication for their contact information.
NRC Publications Archive
Archives des publications du CNRC
This publication could be one of several versions: author’s original, accepted manuscript or the publisher’s version. / La version de cette publication peut être l’une des suivantes : la version prépublication de l’auteur, la version acceptée du manuscrit ou la version de l’éditeur.
Access and use of this website and the material on it are subject to the Terms and Conditions set forth at
Demand control of baseboard heaters: lessons learned from 50-home
pilot study
Pardasani, Ajit; Veitch, Jennifer A.; Newsham, Guy R.; Hu, Yitian; Cormier,
Terrance; Hull, Sonya
https://publications-cnrc.canada.ca/fra/droits
L’accès à ce site Web et l’utilisation de son contenu sont assujettis aux conditions présentées dans le site LISEZ CES CONDITIONS ATTENTIVEMENT AVANT D’UTILISER CE SITE WEB.
NRC Publications Record / Notice d'Archives des publications de CNRC:
https://nrc-publications.canada.ca/eng/view/object/?id=44ffbadf-4006-49ea-b826-f090f65fbf73 https://publications-cnrc.canada.ca/fra/voir/objet/?id=44ffbadf-4006-49ea-b826-f090f65fbf73
Demand Control of Baseboard Heaters: Lessons
Learned from 50-home Pilot Study
Ajit Pardasani,
Jennifer A. Veitch, Guy R. Newsham, Yitian Hu
Construction Research CentreNational Research Council Canada Ottawa, Canada
Terrance Cormier, Sonya Hull
Siemens Canada Limited Fredericton, New BrunswickAbstract— This paper presents results from a pilot study in 50
occupied homes in Fredericton, New Brunswick, Canada to evaluate a demand response (DR) strategy applied to residential electric baseboard heating loads. The underlying principle is based on storing electricity as thermal energy in the building envelope and household contents before the grid peak demand period, and then discharging that stored energy to maintain conditions for thermal comfort during the peak period. During January and February 2016, a total of 13 DR interventions were executed. This field test showed that a load shift up to a maximum of 3.4 kW, with an average of 1.4 kW, per household was possible for the first hour, depending on the outdoor temperature. We observed a large variation in load shift between homes, partly depending on the thermostat set-point profiles, building and occupant characteristics. The approach holds significant potential for shifting peak loads in locations where electricity is a major source of energy for space heating.
Keywords—demand response; electrical thermal storage; load shift; space heating; smart thermostats
I. INTRODUCTION
New Brunswick’s use of electricity is very seasonal and weather dependent. The peak load required in the winter is double the average load of the summer and, in any day, the province-wide load requirements may shift by as much as 500 MWs for a couple of hours on cold winter mornings. As such, with a predominantly supply-side approach, the electric utility, NB Power, must be able to deliver a peak winter demand of about 3100 MW for only a few hours on a few days of the year. The huge difference in summer and winter loads adversely affects the utilization of NB Power’s generation assets reducing it to almost 50 percent [1]. The swings are largely driven by the use of electricity for space heating, as 61% of electricity use is for space heating and cooling, and a further 22% is for electric water heating. Peak demand typically occurs during the winter morning, as people wake up, turn up heating, have showers, turn on lights and cook breakfast, with a secondary peak in the early evening, when people get home from work, turn up heating, turn on lights, cook dinner, and use numerous appliances. These peaks are emphasized on the coldest days when demand for heating is at its highest. Although the demand for electricity is forecasted to grow minimally during the next 10-year period, new power stations,
at great expense, may be needed due to the end-of-life retirement of older plants. NB Power’s long-term plan assumes savings of approximately 600 MW and 2 TWh by 2038 through energy efficiency, demand management and demand reduction [1]. Effective demand response (DR) control strategies will help NB Power to curtail household electrical loads and thus to effectively reduce system-wide winter peak demand and accommodate more renewables (with their variable generation) on the grid. Residential DR involves a utility company curtailing high household electrical loads during the peak period by sending a demand curtailment signal over the communication infrastructure. This is expected to result in electricity cost benefits for customers, help realize sustainability goals, and increase grid stability.
As a part of due diligence prior to making a large investment in a large-scale program, we investigated how much electrical energy could be shifted from peak demand hours while maintaining acceptable thermal conditions through load shift strategies to exploit household thermal mass. Thermal energy stored in the building envelope and contents should enable operation of electrical heaters on a reduced duty cycle during the critical peak period while allowing thermal comfort conditions to be maintained.
The investigation was carried out using a phased approach. During Phase 1 (winter 2014/2015), a series of experiments were conducted in the twin-house facility at the Canadian Centre for Housing Technology (CCHT) located in Ottawa [2], see Figure 1.
The unoccupied twin houses at CCHT permit side-by-side evaluation of load shift through direct comparison where one house provides a baseline and the second house is subjected to demand response interventions. The tests showed that, depending on the outdoor temperature, a load shift up to 4 kW for the first 30 minutes and a total shift up to 5.7 kWh during the 2-hour period was possible [1]. The results from the CCHT pilot study were promising enough to launch the 50-home pilot study.
Phase 2 was a field evaluation (winter 2015/2016) in 50 occupied homes in Fredericton, New Brunswick, Canada. Participants were recruited by NB Power following a mutually-developed recruitment and consent protocol approved by the NRC Research Ethics Board. Participating households received 3-5 smart (communicating) thermostats, which were professionally installed by an electrical contractor hired by NB Power. The electrical and thermal performance of participating homes was monitored through telemetry data, and occupants were surveyed by NRC to determine whether or not the load shift interventions affected their comfort. This paper focuses on the results of Phase 2, and the effect of building characteristics and thermostat programming on the size of the peak shift.
II. SUMMARY OF RELATED PAST STUDIES
Programs and pilot studies involving residential winter electric space heating DR have been conducted elsewhere. Some studies have engaged electric furnaces [e.g. 3], heat pumps [e.g. 11], or radiators [e.g. 6]; for brevity, we limit our review in this paper to studies specifically engaging electric resistance baseboard heaters.
Lempereur & Bobker [3] and Huang [4] controlled baseboard heaters in apartments in New York. The first phase involved 169 apartments in three buildings, at an average supplemental equipment cost of $1644 per apartment (payback 5-7 years). The initial focus was energy savings via central control of maximum setpoints and night-time setback, but peak load was reduced by up to 0.63 kW/apartment. Later the same system served as a platform for DR across 1100 apartments in multiple buildings. Events typically lasted 1-1.5 hours, with setpoint lowered by 1.1 oC with no preheat. A typical average reduction was around 0.3 kW/apartment with no reported complaints from occupants.
The municipal utility in Madison, South Dakota has supported load control programs for more than 10 years [5]. Currently, around 343 customers have baseboard heaters under control. The control hardware involved 1-3 relays at the central breaker panel, at a cost of around $130 plus labour. A simple cycling approach is used, and a capped monthly incentive is offered. Winter peaks occur in the morning, although lower-level curtailment can persist throughout the day. The average peak reduction was estimated as 4 kW/household in January.
Leduc et al. [6] simulated baseboard DR strategies in Quebec. The simulated low-mass wood-frame house had an installed heating capacity of 21 kW, and a reference setpoint of 21° C. Winter peak periods were defined as 6-10 am and 4-8 pm. Three basic strategies (with variants) were explored: setback only, setback with pre-heat, and limiting the power to the baseboards to a fraction of full power. Peak load reductions
of up to 7 kW were demonstrated, with post-event snapbacks typically equal to, or exceeding this value. Load reductions generally declined over the four-hour event, although pre-heating strategies exhibited less decline. Pre-heat strategies had a small energy penalty and slightly worse thermal comfort parameters. Fournier & Leduc [7] applied setback strategies to only four of eight baseboard heated zones in a house, and also assumed pre-existing setback strategies. Simulations were applied to a single grid-peak day in January. Results showed peak load reductions of up to 5 kW in the first hour of an event, declining to 1 kW by the end of an event. Ramping of the setpoint reduced snapback effects substantially. There was little effect of any strategy on overall energy use.
Fournier & Leduc [8] then studied baseboard DR strategies in fully instrumented, unoccupied, twin research houses in Quebec. A simple strategy reducing the setpoint of all heaters instantaneously by 2oC during the peak period without pre-heat yielded the largest load reduction (approx. 4 kW in the first half-hour,and averaging 3.0 kW over the three-hour peak period), but also suffered the largest rebound (>7 kW). A strategy with pre-heat and ramping of thermostat settings yielded a lower load reduction (averaging 2.4 kW over the peak period), but also a lower rebound (approx. 2 kW), and conditions that were likely better for occupant thermal comfort. In another series of tests, they controlled only a fraction of heaters, and found that the load reduction was approximately linearly related to the fraction of total load controlled. Consequently, they recommended choosing the rooms with the largest demand in a scenario where the number of controllable thermostats is limited.
Steele-Mosey & Steiner [9] report a pilot conducted in Washington State in 2009-2011. Baseboard cycling was engaged in 53 households. Morning peak periods were generally 6-9 am, and evening peaks periods were 4-7 pm. The estimated average load reduction was 0.18 kW. This low value was attributed to the fact that only a minority of baseboards in the house were controlled, so that when these baseboards were cycled others operated for longer periods to maintain the setpoint throughout the house. The authors suggest DR programs might target households where the residents would typically have left home by the end of the morning, to avoid potential thermal comfort problems. Overall, participant satisfaction was high, but there was dissatisfaction with the appearance and installation of the equipment. The principal motivations for participation were for altruistic and environmental reasons, and not personal financial gain. Nevertheless, many participants expected to save money on their energy bill, although this was not advertised as a benefit.
Overall, these studies suggest the following findings and lessons learned:
A peak load reduction of up to 5 kW/house may be achieved with baseboard space heating DR;
Snapback of load after a DR event can be at least as large as the reduction during the event; pre-heating prior to the DR event can reduce thermal comfort problems and snapback;
Occupants generally experience few thermal comfort problems during events;
Occupants appreciate an override option for called events (though rarely use it), but successful programs have been delivered that did not offer overrides; Overall energy use is likely unaffected by DR events; Quality control of the DR technology and the work of
the installers is very important;
It is not clear how important financial incentives are to encouraging participation;
Overall, participants in space heating pilots/programs have been satisfied with the experience;
There is little knowledge of the effect of house characteristics (e.g. age) on outcomes.
No prior study had been conducted that is directly analogous to the New Brunswick context, and this review supported the need for a context-specific study to inform a larger future application of the technology in New Brunswick.
III. METHODOLOGY
A. Load Shift Strategy
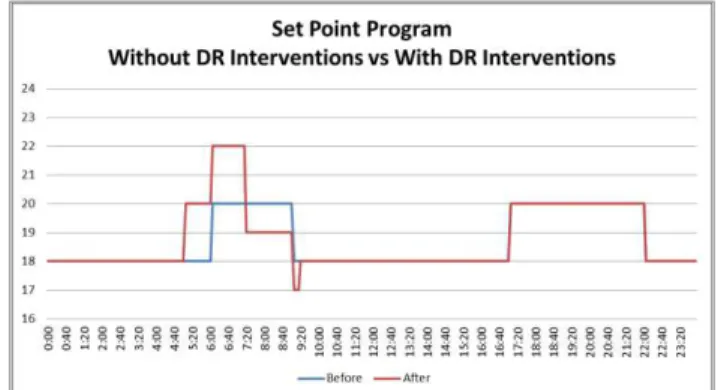
Our strategy to shift the peak consumption is based on storing the electricity as useful thermal energy before the peak period, and then discharging it during the system peak to maintain thermal comfort when baseboard heating is curtailed. This is achieved by preheating the dwellings over the normal operating indoor temperature by 2 oC before the peak period and maintaining a temperature 1 oC lower than normal operating during the peak period (Figure 2). This was achieved by NB Power dispatching a +2 °C temperature offset event for preheat and -1 °C offset event for discharge.
Figure 2: Example thermostat settings in one house. The blue line shows the normal thermostat setting programmed by the homeowner. The red line shows the thermostat settings after
the offset corresponding to the DR event is applied. A majority of home owners in heating dominated climates in North America program their thermostats with nighttime temperature setbacks in winter months, and many also apply setbacks for daytime hours when they are away [10], [11]. Note that by sending offsets rather than actual setpoints, the utility company does not interfere with the base thermostat
schedule set by the occupant. The temperature offset makes no assumption about the thermostat programmed setpoint profiles. B. Intelligent Load Management and OpenADR Framework
An important objective of the project was to test the scheduling of DR events using automated distributed energy resource (DER) control. Automated DER control was provided by the Siemens Distributed Energy Management System (DEMS) system.
DR events were scheduled on the DEMS by NB Power which then initiated the automated scheduling of the events with each of the connected DER devices (i.e. the thermostats) via the thermostat vendor cloud using the OpenADR2.0b standard.
In the thermostat, each of the OpenADR2.0b simple signal levels (0-3) was mapped to a corresponding offset. For example, if the current set-point was 21 degrees C and the desire was to create a ‘discharge’ event by turning off heaters and allowing the house to drift down to 20 degrees C, an OpenADR2.0b simple signal was sent with the signal level corresponding to a downward offset of 1 degree. This offset was enforced for the requested duration of the event, after which the thermostat returned to its preprogrammed set-point. All demand response interventions described in this paper are composite controls and thus are made up by combining multiple control requests which are scheduled to execute one after another. For example, the effect of scenario shown in Figure 2 is achieved by a control request for a +2 °C offset for preheating followed by the second control request for a -1 °C offset for discharging the stored energy. Telemetry, state, and registration data returned through the OpenADR2.0b requests allowed the measured data provided by the thermostat to be verified against the corresponding measured data from the sensors installed in the participating homes.
IV. 5O HOME PILOT DESIGN
The field evaluation of the winter space heating load shift strategy was done in a pilot test involving 50 owner-occupied homes studied over the winter of 2015-16. Participants were recruited by NB Power by invitation, following a protocol reviewed by the NRC Research Ethics Board. The sample included 15 2-storey homes, 30 single-storey homes, and five “mini-homes” (single-storey, factory constructed, modular homes without basements). Fourteen were constructed between 1961-1983; 18 between 1984-2000; and, 18 between 2001 and 2013. We chose a sample population of detached homes because their thermal performance is not affected by adjacent dwellings.
In addition to the energy consumption, electricity demand, and temperature data reported here, the project also included four online surveys completed by the homeowners (baseline, after thermostat installation, after January interventions, and after February interventions). The surveys were used, in part, to determine whether or not there had been any thermal comfort consequences of the interventions.
This study was funded by NB Power, Siemens Canada, and the National Research Council Canada (through the High Performance Buildings Program).
A. Set-up
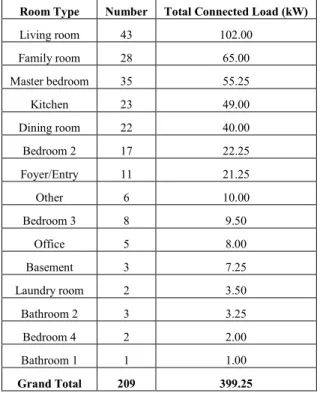
The homes whose owners volunteered to participate had several independent baseboard heaters equipped with line voltage thermostats. Under this pilot up to five of the legacy inline thermostats in each house were replaced by Sinopé smart thermostats (TH1120RF-3000 or TH1121RF-4000); installation was co-ordinated by NB Power (approximately $450 per house). These new thermostats connected to the Internet through Sinopé’s gateway and allowed the customers to program their thermostats through a client-facing web interface. The thermostats collected set point, actual room temperature, and baseboard duty cycle data, which were uploaded to Sinopé’s cloud server at 5-minute intervals. Each home also received an electricity gateway monitor to report energy data to NB Power at 1-minute intervals. Weather data for the region were obtained from Environment Canada. Table 1 shows the thermostat installation locations and connected load. On average each participating home had four Sinopé smart thermostats installed and the average load per connected thermostat was 1.9 kW.
Table 1: Thermostat installation locations and loads in the 50 pilot homes Room Type Number Total Connected Load (kW)
Living room 43 102.00 Family room 28 65.00 Master bedroom 35 55.25 Kitchen 23 49.00 Dining room 22 40.00 Bedroom 2 17 22.25 Foyer/Entry 11 21.25 Other 6 10.00 Bedroom 3 8 9.50 Office 5 8.00 Basement 3 7.25 Laundry room 2 3.50 Bathroom 2 3 3.25 Bedroom 4 2 2.00 Bathroom 1 1 1.00 Grand Total 209 399.25
These thermostats were capable of executing the temperature offset events based on simple Open Automated Demand Response (OpenADR) 2.0b protocol. The home owners were able to see the change in setpoint for their thermostats and had the choice to opt out of the demand response event by manually changing the setpoint on their thermostat.
The participating households were randomly assigned to Groups A and B, stratified by vintage and house type. Group A experienced the interventions in January 2016 (with Group B as the comparison group in that month). Group B
experienced the interventions in February (with Group A as the comparison group in that month). Participants did not know to which group they had been assigned, because one of the research questions concerned whether or not occupants noticed the interventions. Group A experienced a total of six DR interventions, and Group B experienced a total of seven interventions. No prior warning was given of the test days to the occupants. Table 2 shows the mix of building structures, and Table 3 shows the average connected loads and floor areas per dwelling in Group A and B. The average floor area of homes in the field study was substantially smaller than the above grade floor area of the CCHT houses (210 sq. m.).
Table 2: Mix of building structures in the 50 home pilot study Building Structure
Group 2-Storey Single-Storey Mini-home
A 8 15 2
B 7 15 3
The average number of thermostats per dwelling in the field study was 20% lower that the CCHT. Thus the average fraction of controllable baseboard load per dwelling for the field study was only approximately 50% as compared to 66% for the CCHT, though the average load per connected thermostat across the two studies was comparable.
The thermostat offsets in Figure 2 were tested both at the CCHT and 50-home pilot. However, the scheduling differed; for the pilot study we adjusted the period of preheating to start at 5:00 AM and to last for 135 min., and the discharge to start at 7:15 AM and to last for 120 min. to coincide with the NB Power system peak.
Table 3: Average connected load and floor area in the 50 home pilot study Group Connected Capacity (kW) Total Capacity (kW) Floor Area (sq. m.) Connected Load (%) A 7.4 15 120 49 B 7.8 15 119 52 B. Establishing a Baseline
One-minute electricity usage interval data corresponding to non-intervention days in January and February 2016 were used to establish the baseline for Groups A and B. We used a linear regression model to show the relationship between the whole-house electricity consumption (dependent variable) and the outdoor temperature (independent variable). This was done for defined time periods (e.g., first half-hour after intervention, first hour after intervention, full intervention period) in the intervention period from 5 AM to 9:15 AM that included both preheat and discharge periods. Figure 3 shows the correlation between electricity used per dwelling for Group B from 5 AM until 6 AM, corresponding to the first hour of the discharge period, and outdoor dry-bulb temperature on the baseline days and for intervention days.
C. Computing the load shift
The difference between the baseline energy use and the energy use on the intervention days at any given outdoor temperature formed the estimate of the load shift as illustrated in Figure 3.
Figure 3: Linear regression model for the average power draw per dwelling for Group B during the first hour of discharge and outdoor temperature for the
baseline and intervention days. Load shift is the difference between the baseline regression line (blue) and the intervention regression line (red) for a
given outdoor temperature
D. Results
The amount of load shift varied greatly across dwellings with ~10% of dwellings shifting as much as 3-4 kW for the first hour and ~35% shifting 1 kW or less, as shown in Figure 4. Telemetry data from four dwellings was not available due to communication issues with the gateways.
Figure 4: Distribution of demand reduction during the first hour of discharge period by house age vintage. Telemetry data for only 46 out of 50
participating dwellings was available for analysis. Negative values indicate a load reduction.
Analyses looking at the whole sample revealed the following:
There was no meaningful energy penalty as a result of the interventions.
The surveys revealed that the participants were generally unable to detect the interventions. There were also no
systematic effects of the interventions on thermal comfort, or on behaviours that could affect thermal comfort (e.g., changing clothing).
On average no rebounds were observed at the end of the interventions when baseboard heaters returned to their originally programmed schedules.
No significant impact of house age was observed on the load shift for the first hour, although houses built after 2000 showed the least amount of shift for the full discharge period.
Mini-homes shifted more loads than the other house types. This was possibly caused by the higher percentage of total space heating loads on controllable thermostats in that dwelling type. For comparison, the total number of thermostats (of all kinds) in mini-homes ranged from six to eight whereas the average number of thermostats per house in the pilot study was 11, and the maximum number was 20.
No significant effect on load shift was observed related to heat recovery ventilators (HRVs), humidifiers, or window types.
We further analysed the results using cross-tabulations of load shift by household characteristics. We ranked the average shift achieved by each house from the highest to the lowest (Groups A and B combined), and then split the sample into thirds. Thus the top third of houses in this context were the 15 houses that realised the largest load shifts, and so on for the middle third and bottom third. We sought household characteristics that were over-represented in the top third, which could then be used to optimize recruitment into a future program.
This analysis revealed the following:
The top third of homes shifted an average of 2.6 kW during the first hour of the discharge period. Conversely, the bottom third delivered virtually no load shift.
The houses in the top third of load shift tended to set their thermostats at higher settings at all times of day.
Dwellings that had the highest ratio of connected baseboard loads to installed capacity showed the highest shifts. The top and middle thirds had 59% and 56% of baseboard loads on the controllable thermostats, whereas the ratio for the bottom third was only 48%
V. CONCLUSIONS
Our evaluations of the proposed peak shift strategy using the principle of electrical thermal storage suggest that:
There is a potential for 4 kW load shift for the first 30 minutes of DR with preheat on colder days (based on the CCHT results). However, the results in occupied homes varied widely depending on the total installed capacity of baseboard heaters and the ratio of connected baseboard loads to total heating capacity.
The way occupants programmed their thermostats also has a major bearing on the load shift. The houses that exhibited larger load shifts tended to set their thermostats
at higher temperatures at all times of day, and used smaller night-time setbacks.
Preheat and discharge strategies did not result in any substantial increase in total daily heating energy consumption.
Therefore, if one were seeking to target an electric baseboard DR program towards households most likely to provide larger load shifts, one should seek to recruit houses with smaller nighttime setbacks, and with prevailing thermostat settings for the peak period that are higher than the general population.
The results of the CCHT test [2] and this pilot study have encouraged further development and investigation of this peak load reduction strategy. We recently completed a pilot study of a larger sample of 600 occupied homes in three cities in New Brunswick. Results from this larger study will be presented in future publications.
ACKNOWLEDGMENTS
We acknowledge Anca Galasiu (NRC) for online surveys and participant communications; Sandra Mancini (NRC), and Steve Kruithof (NRC) for data management and analysis; Norma McCarthy, and Carol Sharpe, and the Customer Care team (NB Power) for managing the participant recruitment and thermostat installations; Nurul Abser (NB Power) for scheduling DR events and data transfer; Elias Puurunen (Northern HCI Solutions Inc.) for developing the data warehouse and, Trevor Nightingale (NRC) for his feedback and support throughout both investigations.
REFERENCES
[1] NB Power’s 10 Year Plan 2017-2026, October 2015
[2] Pardasani, A.; Armstrong, M, Newhsham, G., Hanson, B., “Intelligent Management of Baseboard Heaters to Level Peak Demand” Proceeding of the16th Annual IEEE Electrical Power and Energy Conference 2016, (Ottawa), 6 pages
[3] Lempereur, D.; Bobker, M. 2004. “Innovative control of electric heat in multifamily buildings,” Proceedings of the 4th International Conference for Enhanced Building Operations (Paris), 10 pages.
[4] Huang, D.-W. 2015. F S Energy, personal communication
[5] Market Development Group. Demand Response Case Study. 4 pages. URL: http://utilityexchange.org/docs/case_city_madison8.pdf
[6] Leduc, M.-A.; Daoud, A.; Le Bel, C. 2011. “Developing winter residential demand response strategies for electric space heating,” Proceedings of Building Simulation 2011 (Sydney), pp. 1111-1118. [7] Fournier, M.; Leduc, M.-A. 2014. “Study of electrical heating setpoint
modulation strategies for residential demand response,” Proceedings of eSim 2014 (Ottawa), pp. 383-396. URL: http://www.ibpsa.org/proceedings/eSimPapers/2014/4A.1.pdf
[8] Fournier, M.; Leduc, M.-A. 2016. Winter demand response using baseboard heaters: achieving substantial demand reduction without sacrificing comfort. Proceedings of ACEEE Summer Study on Energy Efficiency in Buildings (Pacific Grove, CA), 1-1 to 1-12. URL: http://aceee.org/files/proceedings/2016/data/papers/1_88.pdf [9] Steele-Mosey, P.; Steiner, E. 2012. 2011 EM&V Report for the Puget
Sound Energy Residential Demand Response Pilot Program. Navigant Consulting, 127 pages. URL:
http://pse.com/inyourcommunity/kitsap/Documents/BainbridgeIslandDe mandResponseProject.pdf
[10] RECS Public Use Microdata 2009. URL: https://www.eia.gov/consumption/residential/data/2009/index.cfm?view =microdata
[11] HES Public Use Microdata 2007. URL: http://www5.statcan.gc.ca/olc-cel/olc.action?ObjId=16M0001X2010001&ObjType=46&lang=e