HAL Id: hal-01182931
https://hal-enpc.archives-ouvertes.fr/hal-01182931
Preprint submitted on 5 Aug 2015
HAL is a multi-disciplinary open access
archive for the deposit and dissemination of
sci-entific research documents, whether they are
pub-lished or not. The documents may come from
L’archive ouverte pluridisciplinaire HAL, est
destinée au dépôt et à la diffusion de documents
scientifiques de niveau recherche, publiés ou non,
émanant des établissements d’enseignement et de
Solving the clinker dilemma with hybrid output-based
allocation
Frédéric Branger, Misato Sato
To cite this version:
Frédéric Branger, Misato Sato. Solving the clinker dilemma with hybrid output-based allocation.
2015. �hal-01182931�
Solving the clinker dilemma with hybrid output-based
allocation
Frédéric Brangera,b,∗, Misato Satoc,
aCIRED, 45 bis, avenue de la Belle Gabrielle, 94736 Nogent-sur-Marne Cedex, France bAgroParistech ENGREF, 19 avenue du Maine 75732 Paris Cédex
cLSE, Houghton Street, London WC2A 2AE, UK
Abstract
This paper proposes an innovative solution to distribute free allowances to the cement sector under emissions trading systems, called hybrid output-based al-location (OBA). We demonstrate that unlike many of the alal-location methods currently being used, our design provides incentives which are aligned with the mitigation options available to this sector in the short to medium term. Specifically, it increases the incentive to improve the carbon intensity of clinker production; reduces the incentive to import clinker to avoid carbon costs; in-creases the incentive to use more low-carbon clinker alternatives to produce cement; and finally it reduces excess allocation and reduces incentives to inflate production volumes to obtain more free allowances. The hybrid OBA does not, however, provide incentives to reduce the consumption of cement or to bring about break-through technologies, hence should be considered as a mid-term solution to aid the decarbonization of the cement sector in conjunction with other support mechanisms.
Key-words
Emissions Trading; Output-based Allocation; Climate Policy; Cement sec-tor; Clinker dilemma
1. Introduction
In any emissions trading systems (ETS), providing economic incentives to improve environmental performance while effectively protect regulated sectors against carbon leakage1is an important part of its long-term success. A primary
∗Corresponding author
Email addresses: [email protected] (Frédéric Branger), [email protected] (Misato Sato)
1Carbon leakage is defined as the increase in carbon emissions in the rest of the world
fear is that different carbon prices will continue to persist internationally and without effective leakage measures, higher carbon price will induce production and emissions to shift abroad.
Existing trading schemes provide free allocation to Energy-Intensive Trade Exposed (EITE) sectors, typically based on historic emission or historic produc-tion volumes, to provide protecproduc-tion from carbon leakage. Here, the number of free allowances is fixed ex ante. The EU ETS, Kazakhstan ETS, South Korea ETS, and the Chinese ETS pilots all use ex ante allocation.2 However, there
is concern that this method provides weak incentives to drive down emissions. Moreover, it does not adequately prevent carbon because ex ante free allocation simply represents a lump-sum transfer to company owners and the carbon price will pass through to consumers where possible. Operational choices remain un-altered, and incentives to sell unused free allowances and offshore production (and import into the regulated region) are not eliminated.
To move towards a more robust protection against potential leakage, broadly two options have been put forward. The first option, and the one often recom-mended by economists as the first-best option is border levelling (or border carbon adjustments, BCAs) combined with full auctioning (Cramton and Kerr, 2002; Grubb and Neuhoff, 2006; Hepburn et al., 2006). The direct sale of al-lowances by auctioning has significant economic advantages over free allocation. It maximizes the incentive for all emission reduction levers (energy efficiency, fuel switching, breakthrough technologies and demand substitution) (Neuhoff et al., 2014), removes windfall profits to polluters, treats incumbent and new firms on an equal basis, and avoids many other distortions that arise with free allocation. The value of the auction revenues can be used to reduce other dis-tortionary taxes and improve macroeconomic efficiency. However, there remain many aspects to be thoroughly investigated for implementing BCAs, includ-ing legal, practical and political feasibility. Usinclud-ing BCAs in conjunction with auctioning to address carbon leakage is heavily discussed (such as in the now defunct Waxman-Markey bill), but has not yet been implemented in practice.
The second option to counteract leakage is an ex post or output-based alloca-tion (OBA) where free allocaalloca-tion is linked to actual output levels, multiplied by a benchmark. This means that excess allocation and windfall profits are avoided, and the benchmarks provide a focal point for energy efficiency improvements if set at sufficiently ambitious levels. This method ensures better the preven-tion of carbon leakage, because companies incur only the costs of allowances to cover emissions exceeding the benchmark rate, hence limited costs are borne by producers and potentially passed onto product prices. However, OBA is by no means a panacea. Because there is limited carbon cost pass through,
con-the world would be due to (i) a shift of carbon-intensive goods manufacture, caused by an asymmetry of carbon costs (competitiveness channel) (ii) an accrued use of fossil fuels, made cheaper worldwide by a consumption fall in the regulated region (international fossil fuel price channel).
2Some ex post adjustment is also possible in the EU ETS for low activity installations, and
sumers will have limited economic incentive to use carbon intensive products more efficiently or to switch to low-carbon alternatives hence mitigation from demand substitution is forgone. With a limited carbon price signal to the pro-ducers, there is also limited incentive to develop new breakthrough technologies to reduce carbon emissions, such as carbon capture and storage (CCS). Political obstacles are lower for OBA than for the first option. Indeed, it is currently used in the California-Quebec ETS (the two ETS linked in 2014) and in the New Zealand ETS.
Acknowledging its key limitations, this paper focuses on the second option - OBA - as a mechanism to address carbon leakage. One prominent issue aris-ing from OBA applied to the cement sector is the so-called “clinker dilemma” (Demailly and Quirion, 2006; Quirion, 2009; Fischer and Fox, 2012). 90% to 95% of emissions in the cement sector are due to the manufacturing of clinker, an intermediary product. If allowances are distributed in proportion to clinker production (clinker OBA), the incentive to reduce the share of clinker in cement, which has been the main driver of abatement in the cement industry (Branger and Quirion, 2015), is neutralized. Conversely, if allowances are distributed in proportion to production levels of the downstream product cement (cement OBA), there is an incentive for the producer to import clinker (causing carbon leakage), and sell allowances corresponding to saved emissions.3 The clinker dilemma is not fully addressed in the current schemes using OBA.4. Yet the cement industry is the second largest manufacturing sector in terms of emis-sions (in 2012-2013 it represented 6% of EU ETS emisemis-sions, steel standing for 7% (EUTL)), hence emissions at stake in the “clinker dilemma” are important, which makes a case for an adequate policy tackling this issue.
This paper investigates the design of OBA to solve the clinker dilemma. It propose an innovative allowance distribution method for the cement sector called hybrid output-based allocation. As the name suggests, this method combines two benchmarks: one for the carbon intensity of clinker and another for the clinker to cement ratio. Uniquely, we propose expand the scope of mitigation by including clinker grinding stations as ETS installations. This is in contrast to most existing schemes’ rules which cover only integrated clinker-cement
pro-3It is worth noting that the decision on whether to use clinker or cement output for the
allocation base is also necessary in the context of ex ante allocation. Indeed, in the EU ETS Phase 3 (2013-2020) allocation discussions, a controversy emerged on whether to base ex ante free allocation levels on cement or clinker output and benchmark. However, the choice between using cement or clinker output does not have the same consequences with an ex ante and ex post allocation rules. With ex ante allocation, such a choice gives rise only to distributional implications but not incentives implications. Choosing a cement benchmark with ex ante allocation would have involved distributing more allowances to companies that historically had a low “clinker to cement ratio" i.e high carbon intensity cement, but the incentive to lower the clinker ratio would have remained identical. With ex post OBA, however, the choice impacts both. This study focuses on the incentive implications of these allocation rules in the context of output-based allocation.
4See section 8 for a study of incentives in California-Quebec and New Zealand ETS. See also
section 4.2 for the benefits of including grinding stations, which are excluded from California-Quebec and New Zealand ETS, to address the clinker dilemma.
ducing installations. We use a simple model to show that the proposed scheme is superior to allocation methods currently used and provides incentives which are aligned with the mitigation options available to this sector in the short to medium term. Specifically, our hybrid OBA design gives the right incentives in terms of decarbonisation of the cement sector: decreasing the clinker carbon intensity and the clinker ratio without offshoring clinker production. As men-tioned, OBA does not incentivise break-through technologies or demand side substitution, hence these two mitigation channels are not explicitly modelled in this analysis. We also conducted interviews with both industry executives in major cement companies in Europe, as well as EU policy makers, in order to guide the choices of implementation details. While the previous literature on ex ante allocation has shown how incentive distortions can arise from allocation rules (Neuhoff et al., 2006; Branger et al., 2015), this paper represents the first to do so in the context of ex post allocation.
The remainder of the paper is as follows. Section 2 gives a literature review on output-based allocation. Section 3 sets the bases for the analysis: cement production is briefly explained, notations are introduced and the different OBA allocation methodologies are presented, including the new hybrid OBA pro-posal. Section 4 assesses the key advantages of hybrid OBA, by illustrating its incentive properties relative to OBA with a cement or clinker benchmark, and the implication of these different rules on fluctuation of free allocation volume. Section 5 discusses the possible implementation issues hybrid OBA, using a case study of the EU ETS. Finally, Section 6 concludes.
2. Literature review
Studies on OBA are not as numerous as studies on border carbon adjust-ments, the other prominent leakage mitigation policy. Still, the economic lit-erature has well documented the core economic mechanisms involved in OBA, which are the following.
Firstly, by diminishing the perceived carbon cost of home production, OBA levels the carbon playing field, protects the competitiveness of home energy-intensive industry and reduces carbon leakage compared to full auctioning or grandfathering (Jensen and Rasmussen, 2000; Bohringer and Lange, 2005; De-mailly and Quirion, 2006, 2008; Fischer and Fox, 2012). Secondly, it suppresses windfall profits that may occur with ex ante allocation as allocation is adjusted to output (Quirion, 2009). Thirdly, incentives for developing and adopting abatement technologies are preserved (Sterner and Muller, 2008; Zetterberg, 2014), i.e. abatement takes place up to the level where its marginal costs equal the marginal payments for emissions.
These three features are desirable, but the following fourth may not be. By granting more allowances for each additional output produced, OBA acts as a production subsidy. As allowances are lost if production is avoided, allowances do not have and opportunity cost and then carbon price signal is not passed to consumers. Therefore, compared to grandfathering or auctioning, it provides less incentive to reduce the production and consumption of polluting goods. In
the absence of other market failures, the output reduction is then lower than the social optimum, inducing higher overall costs for a given emissions reductions target (Fischer, 2001; Haites, 2003). However in the presence of market failures, such as imperfect coverage (Bernard et al., 2007; Holland, 2012), tax interactions (Goulder, 2002) or imperfect competition (Gersbach and Requate, 2004; Fischer, 2011), the combination of emissions pricing and production subsidy may be welfare-enhancing in theory.
These theoretical effects have been assessed with numerical models that pro-vide several key messages. First, the effect of the implicit subsidy can have significant impact on the allowance price. Fischer and Fox (2007) find that in the US context, the allowance price is considerably higher (44%) under OBA applied to all sectors compared to the other scenarios. The allowance price increase is even higher in Golombek et al. (2013) who focus on the European electricity sector with an extensive numerical model.
Second, OBA bear much less distributional issues at the international level (Böhringer et al., 2012), because they do not provide foreign competitors the incentive to improve the carbon efficiency of production (Fischer and Fox, 2012). However, distributional issues within the abating region are important if OBA does not apply to all sectors. (Fischer and Fox, 2007) find that the emissions reduction burden under OBA shifts from heavy historical producers towards other sectors such as agriculture, construction and final demand.
Third, OBA is outperformed by economy-wide border carbon adjustments in terms of carbon leakage according to most CGE model studies (Böhringer et al., 2012, 2014). However, some models incorporating market failures show that combining auctioning with OBA targeted to energy intensive sectors may be more cost-effective than auctioning alone. This result is obtained by Lennox and van Nieuwkoop (2010) for New Zealand and in the US context by Fischer and Fox (2010) but is not reproduced using the same model for Japan (Takeda et al., 2014).
Fourth, as the coalition gets larger, the efficiency cost of implicit output subsidies ultimately outweigh the benefits from reducing emissions leakage, sug-gesting that OBA is advantageous only in cases where few countries undertake climate policy (Böhringer et al., 2014).
Finally, two models with a more detailed representation of the cement sec-tor give additional insights. (Fowlie et al., 2012) develop a dynamic model with incumbents and entrants of the US cement industry incorporating two fea-tures: oligopolistic competition (which calls for a carbon tax lower than the marginal damage, as pointed out by Buchanan (1969)) and leakage (imports are introduced through a competitive fringe). The comparison of four policies (grandfathering, auctioning, border tax adjustment and OBA) regarding differ-ent exogenous social carbon costs show that in terms of welfare, OBA is the least-worst (but still negative) policy for carbon prices under 45 dollars (being dominated by border tax adjustments otherwise), mostly because other policies induce divestiture and exit leading to increased concentration of the industry. Meunier et al. (2014) using a model that incorporates existing capacities and demand uncertainty find that the optimal rate (in allowances per ton of clinker
produced) for OBA would be almost three times lower than the actual one in Europe.
Overall, there seems to be consensus that OBA, targeted only to energy-intensive industries, represents an attractive option as a mechanism to tackle carbon leakage concerns. However, the overall costs and distributional effects are such that it is likely to be a transitory measure to compensate sectors in the short run until more permanent and efficient solutions are put in place to ad-dress the priorities for emissions trading i.e. efficiency, equity and effectiveness (carbon leakage). Papers such as Quirion (2009) and Heilmayr and Bradbury (2011) suggest that in the longer run, it is socially efficient that the industrial sectors bare a larger share of the emissions reduction burden, as marginal abate-ment costs tend to be higher in other sectors such as transport and agriculture which have fewer low cost abatement options.
Our study is the first one to examine the detailed design of OBA and specif-ically a hybrid OBA for the cement sector.
3. Modelling allocation to the cement sector
3.1. The cement manufacturing process and abatement levers
Cement manufacturing can be divided in two main steps: clinker manu-facturing (90% to 95% of emissions, virtually all from direct emissions), and blending and grinding clinker with other materials to produce cement (gen-erating indirect emissions due to electricity use). Clinker is produced by the calcination of limestone in a rotating kiln, which emits carbon dioxide through two channels. First, the chemical reaction itself releases carbon dioxide (around 0.53 tCO2 per ton of clinker) which accounts for roughly two thirds of carbon
emissions in clinker manufacture. These so-called process emissions cannot be easily reduced.5 The remaining CO
2 comes from the burning of fossil fuel to
heat the kiln.
The two broad options to decrease cement carbon intensity are: i) decreasing the clinker carbon intensity6 and ii) reducing the clinker to cement ratio i.e. substituting clinker with alternative, low-carbon constituents of cement such as blast furnace slag or fly ash.7 The availability of these substitutes varies across regions (Müller, 2012). Alternatively, producers can also reduce their own emissions locally by replacing own clinker production with imported clinker. If the imported clinker is not subject to a carbon price, then this offshoring of clinker production causes carbon leakage and does not reduce global emissions.
5They can only be stored (with CCS), or avoided, through reduced production or
alter-native cements which are at the development stage, such as Novacem (based on magnesium silicates rather than limestone), Calera or Geopolymer (Schneider et al., 2011).
6To decrease the clinker carbon intensity, one can decrease the energy intensity of the kiln,
or use alternative fuels which are less carbon intensive (like biomass). For a detailed analysis of the abatement levers and the decomposition of emissions in the European cement industry, see (Branger and Quirion, 2015).
Table 1: Variables Notation Definition
BC Benchmark for cement carbon intensity
BK Benchmark for clinker carbon intensity
BR Benchmark for clinker ratio
IK Actual clinker carbon intensity of the plant
R Actual clinker ratio of the plant (Q
H K+ QIK
QC
)
QC Cement produced on site
and released onto the market
QK Clinker produced on site (QHK+ Q O K)
QH
K Clinker produced on site
and used on site to produce cement
QO
K Clinker produced on site
and exported
QI
K Clinker imported
and used to produce cement on site
τI Clinker Import Ratio (
QI K
QH K+ QIK
)
τE Clinker Export Ratio (
QOK QH
K+ QOK
)
3.2. Analytical framework
To our knowledge, technical parameters representing abatement levers have never been modelled when studying allocation methods. Usually, a generic abatement function is used and allocation enters the profit function of a firm or sector (the carbon cost is the product of the carbon price and the difference between emissions and allowances) as a simple function of historical output or actual output (e.g. Demailly and Quirion (2006) and Fischer (2001)). Therefore, our contribution is to assess precisely the impact that changes in the technical parameters have on carbon costs.
Before detailing the different allocation rules, we first express cement emis-sions as a function of variables of interest, in order to separate out the different levers of abatement. Notations and definition of variables are summarized in Table 1.
Direct emissions are equal to:
E = IK× QK = IK(QHK+ Q O
K) (1)
IK is the clinker carbon intensity of the plant and QK the amount of clinker
produced on site, which is either used on site to produce cement (QH K), or
exported (QO K).
To produce cement, the plant may also import clinker (QIK), so the clinker ratio can be expressed as:
R = Q H K+ Q I K QC (2) or equivalently the cement production can be expressed as:
QC=
QHK+ QIK
R (3)
QC is the cement produced and used by the final consumer. Strictly
speak-ing, it represents the quantity produced and released into the market.
We define the clinker import ratio, which corresponds to the proportion of clinker in the produced cement that has been imported:
τI = QI K QH K+ Q I K (4) We also define the clinker export ratio, which corresponds to the proportion of clinker produced, that is exported hence not used on site to produce cement:
τE= QO K QH K+ QOK (5) Both τI and τE are comprised between 0 and 1. τI = 0 when the plant does
not import any clinker and τI = 1 when the plant imports all the clinker, for
example a separated grinding station. τE = 0 when the plant does not export
any clinker and τE= 1 when the plant exports all the clinker produced.8
Emissions in Equation (3) can be re-written as:
E = QC× R × IK× QH K+ Q O K QH K+ Q I K = QC× R × IK× 1 − τI 1 − τE (6) Within this framework, a plant has five control variables, which can be distinguished between one quantitative (QC) and four qualitative (IK, R, τI
and τE). Beside reducing the amount of cement produced (QC &), we see that
emissions are reduced when the clinker carbon intensity is reduced (IK &) or
when the clinker-to-cement ratio is decreased (R &). The last factor relates to trade. Emissions are decreased when more clinker is imported (τI %) hence
causing carbon leakage, or less clinker is exported (τE&).
An adequate policy would give incentive to reduce R and IK while staying
as neutral as possible regarding τI and τE.
8There is only one such plant in Europe. Virtually all clinker facilities manufacture cement
3.3. Possible OBA allocation rules: cement, clinker or hybrid
We distinguish three types of rules for OBA: cement OBA (the output is the quantity of cement), clinker OBA (the output is the quantity of clinker) and hybrid OBA (using both outputs and the clinker ratio).
For cement OBA, allocations are equal to the cement benchmark BC
multi-plied by the cement production QC:
AC= BC× QC (7)
For clinker OBA, allocations are equal to the clinker benchmark BK
multi-plied by the clinker production QK:
AK = BK× QK (8)
The hybrid OBA we propose is similar to clinker OBA except for an addi-tional term, rewarding (or discouraging) a low (high) clinker ratio with more (fewer) allowances:
AHyb= BK× QK+ BK(BR− R) × QC (9)
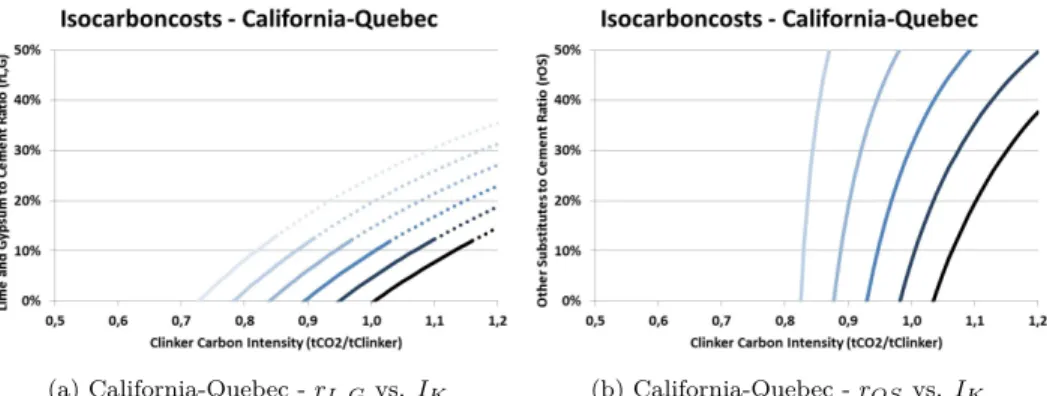
The originality of this hybrid OBA design comes from this relatively straight-forward and single formula. As we will see, this allocation method ensures proper incentives (see section 4.1) and includes all installations (grinding plants and clinker producing facilities) so that the scope of mitigation is expanded, while being neutral regarding the production location (see section 4.2). In what way this equation differs from the California-Quebec and New Zealand alloca-tion rules for cement is discussed in Secalloca-tion 8.
The allocations formulas for the clinker and the hybrid OBA can be re-written in order to ease the comparison with emissions from Equation (6)
AK= BK× QK = BK× [QHK+ Q O K] = BK× R × 1 − τI 1 − τE × QC (10) AHyb= BK× QK+ BK(BR− R) × QC = BK× [QHK+ Q O K] + BK(BR− R) × QC = [BK× R × 1 − τI 1 − τE + BK(BR− R)] × QC (11)
4. Key advantages of hybrid OBA
4.1. Incentive properties
We show that the different OBA allocation methodologies (cement, clinker or hybrid) give incentives to varying degrees on the three different levers of abatement: reducing the carbon intensity of clinker (IK), increasing the clinker
import ratio (τI, we consider τE = 0, that is no exports, throughout the analysis)
and reducing the clinker ratio in cement (R).
Previously, the impact of allocation methods have been modelled using both general equilibrium and partial equilibrium models to quantify outcome vari-ables. Here, we use an alternative, simple approach involving two steps. First, we compute the marginal carbon cost of cement under the three possible OBA allocation methodologies. Then we vizualise the influence of the three param-eters on the marginal carbon cost of cement using graphics representing “iso-carboncost curves”.9 Because there are more than one variable influencing the
marginal carbon costs, we compute isocarboncost curves equations and display two figures for each benchmark method: the plan (R vs. IK, left) holds τI
constant and the plan (τI vs. IK, right) holds R constant.
Using Equation (6) and the previous formulas, we can compute the marginal cost of carbon in cement, which is equal in this case to the mean cost of carbon,
E − A QC
, for the three allocation methodologies:
M CC= 1 − τI 1 − τE × R × IK− BC (12) M CK= 1 − τI 1 − τE × R × [IK− BK] (13) M CHyb= 1 − τI 1 − τE × R × [IK− BK] + BK(R − BR) (14)
The equation of isocarboncosts curves are:
M CC = M C0⇐⇒ R = (1 − τE) M C0+ BC (1 − τI)IK ⇐⇒ τI = 1 − (1 − τE) M C0+ B C IKR (15)
9This method is an application of the isocost curves used in standard microeconomic theory
M CK = M C0⇐⇒ R = (1 − τE) M C0 (1 − τI)(IK− BK) ⇐⇒ τI = 1 − (1 − τE) M C0 (IK− BK)R (16) M CHyb= M C0⇐⇒ R = (1 − τE) M C0+ BKBR (1 − τI)IK+ (τE− τI)BK ⇐⇒ τI = 1 − (1 − τE) M C0+ B K(BR− R) (IK− BK)R (17)
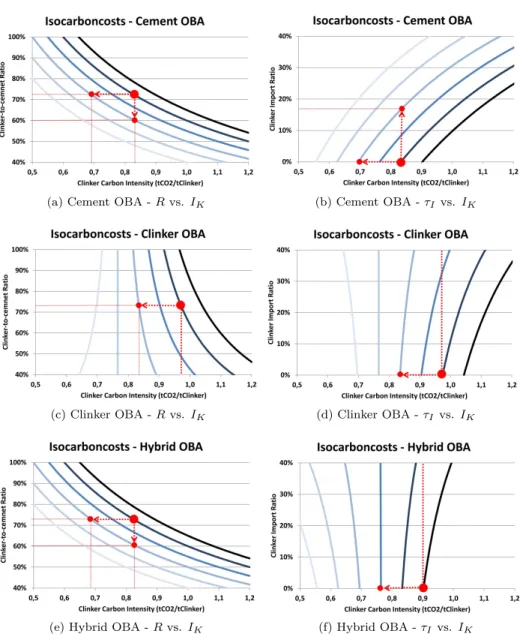
Figure 1 displays the isocarboncost curves for the three types of OBA (ce-ment, clinker, and hybrid). The parameters values cover a wide range: 40% to 100% for the clinker ratio R, 0% to 40% for the clinker import ratio τI, and 0.5
to 1.2 tCO2 per ton of clinker for the clinker carbon intensity IK.
The following explanations with isocarboncosts can apply to a single ce-ment plant, or to a whole company with several plants, using mean values of parameters at the company level.
In the following we use clinker carbon intensity benchmark values BK=766
kgCO2 per ton of clinker (like in the EU ETS), cement carbon intensity
bench-mark BC=450 kgCO2 per ton of cement (same methodology with the
Get-ting the Number Rights (GNR) data (WBCSD, 2009)) and clinker-ratio BR =
BK
BC
=59% (the hybrid and cement OBAs then have the same stringency, see Section 5.1 for the determination of the benchmark values). Furthermore we suppose τE=0% (always), τI=0% in R vs. IK graphs, and R=72% (European
average in 2012) in τI vs. IK graphs, and refer to mean or marginal carbon cost
of cement simply as “carbon cost of cement”.
All points belonging to one curve share the same carbon cost of cement. For example (see Figure 1a), with a cement benchmark, in terms of carbon cost, producing cement with a clinker ratio of 90% and a clinker intensity of 0.670 tCO2 per ton of clinker is equivalent to producing cement with a clinker ratio
of 70% and a clinker intensity of 0.850 tCO2 per ton of clinker (without any
imports or exports). For both, the carbon cost of cement is 0.15 EUAs per ton of cement.
When isocarboncost curves are diagonal, abatement options are substitutable while when they are horizontal or vertical they are not. Figures 1a and 1b show that under cement OBA, the three levers of emissions reduction are in some way substitutable. Let us consider a plant with R=72%, IK=0.835 tCO2 per
ton of clinker, τE=0%, and τI=0%. The carbon cost of cement is 0.15 EUAs
per ton of cement. To reduce this cost to 0.05 EUAs per ton of cement, one can either reduce the clinker ratio to 60%, reduce clinker carbon intensity to 0.695 tCO2per ton of clinker (Figure 1a), or increase the clinker import ratio to 17%
(a) Cement OBA - R vs. IK (b) Cement OBA - τI vs. IK
(c) Clinker OBA - R vs. IK (d) Clinker OBA - τI vs. IK
(e) Hybrid OBA - R vs. IK (f) Hybrid OBA - τIvs. IK Figure 1: Isocarboncosts curves. From lighter to darker: -0.05, 0, 0.05, 0.10, and 0.15 EUA/tCement. Reminder: if 1EUA=10e, then 0.10 EUA per ton of cement translates into 1eper ton of cement. Benchmark values are at BK=766 kgCO2 per ton of clinker, BC=450
kgCO2per ton of cement, and BR=
BK BC
=59%. We suppose τE=0% (always), τI=0% in R vs. IK graphs, and R=72% (European average in 2012) in τI vs. IK graphs.
the benchmark gives the correct incentives to reduce R and IK, these incentives
are dampened by the option to abate via increasing imports. This is because reducing R to 60% is relatively challenging in the short term10, as is adjusting
IK to 0.695 tCO2 per ton of clinker11. In comparison, clinker trade volumes
fluctuate rapidly in response to the imbalance between domestic capacity and demand (Neuhoff et al., 2014). One could argue based on past experience that for relatively low carbon price, the (transport and other trade-related) cost of importing clinker is high enough compared to the potential gain in allowances, such that the risk of carbon leakage with a cement benchmark is not signifi-cant.12 Nonetheless the situation may change if carbon price differentials with
trading partners become more important.
Isocarboncost curves for clinker OBA (Figures 1c and 1d) are very different: curves are much more vertical suggesting the mitigation options are less sub-stitutable. When producing at the clinker benchmark level in terms of clinker carbon intensity (BK=766 kgCO2per ton of clinker), changing the clinker ratio
or the clinker import ratio has no effect whatsoever in terms of the carbon cost of cement. Conversely, when producing below the benchmark (“clean” clinker), there is an incentive to increase R and decrease τI (or increase τE) to increase
carbon benefits. Now let us consider a plant producing above the benchmark (“dirty” clinker), for which R=72%, IK=0.980 tCO2 per ton of clinker and
τI=0%. Again, the initial carbon cost of cement is 0.15 EUAs per ton of
ce-ment and the aim is to reduce this to 0.05 EUA per ton. Here, the plant could: reduce IK from 0.980 tCO2 per ton to 0.840 tCO2 per ton of clinker; decrease
R to 25%; or increase τI to 70%. Thus, this is an attractive approach in terms
of preventing carbon leakage because the incentive to marginally increase τI is
limited, unlike with a cement benchmark. While imports are not explicitly dis-criminated nor a level playing field is achieved between domestic and imported clinker, we demonstrate that having a clinker benchmark goes a long way to dis-courage efforts to increase the share of imported clinker. The major downside of clinker OBA, instead, is that it fails to create robust incentives to reduce the clinker content of cement.
Isocarboncost curves of hybrid OBA (Figures 1e and 1f) present the same characteristics as cement OBA for the R vs. IK diagram, and the same
char-acteristics as clinker OBA for the τI vs. IK diagram13. In other words, hybrid
OBA combines the best of both worlds - it gives the incentive to reduce R and
10Historically, the decline in average clinker ratio has been slow globally. In Europe, it
declined from 78.4 to 72.5 over the period 1990 to 2012 Ref. GNR
11Between 1990 and 2012, the average clinker carbon intensity declined from 0.913 to 0.842
globally, and from 0.911 to 0.841 in Europe. Ref. GNR
12Indeed, with the current allocation system (mostly independent of production), clinker
offshoring allows to benefit from the full opportunity cost of allowances, but econometric studies have not revealed any statistical evidence of an impact of carbon price on clinker net imports (Branger et al., 2013).
13The left shift of the isocarboncosts curves between Figure 1d and Figure 1f is because for
τI vs. IK diagrams, R=75% (>BR), so for a given τIand IK, hybrid OBA is more costly. It would be the opposite if R was lower than the clinker-to-cement benchmark.
IK, while neutralising the incentive to increase τI. Let us consider the same
plant as the cement OBA example (for which R=72%, IK=0.835 tCO2 per ton
of clinker and τI=0%, with a carbon cost of 0.15 EUA per ton of cement).
Again, to reduce the carbon cost to 0.05 EUA per ton of cement, the hybrid OBA provides the correct incentives - the plant can either reduce the clinker ratio to 60% or reduce the clinker carbon intensity to 0.695 tCO2 per ton of
clinker. However, the incentive to increase clinker imports is dampened because even when offshoring 100% of clinker production, the carbon cost would decrease only marginally to 0.10 EUA.
In practice, changing the clinker ratio, the clinker carbon intensity or the clinker import ratio generates costs
depending on many factors, some of which being global or regional (such as energy prices or clinker price on the market) and some of which being lo-cal (availability of clinker substitutes or alternative fuels, transport costs, etc). Each company makes its own optimisation plans and can assess if changing a configuration of cement production is profitable depending on the allowance price. This analysis does not allow for producing quantitative predictions of out-comes (clinker ratio, clinker carbon intensity and clinker trade at the European level) depending on the different OBA rules. It would necessitate a substantial amount of data at the plant and company level (which is clearly out of reach of this study) on top of a complex optimisation model.
Nonetheless, we demonstrated that hybrid OBA induces the same incentive as cement OBA to decrease the clinker ratio and the carbon intensity, and that it induces the same (dis)incentive as clinker OBA to offshore clinker. Therefore, provided implementation costs (discussed in the next section) are not too high, hybrid OBA should be preferred to either a cement or clinker OBA.
4.2. Increasing the scope of mitigation by encouraging clinker substitution across all facilities
We can distinguish two broad types of facilities producing cement:
• “Traditional” or integrated cement plants, producing clinker and cement. There are about 180-190 of such facilities in operation in Europe in 2013.14
Depending on the plant, clinker imports or exports may be more or less important compared to home production.
• Separated grinding stations, which do not produce clinker, but produce ce-ment with clinker produced elsewhere. This process consumes electricity, so in the first approximation these plants have no direct emissions but only indirect emissions due to electricity use. They nonetheless influence over-all cement sector emissions, because their choice of clinker ratio influences clinker production volumes (and thus direct emissions) elsewhere. The majority of grinding stations are owned by companies producing clinker,
although there is a small number of independent grinding stations belong-ing to companies only buybelong-ing clinker in the market. The bulk of clinker used in a typical grinding station comes from the closest clinker plant owned by the same company as the cheapest source of clinker. However, this is changing over time, as inter-company clinker trade has been in-creasing in recent years, and a grinding station may receive clinker from several plants.
Unlike an allocation scheme based on a clinker benchmark, which by defi-nition applies only to installations producing clinker, a cement or hybrid OBA can also be applied to separate grinding stations. Including grinding stations improves the efficiency under the hybrid OBA scheme because:
• Grinding stations play a key role in driving down the clinker ratio in the sector as a whole, typically being located close to sources of clinker substitutes. Indeed, interviews with cement executives confirmed that the availability of substitutes was one of the main determinants for the location of grinding stations, along with access to port facilities and location of demand. Excluding them from the scheme is therefore inconsistent with providing incentives to fully leverage the mitigation potential in this sector via clinker ratio reduction.
• Excluding grinding stations under hybrid OBA could further pave way to possible distortions, because companies would be incentivised to pro-duce low clinker content cement in integrated plants (to receive more al-lowances) and shift the clinker output to produce high clinker content cement in grinding stations outside of the scheme.
Therefore, by including grinding stations into the scheme, the proposed hy-brid OBA allocation design expands the scope of mitigation of the cement sector, providing incentives to maximise clinker substitution across all facilities. It also ensures that the location of the cement production (whether it is in an inte-grated plant or in a grinding station) has no impact on the amount of allocation received, hence this method is neutral regarding the production location, other parameters being constant.15 This is in contrast to existing schemes that do
not include grinding stations hence fails to provide strong economic incentives to maximise the use of clinker alternatives available and make low-carbon cement in grinding stations.
15As a simple example, let us consider a company producing QC cement with a clinker
ratio R (so we have QK = R × QC). An integrated plant would receive the alloca-tion AIntegratedP lant = BK × QK + BK(BR − R) × QC = BK × QK×
BR
R . In case of production in two separated installations, the clinker-producing plant would receive AClinkerP lant= BK× QK (first “part” of AIntegratedP lant) and the grinding station would receive AGrindingStation= BK(BR− R) × QC (second “part” of AIntegratedP lant) so the total allocation is similar as if it was made by an integrated plant. We can verify that it is still the case in a more complex configuration with imports, exports, incomplete transfer of clinker to the grinding station, and production of cement on both sites.
Figure 2: Total EU ETS allowances volume for cement under a cement OBA (C), hybrid OBA (H) and clinker OBA (K)(in millions of EUAs).
4.3. Minimizing fluctuation of allocation volume
Another key advantage with the hybrid OBA is that compared to cement or clinker OBA, fluctuations of the total volume of allowances to the sector are minimised. To illustrate this, Figure 2 displays the level of the cement sector allocation for the EU ETS, under different allocation methodologies: cement OBA (C), hybrid OBA (H) and clinker OBA (K). We compare the case with high production levels and high imports against the case with low production and high exports, also contrasting high or low average clinker ratios (only im-pacting clinker OBA). The orders of magnitude of production and trade are intended to be realistic. High production corresponds to pre-crisis production at the EU ETS level. Low production corresponds to 2013 production. Clinker net imports in the EU 27 were at 14.1 Mt in 2007 (their highest just before the crisis) and clinker net exports were at 7.6 Mt in 2013.16
Changes in the total volume of allowances to the sector are first and foremost driven by changes in production. By definition, in OBA changes in production induce changes in total allocation in similar proportion. However, the magnitude of the changes is lower in the hybrid OBA: [80-106], compared to the cement and clinker benchmarks with [72-117] and [81,148] respectively. Because typi-cally the overall cap of the whole emissions trading system is fixed in line with the region’s mitigation targets17, the reduced uncertainty about the total OBA
16Source: Eurostat: (cement clinker: 252310) http://epp.eurostat.ec.europa.eu/newxtweb/setupdimselection.do.
Clinker imports may be higher in cement OBA, but their magnitude have no impact on the total allocation (which only depends on the quantity of cement produced).
17Approaches to incorporating OBA for a few carbon leakage sectors into a fixed cap scheme
volume is clearly a desirable feature for an output-based allocation.
A change in the clinker ratio has a very important impact on the total al-location in clinker OBA (but as we explain there is not an incentive to reduce the clinker ratio so the observed variation may not be as important). However, the clinker ratio has no impact whatsoever on the total allocation for cement and hybrid OBA. This is logical for cement OBA but could seem surprising for hybrid OBA, as the clinker ratio is used in the computation of the allocation. The reason is as follows. For a given cement production (and a given clinker trade), when the clinker ratio decreases, less clinker has to be produced, so less allowances are given in proportion of clinker output (the first part of hybrid OBA allocation). But this allowances loss is exactly compensated by the “al-lowances bonus” rewarding the decrease of the clinker ratio (the second part of hybrid OBA allocation). Therefore the industry receives the same number of allowances, but emissions are lower because less clinker is produced, so the net allowance balance is positive.
5. Potential implementation issues with hybrid OBA - A case study of the EU ETS
In this section, we explore some of the implementation issues of the hy-brid OBA using as a case study, the EU ETS. We conducted interviews with both industry executives in major cement companies as well as policy makers in Europe, in order to assess feasibility and options regarding the setting of the benchmark, possible additional MRV and administrative challenges, confiden-tiality issues with data disclosure, inclusion of grinding stations, interactions with the cross sectoral correction factor (CSCF), the impact on the overall cap and compatibility with the World Trade Organization rules. Telephone inter-views about one hour each were conducted on 11 individuals in 7 different EU countries between May and July 2015.
5.1. Setting the benchmark 5.1.1. General principles
In terms of their levels, a number of possible options can be envisaged. Benchmarks could reflect Best Available Technology (BAT), sector average, best performers, including outliers (such as the average of the top 10% performing installations) or excluding them (such as the 5th percentile), and so on. The choice requires a trade-off between: providing incentives to improve performance to regulated installations18; simplicity of the rules and harmonisation with other sectors’ benchmarks; maximising auction revenues; mitigating the risk of car-bon leakage/competitiveness losses, acceptability/ resistance from industry; and minimising administrative burden. Clearly, benchmarks set at the BAT provides
18Although in theory the amount of allocation received has no impact on abatement
(Mont-gomery, 1972), several empirical studies showed that in reality there would be a greater incentive to abate when short of allowances (Abrell et al., 2011; Venmans, 2014).
the strongest signal for mitigation. Using the industry average is least likely to encounter industry resistance. Allowing the outliers to be excluded reduces the simplicity of the scheme and reduce rule harmonisation with other sectors.
In the EU ETS Phase 3, the European Commission set a guiding rule for the definition of benchmarks: it should be computed as the average performance in terms of kgCO2 per unit of output of the 10% best performing installations,
based on data in 2007-2008 (European Commission, 2009). The computed value amounted to 766 kgCO2 per ton of clinker, which is used in this paper. In
interviews, we found that respondents favoured this general approach to be applied in a context of hybrid OBA, as a good compromise between providing a realistic abatement signal without punishing the industry leaders.
5.1.2. Combining two benchmarks
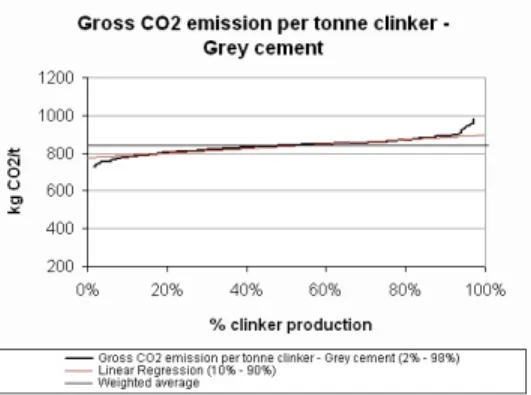
Applying the top 10% performance rule in a hybrid context in this sector, however, can result in a more stringent benchmark on average and thus costlier for the industry than a clinker benchmark. First, this is because of the un-evenness of the distribution of cement carbon intensity (Figure 3b) relative to clinker carbon intensity (Figure 3a),19 a hybrid OBA (similarly to a cement OBA) would be more stringent on average and thus costlier for the industry than a clinker benchmark. It would also imply a higher range of initial car-bon costs across installations (plants with high clinker ratio and a high clinker carbon intensity would be particularly penalized).
Second, the relatively high variance across plants in the clinker to cement ratio curve implies that the average performance of the 10% best installations deviates from the average and represents an ambitious level - approximately 45-50% (see Figure 3c).20 Combining together the two benchmarks (average
10% best performers for clinker carbon intensity multiplied by average 10% best performers for clinker ratio) amplifies this deviation and leads to a stringency level which may be considered unattainable.
One way to address this issue, while still adhering to the principle of setting the benchmark at the average of 10% best performing installations, is to use an inverse approach as follows. First, the average 10% best performers for cement carbon intensity, BC is computed. Figure 3b suggests it would be around 450
kgCO2 per ton of cement.21 Then BR is computed as BR =
BK
BC
' 59%. This
19GNR provides results of linear regressions in the [10%,90%] range. The linear coefficient
for clinker is 1.17 whereas it is 2.34 for cement. This means that the interquartile interval is 58.5 kgCO2per ton of clinker but 117 kgCO2per ton of cement. However a caveat must be
pointed out. Contrary to the clinker distribution curve, the cement distribution curve is not made with individual installations values but with national companies values (combining all clinker and grinding installations of one company in a country), which “flattens” the curve with an averaging effect (source: interview with industry executive). If the cement curve would have been made with individual installations it would have been even steeper.
20We consider in GNR the clinker to cement ratio and not the clinker to cement equivalent
ratio as the latter does not include pure substitutes. The clinker ratio in GNR is coherent with our definition of proportion of clinker in cement.
(a) Clinker carbon intensity (variable 331 in GNR)
(b) Cement carbon intensity (variable 331 in GNR). Cementitious refers to cement produced as it excludes exported clinker) (variable 331 in GNR)
(c) Clinker ratio
Figure 3: Distribution of clinker carbon intensity, cement carbon intensity and clinker ratio in EU 28 in 2012. Source: WBCSD GNR Database
methodology leads to a stringency equivalent to a cement OBA. This inverse method allows to combin two 10% average benchmarks resulting in a “realistic” hybrid benchmark. It is more favourable than to explicitly increasing the value of BR above the average of the 10% performers, as it could set a precedent for
other sectors to negotiate preferential treatment.
5.1.3. Heterogeneity of clinker substitutes and clinker ratio benchmark
Setting a benchmark level for clinker is relatively straightforward given that clinker is a highly homogeneous product. In conrast, setting a benchmark level for the clinker to cement ratio is more difficult because a variety of cement products exist with different technical properties mostly according to the dif-ferent clinker substitutes used (Müller, 2012). The European Cement Standard EN 197-1 differentiates eight types of Portland cement and three types of non-Portland cement depending on cement composition.
Furthermore, the availability of clinker substitutes varies considerably across regions and companies. Fly ash and slag are abundant near coal-fired power plants and steel factories respectively. Pozzolanas (volcanic rocks) are present only in certain regions (in Europe Italy and Greece). Many interviewees ex-pressed concerns that plants without an easy access to clinker substitutes would be unjustly penalised.
In addition, production of some substitutes like slag requires significant cap-ital investment, whereas fly ash as a by product from coal power plants requires limited processing. Third, not all substitutes are equivalent. For example, blending slag or burnt oil shale improves the strength of cement. Using lime-stone requires cement to be grounded finer.
From a climate policy perspective, what matters is the amount of clinker in cement hence all constituents including fly ash from coal combustion, slag from steel production, limestone, gypsum, pozzolana, silica fume and burnt oil shale should be taken into account in the BR definition.
However, the apparent “unfairness” of hybrid OBA is not a good reason to discard this policy. The same reasoning could be used against benchmarks, as rewarding companies with efficient installations at the expense of companies with inefficient plants. The objective of pricing carbon emissions in this sector is precisely to lower the clinker ratio at the European level.
5.1.4. Updating benchmarks
The main trade-off in the decision on how often to revise the benchmarks is between reflecting technological progress, providing predictability for industry and administrative costs. We found in interviews that updating benchmarks every Phase or trading period (whether 5, 8 or 10 years) is a popular option, providing both predictability and administrative ease. Another way to enhance long-term predictability is to announce a long-term trajectory in advance (e.g. based on sector low-carbon road maps such as 400-450 tCO2per ton of cement in
2050) and have an annually declining benchmark in line with these goals. This approach has the additional benefit of better reflecting technological progress,
giving the industry a clear signal as to the rate of mitigation improvement necessary, and avoiding the cross sectoral correction factor (see Section 5.3)
5.2. Administrative costs and challenges
5.2.1. Monitoring, reporting and verification for OBA
In general under OBA (whether cement, clinker or hybrid), authorities have to collect production data at the installation level on a yearly basis to compute allocation at the installation level. Companies record clinker production at the installation level, so for them additional costs of monitoring and reporting are minimal.
However, additional costs are higher for the administrator. They would have to set accounting methods, collect, verify and process the data as well as verify their consistency at the macro level (with production and trade data). The main costs will be upfront and the sequent costs will be proportional to the number of installations. Hence, if limited to a few sectors, the ongoing MRV costs are low as installation numbers are limited. In the context of the EU ETS, moving from the current ex ante system to OBA would significantly decrease other administrative costs specifically relating to new entrants, closure, and activity level thresholds (on top of suppressing their perverse incentives (Branger et al., 2015)).
In addition, we estimate that additional MRV costs compared to a clinker OBA would be relatively low. On top of clinker production for clinker producing plants, cement production and the yearly average clinker ratio for cement pro-ducing installations would also have to be reported. Companies closely monitor these data for optimisation purposes, and most plants in Europe have already been reporting much more detailed information within the Cement Sustainabil-ity Initiative, so supplementary costs for cement companies would also be very small. Again, supplementary costs for the administrator may be higher (a trade-off would have to be set between costs and accuracy) but are largely outweighed by the benefits provided by hybrid OBA (a much bigger incentive to reduce the clinker ratio).
5.2.2. Confidentiality issues around production data disclosure
In the case of clinker OBA or cement OBA, public disclosure of alloca-tions would indirectly reveal production at the installation level (basically di-viding them by the benchmark value22), which can clearly be considered
anti-competitive information. To avoid possible collusions and disclosure of sensitive data, one way to implement OBA in practice is to base the allocation in year t on the output level with a lag of two years (t − 2). For example, the allocation in 2021 would be based on the 2019 output. If there are concerns about large
22However inferring production from allocation is not straightforward with hybrid OBA
be-cause of the second term involving the clinker-to-cement ratio. Excluding CSCF, an allocation of 0.5 MEUAs can be explained by a cement production of 0.92 Mt (with R=95%) or 1.20Mt (with R=50%).
yearly fluctuations in output, it is also possible to smooth the allocation by taking the average of several years, for example the average of t − 2 and t − 3.
5.2.3. Including grinding stations into the scheme
The implementation of hybrid OBA poses additional challenges, one of which is the inclusion separated grinding stations in the scheme. Other than a few ex-ceptions (emissions trading schemes in China include grinding stations because the unit of the regulated entity is the cement company, not the installations.), most ETS schemes only include facilities producing clinker that have direct emissions. Some trading schemes such as the EU ETS cover only direct emis-sions but not indirect emisemis-sions. Thus including grinding stations with zero direct emissions could imply significant changes in the legal basis of the ETS.23 In schemes that cover indirect emissions from electricity, heat or steam (scope 2) the inclusion of grinding stations is legally more straightforward.
Other than legal barriers, there may also be problems with perception be-cause the allowances allocation to grinding stations would often be negative (if cement is produced with a clinker ratio higher than the benchmark). This is similar to give free allowances to renewable electricity generators alongside other power plants. It does not pose problem per se (allowances are not physi-cal commodities but financial assets) but represents a conceptual innovation in emissions trading.
While these barriers exist, as the mitigation targets for the cement sec-tor become more stringent over time, it is likely that the inclusion of grinding stations will be necessary in order to maximise abatement opportunities and meet the target. In practical terms, a grinding station can be included as a sub-installation of a given clinker plant installation, if it is closely linked (geo-graphically or in terms of clinker trade), or as a separate installation.
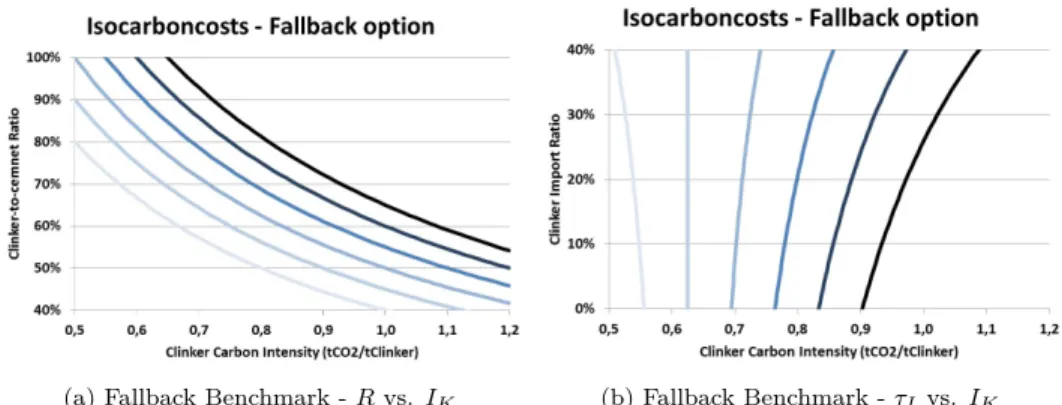
If their inclusion into the ETS is not possible, a fall back option could be to implement a hybrid OBA without grinding stations, as is done by the California-Quebec ETS methodology (see section 8.3). This method can incentivise the reduction of the clinker ratio in integrated plants and at the same time can discourage the offshoring of clinker production. However, it is not neutral re-garding the production location, and it discourages the production of cement in grinding stations.
5.2.4. Distortions in the concrete market
A specificity of the sector could cause some inefficiencies in the proposed scheme: clinker substitution during concrete manufacturing, after the cement manufacturing stage. Indeed some ready-mixed concrete plants blend clinker substitutes with ordinary Portland cement, a high clinker ratio cement, instead of using lower-clinker cement.
23In the EU ETS this requires fundamental changes to the EU ETS Directive.
Grind-ing stations are also excluded from the Integrated Pollution Prevention and Control (IPPC) Directive.
We can expect that hybrid OBA would divert clinker substitutes which used to be directed to concrete plants. They would be directed instead to cement plants, which can gain allowances from a decrease in the clinker ratio. Theo-retically, considering concrete as the final product, alongside with a “clinker to concrete” ratio would eliminate this inefficiency, but concrete plants are very numerous compared to cement plants, hence it would entail heavy administra-tive costs compared to the gains of the avoided distortion (which is likely to be small, this practice being rather marginal). There is also a number of slag grind-ing stations, sometimes belonggrind-ing to companies not producgrind-ing clinker, typically selling slag to concrete plants. These could be part of the scheme by buying clinker and producing cement.
5.3. Cross Sectoral Correction Factor (CSCF)
The current EU ETS allocation methodology includes a Cross Sectoral Cor-rection Factor (CSCF), to ensure that the limit on free allowances, determined by earlier legislation, is not exceeded. This share of free allowances reflects the burden sharing between the power sector and the manufacturing sector. The CSCF amounted to 0.9427 in 2013, decreasing by 0.0174 each year to reach 0.8244 in 2020. The California-Quebec ETS, which is based on OBA, also in-cludes a CSCF (called cap adjustment factor) which also declines over time. How does moving to a hybrid OBA relate to the CSCF?
In the EU, industry strongly disapproved of the implementation of the CSCF, arguing that it made benchmarks unattainable, and that it would make carbon costs rise over time to a worrying point.24 However, as the CSCF was already written in early legislature and voted, it was implemented despite these protests. Yet the premise that benchmarks are targets to reach, so that installations at the benchmark level bear no carbon costs, is flawed in the context of the EU ETS Phase 3 because benchmarks are multiplied by historic (pre-crisis) output and not by actual output as it is the case in the California-Quebec ETS. In the EU, many installations with poor environmental performance actually receive significant overallocation of allowances, and generate “carbon benefits” or “overallocation profits”. Thus in Phase 3, the CSCF has in fact been reducing overallocation to sectors.25 However, moving to an output-based allocation is
more effective in terms of reducing over-allocation, and would make the CSCF obsolete in the short and medium term.
A case could be made for the CSCF to be maintained under a hybrid OBA (possibly under a different name) to provide a signal towards the long term scarcity of allowances. Adding another declining factor is compatible with OBA
24Especially in the cement sector, as two thirds of emissions are process emissions, a decrease
of 1.74% per year of the CSCF must be compensated by an improvement in the “non-process” carbon efficiency by three times the size, to maintain carbon costs, everything else being equal.
25Overallocation resulted from the free allocation being based on high production reference
years, and also from the carbon leakage list which included too many sectors (Clò, 2010; Martin et al., 2014).
and constitutes a political choice.26 In other words, OBA and CSCF are two
separate issues. However, a long term signal could also be achieved with a declining benchmark already mentioned previously, in line with a pre-announced long term mitigation goal based on technology roadmaps.
5.4. Impact of OBA fluctuations on the fixed cap
Unlike ex-ante allocation, an output-based allocation applied to a sector im-plies that the overall sector allocation is uncapped. A number of approaches for absorbing this fluctuation within a capped ETS has been discussed, includ-ing an adjustment of the auctioninclud-ing volume (in present or future years), or an ambition-neutral Allocation Supply Reserve proposed by Ecofys (2014). A tiered approach whereby carbon leakage sectors are grouped into high, medium or low exposure levels, and the high exposed sectors are guaranteed to receive free allowances proportional to 100% output (multiplied by benchmark), and the “slack” is taken up by adjusting the free allocation to the medium and low exposure sectors is also discussed within policy circles.27
Whichever approach is used, it is clear that the fluctuation and hence un-certainty should be minimised. We showed in Section 4.3 that the hybrid OBA is superior to either cement or clinker OBA in this regard.
5.5. Compatibility with World Trade Organization
The WTO was created in order to promote free trade by prohibiting un-justified protectionism or discrimination. The compatibility of border carbon adjustments, a prominent anti-leakage policy, with the WTO has led to an ex-tensive literature without any consensus on the subject (Ismer and Neuhoff, 2007; Zhang, 2012; Low et al., 2011). The majority of authors argue that BCAs would violate the general principle of WTO, however whether or not they could fall under the exception regime (Article XX) is a much debated question.
With hybrid OBA, the geographical origin of clinker imports and the des-tination of clinker exports has no impact on the quantity of allowances pro-vided.28 Foreign plants are excluded from the scheme so foreign companies are not directly impacted financially. The level of benchmarks and the output-based system ensures that incurred carbon costs are low and on average positive, so that that free allocation does not constitute a discriminating subsidy, penalising foreign competitors.29 In summary, it is very unlikely that hybrid OBA would be challenged at the WTO.
26The intent here is to focus on the design of hybrid OBA for the cement sector and not
discuss at length alternatives for the CSCF.
27Ref. Interview with policy maker.
28Some interviewees expressed concerns that the risk of carbon leakage could be mitigated
without considering clinker differently if clinker produced in Europe and imported clinker from outside Europe. The analysis in section 4.1 proved that hybrid OBA was as efficient as clinker OBA to disincentivise clinker offshoring.
6. Conclusion
We proposed in this paper a hybrid OBA which would solve the clinker dilemma by bringing the best of clinker OBA and cement OBA. This unique allocation method can be expressed in one straightforward formula (Equation 11). We have shown that this allocation method is superior to the allocation methods currently used:
• It provides incentives which are aligned with the mitigation options avail-able to this sector in the short to medium term i.e. it provides an incentive to reduce the clinker carbon intensity and the clinker to cement ratio while disincentivising the offshoring of clinker production (see section 4.1). • On the latter point, while hybrid OBA does not explicitly address the issue
of creating a level playing field between domestic and imported clinker, our analysis in section 4.1 showed that hybrid OBA is as efficient as clinker OBA to disincentivise clinker offshoring.
• It expands the scope of mitigation by expanding the ETS to include all installations (grinding plants and clinker producing facilities) and ensur-ing a system which is neutral to the production location. For example, producing lower-carbon cement in grinding stations with cheap access to clinker substitutes is not penalised, relative to producing higher-carbon cement in integrated cement-clinker plants (see section 4.2).
• Relative to an OBA with a cement or clinker benchmark, fluctuations of the total volume of allowances to the sector is minimised with a hybrid OBA (see section 4.3).
• Relative to ex ante allocation, hybrid OBA ensures the prevention of car-bon leakage and reduces the risk of excess allocation.
• Without excess allocation, the benchmarks under hybrid OBA can pro-vide a focal point for energy efficiency improvements if set at sufficiently ambitious levels.
• It also removes the perverse incentives that occur in some allocation de-signs, which encourage excess production of clinker in order to obtain more emission allowances.
We argued that the two common objections to hybrid OBA – administrative complexity and the geographical heterogeneity of clinker substitutes which give an advantage to low-carbon cement producers with access to cheap clinker sub-stitutes - do not represent major impediments (see section 5.2 and 5.1.3). The inclusion of grinding plants into ETS may be difficult legally, politically and administratively but fall back options exist (see section 5.2.3). We have been explicit from the beginning about the two more fundamental shortcomings of this approach:
• It does not give enough incentive for demand substitution, as it blocks carbon costs from being reflected in final goods prices.
• It does not promote radical technological innovation in the sector. Both shortcomings are related because without a carbon price signal, cement consumers tend to resist against new, untested products which in turn acts as a barrier for cement producers to reduce the clinker content of cement.30 These are
important impediments to the long-term decarbonisation of the cement sector, and we therefore argue that hybrid OBA should be seen as a short or medium term solution, while transitioning to a more robust leakage prevention regime. Specifically, a consumption levy could be implemented on cement as proposed in (Neuhoff et al., 2014), to help stimulate demand for low-carbon cement. It could be applied to clinker (in addition to clinker OBA), but it could also apply on cement (with possibly lower administrative costs) as an input to concrete. Another solution for the long term is to implement border carbon adjustments with full auctioning.
A challenge remains in the long term to close the emissions gap between what technology roadmaps enable (IEA, 2009), and the emissions trajectories needed to avoid detrimental climate change. Providing free allocation in propor-tion to output to this sector may certainly not promote radical innovapropor-tion, but auctioning alone may not be sufficient either. Emissions trading schemes must then be completed with ambitious policies to correct market failures. Significant public investment will be necessary to bring about carbon dioxide capture and storage (CCS) demonstration plants. To encourage more efficient use of cement in buildings or the development of new low-carbon materials, public funding will likely be necessary as well as changes to building regulations and standards. At the same time, reforming the ETS will also play an important role. For example a price floor rising over time, as in the California-Quebec ETS, certainly gives the right signal to investors in new low-carbon building materials.
7. Acknowledgments
The authors wish to acknowledge the following people for their helpful com-ments and suggestions in the writing of this paper: the 10 persons who par-ticipated in the expert telephone interviews, Philippe Quirion and Bruno Van-derborght. Misato Sato gratefully acknowledges financial support from Euro-pean Community’s Seventh Framework Programme under Grant Agreement No. 308481 (ENTRACTE) the Grantham Foundation and the ESRC through the Centre for Climate Change Economics and Policy.
30Clinker substitution can change the technical properties of cement incuding strength and
References
Abrell, J., Faye, A. N., and Zachmann, G. (2011). Assessing the impact of the EU ETS using firm level data. Brussels: Bruegel.
Bernard, A. L., Fischer, C., and Fox, A. K. (2007). Is there a rationale for output-based rebating of environmental levies? Resource and Energy
Eco-nomics, 29(2):83–101.
Böhringer, C., Carbone, J. C., and Rutherford, T. F. (2012). Unilateral climate policy design: Efficiency and equity implications of alternative instruments to reduce carbon leakage. Energy Economics, 34, Supplement 2:S208–S217. Böhringer, C., Fischer, C., and Rosendahl, K. E. (2014). Cost-effective unilateral climate policy design: Size matters. Journal of Environmental Economics
and Management, 67(3):318–339.
Bohringer, C. and Lange, A. (2005). Economic Implications of Alternative Allocation Schemes for Emission Allowances*. Scandinavian Journal of
Economics, 107(3):563–581.
Branger, F., Ponssard, J. P., Sartor, O., and Sato, M. (2015). Distortions from Activity Level thresholds in the EU-ETS. Evidence from the cement sec-tor. Journal of the Association of Environmental and Resource Economics
(Forthcoming).
Branger, F. and Quirion, P. (2015). Reaping the carbon rent: Abatement and overallocation profits in the European cement industry, insights from an LMDI decomposition analysis. Energy Economics, 47:189–205.
Branger, F., Quirion, P., and Chevallier, J. (2013). Carbon leakage and com-petitiveness of cement and steel industries under the EU ETS: much ado about nothing. Working Paper CIRED DT/WP No 2013-53.
Buchanan, J. M. (1969). External Diseconomies, Corrective Taxes, and Market Structure. The American Economic Review, 59(1):174–177.
California Air Resources Board (2011). Cap-and-Trade Regulation Discussion Draft. Appendix B: Development of Product Benchmarks for Allowance Allocation. Technical report.
Clò, S. (2010). Grandfathering, auctioning and Carbon Leakage: Assessing the inconsistencies of the new ETS Directive. Energy Policy, 38(5):2420–2430. Cramton, P. and Kerr, S. (2002). Tradeable carbon permit auctions: How and
why to auction not grandfather. Energy policy, 30(4):333–345.
Demailly, D. and Quirion, P. (2006). CO2 abatement, competitiveness and leak-age in the European cement industry under the EU ETS: grandfathering versus output-based allocation. Climate Policy, 6(1):93–113.