Publisher’s version / Version de l'éditeur:
The Astrophysical Journal, 835, 2, 2017-02-01
READ THESE TERMS AND CONDITIONS CAREFULLY BEFORE USING THIS WEBSITE. https://nrc-publications.canada.ca/eng/copyright
Vous avez des questions? Nous pouvons vous aider. Pour communiquer directement avec un auteur, consultez la première page de la revue dans laquelle son article a été publié afin de trouver ses coordonnées. Si vous n’arrivez pas à les repérer, communiquez avec nous à [email protected].
Questions? Contact the NRC Publications Archive team at
[email protected]. If you wish to email the authors directly, please see the first page of the publication for their contact information.
NRC Publications Archive
Archives des publications du CNRC
This publication could be one of several versions: author’s original, accepted manuscript or the publisher’s version. / La version de cette publication peut être l’une des suivantes : la version prépublication de l’auteur, la version acceptée du manuscrit ou la version de l’éditeur.
For the publisher’s version, please access the DOI link below./ Pour consulter la version de l’éditeur, utilisez le lien DOI ci-dessous.
https://doi.org/10.3847/1538-4357/835/2/123
Access and use of this website and the material on it are subject to the Terms and Conditions set forth at
Globular clusters as tracers of fine structure in the dramatic shell
galaxy NGC 474
Lim, Sungsoon; Peng, Eric W.; Duc, Pierre-Alain; Fensch, Jérémy; Durrell,
Patrick R.; Harris, William E.; Cuillandre, Jean-Charles; Gwyn, Stephen;
Lançon, Ariane; Sánchez-Janssen, Rúben
https://publications-cnrc.canada.ca/fra/droits
L’accès à ce site Web et l’utilisation de son contenu sont assujettis aux conditions présentées dans le site LISEZ CES CONDITIONS ATTENTIVEMENT AVANT D’UTILISER CE SITE WEB.
NRC Publications Record / Notice d'Archives des publications de CNRC:
https://nrc-publications.canada.ca/eng/view/object/?id=bfe67877-eb0c-46bd-8d76-7ffcbfb8ad16 https://publications-cnrc.canada.ca/fra/voir/objet/?id=bfe67877-eb0c-46bd-8d76-7ffcbfb8ad16Globular Clusters as Tracers of Fine Structure in the
Dramatic Shell Galaxy NGC 474
Sungsoon Lim1,2, Eric W. Peng1,2, Pierre-Alain Duc3, Jérémy Fensch3, Patrick R. Durrell4, William E. Harris5, Jean-Charles Cuillandre6, Stephen Gwyn7, Ariane Lançon8, and Rúben Sánchez-Janssen9
1
Department of Astronomy, Peking University, Beijing, 100871, China;[email protected],[email protected]
2
Kavli Institute for Astronomy and Astrophysics, Peking University, Beijing, 100871, China
3
Laboratoire AIM Paris-Saclay, CNRS/INSU, Université Paris Diderot, CEA/IRFU/SAp, F-91191 Gif-sur-Yvette Cedex, France
4
Department of Physics and Astronomy, Youngstown State University, Youngstown, OH 44555, USA
5
Department of Physics & Astronomy, McMaster University, Hamilton, ON, Canada
6
Canada–France–Hawaii Telescope Corporation, Kamuela, HI 96743, USA
7
Herzberg Institute of Astrophysics, National Research Council of Canada, Victoria, BC, V9E 2E7, Canada
8
Observatoire Astronomique de Strasbourg, Université de Strasbourg, CNRS, UMR 7550, 11 rue de lUniversité, F-67000 Strasbourg, France
9
STFC UK Astronomy Technology Centre, The Royal Observatory Edinburgh, Blackford Hill, Edinburgh, EH9 3HJ, UK
Received 2016 June 23; revised 2016 December 8; accepted 2016 December 11; published 2017 January 23
Abstract
Globular clusters (GCs) are some of the most visible tracers of the merging and accretion histories of galaxy halos. Metal-poor GCs, in particular, are thought to arrive in massive galaxies largely through dry, minor merging events, but it is rare to see a direct connection between GCs and visible stellar streams. NGC 474 is a post-merger early-type galaxy with dramatic fine structures made of concentric shells and radial streams that have been more clearly revealed by deep imaging. We present a study of GCs in NGC 474 to better establish the relationship between merger-induced fine structure and the GC system. We find that many GCs are superimposed on visible streams and shells, and about 35% of GCs outside R3 e,galaxy are located in regions of fine structure. The spatial correlation between GCs and fine structure is significant at the 99.9% level, which shows that this correlation is not coincidental. The colors of GCs on fine structures are mostly blue, and we also find an intermediate-color population that is dominant in the central region and that will likely passively evolve to have colors consistent with a traditional metal-rich GC population. The association of the blue GCs with fine structures is direct confirmation that many metal-poor GCs are accreted onto massive galaxy halos through merging events and that the progenitors of these mergers are sub-L galaxies.
Key words:galaxies: elliptical and lenticular, cD – galaxies: evolution – galaxies: formation – galaxies: individual
(NGC 474) – galaxies: star clusters: general
Supporting material:machine-readable table
1. Introduction
In the current view regarding galaxy formation, galaxies are formed by the hierarchical assembly of smaller subcomponents. In massive galaxies, this is visible in the outer regions, which are expected to grow through multiple dry mergers of low-mass, relatively metal-poor galaxies (e.g., Naab et al. 2009; Oser et al.2010). This merging is also thought to be the origin of metal-poor globular clusters (GCs) in massive early-type galaxies (Côté et al.1998; Li & Gnedin 2014).
GCs are powerful tools for studying the assembly of their host galaxies. They are formed in intense star-forming events and can survive a Hubble time. They are also abundant in galaxies, across many orders of magnitude in mass. Con-veniently, the relatively high surface brightness of GCs makes them observable in distant galaxies.
Metal-rich GCs are formed in major, gas-rich mergers of relatively massive systems, where the star-forming gas is more enriched. Many theoretical studies support this formation mechanism of metal-rich GCs (e.g., Bournaud et al. 2008; Kruijssen et al. 2012; Renaud & Gieles 2013; Li & Gnedin 2014; Renaud et al. 2015). Several observational studies also support this formation scenario (e.g., Whitmore et al.1993; Sikkema et al.2006; Trancho et al.2014). Metal-rich GCs can also form in gas-Metal-rich, high redshift disk galaxies (e.g., Shapiro et al.2010; Kruijssen2015).
Metal-poor GCs, however, are thought to form in low-mass galaxies. When seen in halos of massive galaxies, these GCs are thought to be the visible remnants of minor merging events (Côté et al. 1998; Tonini 2013). There is much indirect evidence that the metal-poor GCs in dwarfs are related to those in the halos of massive galaxies. The specific frequency (SN)of metal-poor GCs is as high in massive galaxies as it is in some dwarfs. In the Virgo cluster, there is evidence that SNin dwarfs is higher when they are closer to the central galaxy, M87, indicating that they may contribute to the progenitor population of the M87 metal-poor GC population (Peng et al. 2008). Moreover, these satellite dwarfs have the high [α/Fe] seen in galaxy halo stars (Liu et al.2016). The azimuthal distributions and ellipticities of metal-poor GCs are also generally uncorrelated with those of their host galaxies (Park & Lee
2013; Wang et al.2013), suggesting a random merger history. The kinematics of metal-poor GCs and stars in the outskirts of galaxies are also different from those of stars in the inner regions (Pota et al. 2013; Li et al. 2015; Foster et al.2016). While all these observations suggest that metal-poor GCs in massive galaxies come from accreted galaxies, the process has rarely been observed directly. One of the few exceptions has been the M31 PAndAS survey, which revealed two GCs associated with visible stellar substructures (Huxor et al.2014). Another example is NGC4651, a late-type spiral galaxy (Sc)
835:123 (6pp), 2017 February 1 doi:10.3847/1538-4357/835/2/123
that has GCs associated with currently observed streams and shells (Foster et al. 2014). These examples are late-type galaxies, and there is only one example of a giant elliptical galaxy (NGC4365) that has GCs related to the stellar stream (Blom et al.2012).
Establishing the link between GCs and mergers in the halos of massive early-type galaxies is difficult because GCs are a sparse population and stellar substructures from merging have very low surface brightness. Studies of GC systems in shell galaxies with HST (Sikkema et al.2006)have not had the field of view necessary to probe the outermost substructures, where we expect the GC population to be dominated by the accreted component. The Mass Assembly of Early-Type Galaxies with Their Fine Structures (MATLAS; Duc et al.2015)survey is the first systematic, wide-field imaging survey that goes deep enough in surface brightness to reveal merging substructure and simultaneously has a good image quality for unresolved sources to allow a detailed study of the corresponding GC systems. To demonstrate the potential of the survey data, in this paper, we present a study of GCs in the spectacular post-merger galaxy NGC 474.
2. Observations
The observations were part of MATLAS, a Canada–France– Hawaii Telescope (CFHT) Large Program to obtain deep, multiband optical imaging for 260 ATLAS3D galaxies (Cappellari et al. 2011) using MegaCam on CFHT. The detailed strategies for dithering and stacking images are described in Duc et al. (2015). However, the stacking for the GC analysis in this paper is done slightly differently. While background subtraction is done as described in that paper, MegaPipe (Gwyn 2008) is used to do a high-precision astrometric and photometric calibration. The MegaPipe output image stacks are produced at the full CFHT resolution, whereas the earlier image stacks were binned on a 3×3 pixel grid.
NGC474 is one of the most interesting galaxies in the MATLAS sample (D=30.9 Mpc; Cappellari et al.2011). It is well known as a shell galaxy (Turnbull et al. 1999; Sikkema et al.2007), and deep u*-,g -,¢ r -, and¢ ¢i-band imaging reveals
very complex but clear fine structures made of concentric shells in addition to radial structures (Figure 1), particularly in the halo regions, where we can easily distinguish fine structures from the smooth stellar light. The accumulated exposure times are 4900, 2415, 2415, and 3220 s for u*, g ,¢ r , and¢ ¢i,
respectively.
We use Source Extractor (Bertin & Arnouts1996)for source detection and photometry. Dual-image mode photometry is adopted, with the r-band image used as the detection image. We use circular apertures with various radii for estimating the fluxes of sources. All aperture magnitudes are corrected to the 16 pixel diameter aperture magnitudes. These instrumental magnitudes are transformed to standard AB magnitudes by comparison with SDSS PSF magnitudes. The methods for source detection and aperture photometry are similar to those adopted in Durrell et al. (2014) and Liu et al. (2015). The foreground reddening toward NGC474 is (E B-V)=0.04 (Schlegel et al. 1998), and the corresponding extinction correction terms are included in the following analysis. At the distance of NGC 474, most GCs are pointlike sources, so we select point sources using a concentration index with a magnitude limit of mg ,0¢ 25. At the distance of NGC474, this magnitude limit should include roughly half of the GCs.
The concentration index is calculated based on the differences between 4 pixel diameter and 8 pixel diameter aperture magnitudes. Among the pointlike sources, we select GC candidates based on their colors in the (u* - ¢ -g)0 (g¢ - ¢i)0 color–color diagram (Figure2).
3. Results
3.1. Global Properties
Figure1shows the spatial distribution of GC candidates and fine structures in NGC474. The inner region of NGC474 suffers from incompleteness due to bright stellar light and the difficulty of detecting GCs on the inner fine structures. Therefore, we only analyze the GC system beyond R1 e,galaxy (0 55), out toR=15 . Using our GC selection in regions well¢ away from the Galaxy (beyond the regions shown in Figure1), we estimate the level of background contamination to be 0.03 arcmin−2
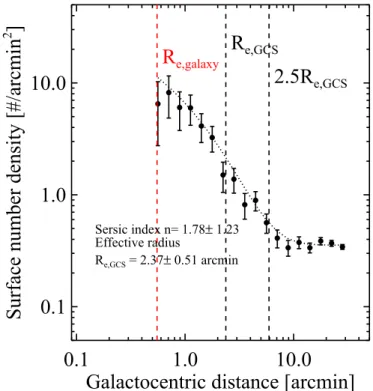
. We fit the azimuthally averaged radial surface density profile of the GCs with a Sersić profile using maximum likelihood estimation and determine the uncertainties in the fitted parameters using the bootstrap. The effective radius and
Sersić index of the GC system are Re,
GCS= 2 37 ± 0 51(21.1 ± 4.5 kpc at the distance of NGC 474) andn=1.781.23, respectively (Figure 3). The Sersić index has a large uncertainty because it is sensitive to the lack of information in the central region. The effective radius of the GC system is about four times as large as that of the stars. This relation is consistent with the result from Kartha et al. (2014). For the analysis below, we choose GC candidates within 2.5Re,GCS, represented by the largest circle (red) in Figure1. To estimate contamination, we choose a control field between 5Re,GCS and 6Re,GCS. There are 144 GC candidates within2.5Re,GCS, and the estimated background contamination value for this area is about 34. The number density of sources that satisfy the GC selection criteria in the control field gives the statistical estimate of the contamination. Table1shows the list of GC candidates in2.5Re,GCS.
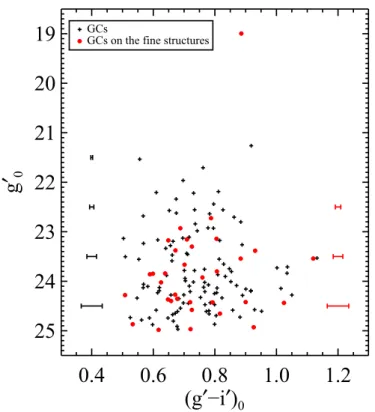
Figure4shows the (g¢ - ¢ - ¢i)0 g0color magnitude diagram
of GC candidates within 2.5Re,GCS. The GC candidates are divided by their location off or on the fine structures. The brightest GC candidate hasg0¢ ~19, but most GC candidates are fainter than g0¢ ~21. Color ranges and errors are not location-dependent, but GC candidates on the fine structures tend to be fainter that those off the fine structures. The color errors are quite small (<0.1) even with a faint magnitude bin. Figure 5 shows the (g¢ - ¢i)0 GC color histograms. The color distribution of the GC candidates ranges from (g¢ - ¢ =i)0 0.5mag to (g¢ - ¢ =i)0 1.15mag and has a peak at (g¢ - ¢ ~i)0 0.75mag. We note that GC candidates redder than (g¢ - ¢ =i)0 0.9mag are rare. Background contamination should not affect the shape of color distribution, as the color distribution of selected background objects is relatively flat. We fit the color histograms with Gaussian functions using the Gaussian mixture modeling (GMM) code (Muratov & Gnedin 2010). To subtract background contamination, we adopt the following steps: (1) We estimate the total number of contaminants, 34, based on the GC number density of the control field. (2) We randomly select 34 GCs in the control field and subtract 34 GCs in the target region that have similar colors to the selected GCs from the control field. (4) The widths for the two Gaussian functions are free parameters, and we run GMM 1000 times with a random subtraction of background
Figure 1. Spatial distribution of GC candidates centered on NGC474. The coordinates are J2000. Small open circles represent the GC candidates of NGC474. The sizes show the g-band magnitudes of GC candidates with the size scale displayed on the top left. The two large circles (inner and outer) centered on the galaxy show 3 effective radii for the stars and 2.5 effective radii for the GC system. Dashed lines indicate the rough boundaries of fine structures, with numbers labeling interesting substructures. The color image was made with gri model-subtracted images. The field of view is 15′×15′, corresponding to135 kpc´135 kpc in NGC474 distance.
Figure 2. (u* - ¢g)0vs. (g¢ -i)0color–color diagram of point sources. Small
dots represent the point sources in this study. Filled circles indicate the colors of spectroscopically confirmed GCs of M87 in previous studies to guide the location of GCs in the color–color diagram (Hanes et al. 2001; Strader et al.2011; Zhang et al.2015). We drew the dashed polygon based on M87 GCs and chose GC candidates in NGC 474 using this polygon.
Figure 3. Number density profile of GC candidates. Filled circles with error bars show the number density of GC candidates with binned areas and its errors. The dotted line represents the best fit with a Sersić function, including the background. The vertical dashed lines represent the effective radius of the galaxy, the effective radius of the GC system, and the 2.5 effective radius of the GC system, respectively.
contamination. The GMM code provides the blue and red peaks of color distribution and the Dvalue. The D value shows the separation of the two peaks relative to their width, and two-Gaussian fitting is meaningful whenD>2. The mean D value for the 1000 GMM trials is 3.00, and its standard deviation is 0.36. This suggests that the color histogram of GCs in NGC 474 is better explained by a bimodal distribution than by a unimodal distribution, although this is likely due to the tail of red GCs. Dust in NGC 474’s shells (e.g., Sikkema et al.2007) could also cause the reddening of GC colors, but we see no correlation between the location of the red GCs and the position relative to the shells. The two Gaussian distributions have means at (g¢ - ¢ =i)0 0.710.02 and 0.96±0.09, respectively, and these values are consistent with expected color peaks from the empirical relations between GC peak colors and galaxy luminosity (Peng et al.2006).
3.2. Fine Structures
The fine structures of NGC 474 are very complex and have been discussed previously (Turnbull et al. 1999; Duc
et al.2015). Two relatively bright substructures are located at the east and west sides (1 and 2 in Figure 1, respectively). Substructure (2) has a tail which seems to penetrate the central region of NGC 474. A tidal stream (3) crosses the main body of NGC 474 from the north to the south. Tidal streams are also found in the southern area (4). These streams (4) may be linked with the tail of substructure (2). There is also a bright shell structure to the north of the central region (5). Many shell structures are seen in the inner regions of NGC 474, but some of them may be due to imperfect model subtraction. We ignore these structures for the purposes of this study.
To estimate the number and properties of GCs on the fine structures, we define an area that includes all regions described above except for the central region (R< ¢ »1. 7 3Re,galaxy). We exclude the inner1. 7 due to confusion between fine structures¢ and undersutracted regions. The area of the fine structures is 16% of the total area in the range1. 7¢ <R<2.5Re,GCS. We find 32 GC candidates superimposed on these fine structures, about 35% of all GCs beyond 1. 7, after background¢ subtraction. These numbers are increased when we include
Table 1
A Catalog of the Globular Clusters in NGC 474
ID R.A. Decl. g0 (u-g)0 (g-r)0 (g-i)0 (J2000) (J2000) [mag] 121 20.05616177 3.48833758 19.00±0.00 2.37±0.00 0.65±0.00 0.89±0.00 33 19.99084420 3.43659182 21.26±0.00 2.18±0.01 0.59±0.00 0.92±0.00 64 20.01865022 3.33998520 21.53±0.00 1.36±0.01 0.38±0.01 0.56±0.01 36 19.99918751 3.39075644 21.71±0.00 1.76±0.02 0.48±0.01 0.76±0.01 6 19.94028364 3.43017381 21.96±0.01 1.69±0.02 0.47±0.01 0.70±0.01
(This table is available in its entirety in machine-readable form.)
Figure 4. (g¢ -i)0-g0 color magnitude diagram of GC candidates within
R
2.5 e,GCS. Crosses and filled circles show the GC candidates off and on the fine
structures, respectively. The error bars on the left side and right side represent the color errors of GC candidates off and on the fine structures, respectively.
Figure 5. Color histogram of GC candidates in NGC474. (Top) The solid line shows the color histogram for all GC candidates within the 2.5 effective radius of the GC system. The dotted line (blue) displays the color histogram of background contamination (the histogram of GC candidates in the control field, corrected for area). (Bottom) The solid line (red) represents the background-subtracted color histogram of GC candidates within the 2.5 effective radius of the GC system. Dotted lines show the fitted Gaussian functions.
less prominent fine structures. Interestingly, five GC candidates are found on bright substructure (1) to the east.
To determine the significance of this positional correlation, we perform a Monte Carlo experiment that produces random GC positions from a smooth GC profile. There are 94 GC candidates with 1. 7¢ <R<2.5Re,GCS. We create random samples of 94 GCs where the position angle θ is uniformly random and R is randomly sampled from the best-fit Sersić profile within the radius limits. We do this 100,000 times and find that only 0.11% of the samples show an equal or greater number of GCs superimposed on the fine structures compared to the real data. We also do the same test for bright substructure (1) to the east, and only 0.09% of results show an equal or greater number of GCs on the bright substructure compared to the real data. These results suggest that the GCs on the fine structures are physically associated with the fine structures with ∼99.9% confidence.
3.3. Colors of GCs on Substructures
Figure 6 displays a color histogram of GC candidates in different subregions of NGC474. The colors of GCs in the
central region (Figure 6(a)) have a peak at
(g¢ - ¢ ~i)0 0.85mag, which means that GCs in the central region have mostly intermediate color. To better reveal this intermediate-color population, we subtract the double Gaussian function fit to the color distribution of all GCs within 2.5 Re,GCS from the color histograms of GCs in the subregions. There is an excess at (g¢ - ¢ ~i)0 0.85mag with GCs in the central region, although GCs in the other subregions show excesses at the blue color ((g¢ - ¢ ~i)0 0.7)or no excess. GCs in the outer region (Figure6(b)) and on fine structures (Figure6(c)) have similar colors because a large portion of their areas is the same. In both
cases, blue GCs are dominant. The colors of GCs on the fine structures are slightly bluer than the mean of the blue peak for the total population (shown by the Gaussian curves). GCs on
bright substructure (1) are mostly blue, with
(g¢ - ¢ ~i)0 0.7mag (Figure6(d)).
4. Discussion and Conclusion
In this study, we find that there is a significant correlation between the GC spatial distribution and the locations of low surface brightness fine structures. Moreover, we find that GCs superimposed on the fine structures are mostly blue. At least ∼35% of outer GCs are visibly associated with recent merging. Bright substructure (1) at the east side of NGC 474 is highly likely to be the remnant of an accreted dwarf galaxy. We roughly estimate the magnitude and color of substructure (1) to beg¢ ~15.5 mag and (g -i)0~0.6, respectively. The color of this substructure is similar to the peak color of the GCs on it, suggesting that substructure (1) and the GCs on it have similar stellar populations. The absolute magnitude of this substructure is about Mg¢~ -17.0, which is on the luminous side for a dwarf galaxy but still sub-L . We obtain a GC specific
frequency ofSN~1using the number of GC candidates on this feature. This SN value is a typical value for galaxies with a
similar luminosity (Peng et al.2008), so it may support the idea that GC candidates that lie in projection on this substructure are actually physically associated with the substructure.
We have also found intermediate-color GCs in the central region. Intermediate-color GCs in merger remnant galaxies are mostly explained as intermediate-age GCs (e.g., Trancho et al. 2014). The ATLAS3D survey revealed that the mean age of the stellar population in the central region of NGC474 is 7.65±1.39 Gyr (McDermid et al. 2015), which makes it younger than the massive cluster early-type galaxies typically studied. The intermediate-color GCs could therefore also have younger ages. We suggest that the intermediate-color GCs are GCs formed in situ when star formation occurred at least 7–8 Gyr ago.
One interesting result in this study is the lack of red GCs. We find that the fraction of red GC candidates within2.5Re,GCS is about 20%. Peng et al. (2006), however, showed that the red GC fraction for a galaxy with similar luminosity to NGC474 should be about 50%. Peng et al. (2006) only studied the central regions of galaxies, so the relatively small fraction of red GCs may be due to the wide spatial coverage of our study. Moreover, Sikkema et al. (2006), using HST imaging, showed that the fraction of red GCs is small even in the central region of NGC 474, so the lack of red GCs in NGC 474 seems to be a genuine property of the system.
Gas-rich mergers usually increase the number of metal-rich GCs, but if the merger occurred a few gigayears ago, GCs formed in merging will still have intermediate color and not yet be very red. These intermediate-color GCs will become typical red GCs after several gigayears. If we assume that these intermediate-color GCs are 7–8 Gyr old with (g¢ - ¢ ~i)0 0.85, then the colors of these GCs will be (g¢ - ¢ ~i)0 0.94 when they are 13 Gyr old with Z ~0.003 based on a theoretical simple stellar population model (Maraston 2005; Bressan et al.2012). This red color is consistent with the peak color of red GC populations. When these intermediate-color GCs are 13 Gyr old, the fraction of red GCs will be about 40%, consistent with the results in Peng et al. (2006).
Figure 6. Color distributions of GC candidates in different subregions. Panels (a), (b), (c), and (d) show the GCs within 1′.7,1. 7¢ <R<2.5Re,GCS, the fine
structures, and the eastern bright substructure, respectively. The solid histograms (red) are the background-subtracted color distributions. The dashed histograms (black) subtract the double Gaussian function fit to the color distribution of all GCs within 2.5 Re,GCfrom the color histograms of GCs in the subregions.
In this study, we have caught both traditional GC subpopulations in mid-evolution. A population of likely intermediate-age GCs are metal-rich GCs, which will passively redden to have colors similar to those seen in older galaxies. The metal-poor population is seen to be physically associated with cold streams and fine structures in the halo of NGC474. Future studies using MATLAS survey data will allow us to probe this association across a wide range of galaxy mass and environments. The properties of GCs associated with visible substructures will be useful for determining the origin of streams and shells in massive galaxies.
We thank the anonymous referee for helpful comments that improved the original manuscript. S.L. and E.W.P. acknowl-edge support from the National Natural Science Foundation of China through Grant No. 11573002 and from the Strategic Priority Research Program, “The Emergence of Cosmological Structures,” of the Chinese Academy of Sciences, Grant No. XDB09000105. This work is based on observations obtained with MegaPrime/MegaCam, a joint project of CFHT and CEA/IRFU, at the Canada–France–Hawaii Telescope (CFHT), which is operated by the National Research Council (NRC) of Canada, Institut National des Science de l’Univers of Centre National de la Recherche Scientifique (CNRS) of France, and the University of Hawaii. This work is based in part on data products from Terapix available at the Canadian Astronomy Data Centre as part of the CFHT Legacy Survey, a collaborative project of the NRC and CNRS.
Facility:CFHT.
References
Bertin, E., & Arnouts, S. 1996,A&AS,117, 393
Blom, C., Forbes, D. A., Brodie, J. P., et al. 2012,MNRAS,426, 1959
Bournaud, F., Duc, P.-A., & Emsellem, E. 2008,MNRAS,389, L8
Bressan, A., Marigo, P., Girardi, L., et al. 2012,MNRAS,427, 127
Cappellari, M., Emsellem, E., Krajnović, D., et al. 2011,MNRAS,413, 813
Côté, P., Marzke, R. O., & West, M. J. 1998,ApJ,501, 554
Duc, P.-A., Cuillandre, J.-C., Karabal, E., et al. 2015,MNRAS,446, 120
Durrell, P. R., Côté, P., Peng, E. W., et al. 2014,ApJ,794, 103
Foster, C., Lux, H., Romanowsky, A. J., et al. 2014,MNRAS,442, 3544
Foster, C., Pastorello, N., Roediger, J., et al. 2016,MNRAS,457, 147
Gwyn, S. D. J. 2008,PASP,120, 212
Hanes, D. A., Côté, P., Bridges, T. J., et al. 2001,ApJ,559, 812
Huxor, A. P., Mackey, A. D., Ferguson, A. M. N., et al. 2014,MNRAS,
442, 2165
Kartha, S. S., Forbes, D. A., Spitler, L. R., et al. 2014,MNRAS,437, 273
Kruijssen, J. M. D. 2015,MNRAS,454, 1658
Kruijssen, J. M. D., Pelupessy, F. I., Lamers, H. J. G. L. M., et al. 2012, MNRAS,421, 1927
Li, B., Peng, E. W., Zhang, H.-X., et al. 2015,ApJ,806, 133
Li, H., & Gnedin, O. Y. 2014,ApJ,796, 10
Liu, C., Peng, E. W., Côté, P., et al. 2015,ApJ,812, 34
Liu, Y., Peng, E. W., Blakeslee, J., et al. 2016,ApJ,818, 179
Maraston, C. 2005,MNRAS,362, 799
McDermid, R. M., Alatalo, K., Blitz, L., et al. 2015,MNRAS,448, 3484
Muratov, A. L., & Gnedin, O. Y. 2010,ApJ,718, 1266
Naab, T., Johansson, P. H., & Ostriker, J. P. 2009,ApJL,699, L178
Oser, L., Ostriker, J. P., Naab, T., Johansson, P. H., & Burkert, A. 2010,ApJ,
725, 2312
Park, H. S., & Lee, M. G. 2013,ApJL,773, L27
Peng, E. W., Jordán, A., Côté, P., et al. 2006,ApJ,639, 95
Peng, E. W., Jordán, A., Côté, P., et al. 2008,ApJ,681, 197
Pota, V., Forbes, D. A., Romanowsky, A. J., et al. 2013,MNRAS,428, 389
Renaud, F., Bournaud, F., & Duc, P.-A. 2015,MNRAS,446, 2038
Renaud, F., & Gieles, M. 2013,MNRAS,431, L83
Schlegel, D. J., Finkbeiner, D. P., & Davis, M. 1998,ApJ,500, 525
Shapiro, K. L., Genzel, R., & Förster Schreiber, N. M. 2010, MNRAS,
403, L36
Sikkema, G., Carter, D., Peletier, R. F., et al. 2007,A&A,467, 1011
Sikkema, G., Peletier, R. F., Carter, D., Valentijn, E. A., & Balcells, M. 2006, A&A,458, 53
Strader, J., Romanowsky, A. J., Brodie, J. P., et al. 2011,ApJS,197, 33
Tonini, C. 2013,ApJ,762, 39
Trancho, G., Miller, B. W., Schweizer, F., Burdett, D. P., & Palamara, D. 2014, ApJ,790, 122
Turnbull, A. J., Bridges, T. J., & Carter, D. 1999,MNRAS,307, 967
Wang, Q., Peng, E. W., Blakeslee, J. P., et al. 2013,ApJ,769, 145
Whitmore, B. C., Schweizer, F., Leitherer, C., Borne, K., & Robert, C. 1993, AJ,106, 1354
Zhang, H.-X., Peng, E. W., Côté, P., et al. 2015,ApJ,802, 30