HAL Id: hal-00328214
https://hal.archives-ouvertes.fr/hal-00328214
Submitted on 16 Jul 2007HAL is a multi-disciplinary open access
archive for the deposit and dissemination of sci-entific research documents, whether they are pub-lished or not. The documents may come from teaching and research institutions in France or abroad, or from public or private research centers.
L’archive ouverte pluridisciplinaire HAL, est destinée au dépôt et à la diffusion de documents scientifiques de niveau recherche, publiés ou non, émanant des établissements d’enseignement et de recherche français ou étrangers, des laboratoires publics ou privés.
Intercomparison of ground-based ozone and NO2
measurements during the MANTRA 2004 campaign
A. Fraser, P. F. Bernath, R. D. Blatherwick, J. R. Drummond, P. F. Fogal, D.
Fu, Florence Goutail, T. E. Kerzenmacher, C. T. Mcelroy, C. Midwinter, et al.
To cite this version:
A. Fraser, P. F. Bernath, R. D. Blatherwick, J. R. Drummond, P. F. Fogal, et al.. Intercomparison of ground-based ozone and NO2 measurements during the MANTRA 2004 campaign. Atmospheric Chemistry and Physics Discussions, European Geosciences Union, 2007, 7 (4), pp.10205-10234. �hal-00328214�
ACPD
7, 10205–10234, 2007 Ground-based ozone and NO2 during MANTRA 2004 A. Fraser et al. Title Page Abstract Introduction Conclusions References Tables Figures ◭ ◮ ◭ ◮ Back CloseFull Screen / Esc
Printer-friendly Version
Interactive Discussion
EGU
Atmos. Chem. Phys. Discuss., 7, 10205–10234, 2007 www.atmos-chem-phys-discuss.net/7/10205/2007/ © Author(s) 2007. This work is licensed
under a Creative Commons License.
Atmospheric Chemistry and Physics Discussions
Intercomparison of ground-based ozone
and NO
2
measurements during the
MANTRA 2004 campaign
A. Fraser1, P. F. Bernath2,3, R. D. Blatherwick4, J. R. Drummond1,5, P. F. Fogal1,4, D. Fu2, F. Goutail6, T. E. Kerzenmacher1, C. T. McElroy7, C. Midwinter1,
J. R. Olson4, K. Strong1, K. A. Walker1,2, D. Wunch1,8, and I. J. Young2 1
Department of Physics, University of Toronto, Toronto, Canada
2
Department of Chemistry, University of Waterloo, Waterloo, Canada
3
Department of Chemistry, University of York, Heslington, UK
4
Department of Physics and Astronomy, University of Denver, Denver, USA
5
Department of Physics and Atmospheric Science, Dalhousie University, Halifax, Canada
6
Service d’A ´eronomie du Centre Nationale de la Recherche Scientifique, Verri `eres le Buisson, France
7
Environment Canada, Downsview, Canada
8
California Institute of Technology, Pasadena, USA
Received: 2 July 2007 – Accepted: 13 July 2007 – Published: 16 July 2007 Correspondence to: A. Fraser ([email protected])
ACPD
7, 10205–10234, 2007 Ground-based ozone and NO2 during MANTRA 2004 A. Fraser et al. Title Page Abstract Introduction Conclusions References Tables Figures ◭ ◮ ◭ ◮ Back CloseFull Screen / Esc
Printer-friendly Version
Interactive Discussion
EGU Abstract
The MANTRA (Middle Atmosphere Nitrogen TRend Assessment) 2004 campaign took place in Vanscoy, Saskatchewan, Canada (52◦N, 107◦W) from 3 August to 15 Septem-ber, 2004. In support of the main balloon launch, a suite of five zenith-sky and direct-Sun-viewing UV-visible ground-based spectrometers was deployed, primarily
measur-5
ing ozone and NO2total columns. Three Fourier transform spectrometers (FTSs) that
were part of the balloon payload also performed ground-based measurements of sev-eral species, including ozone. Ground-based measurements of ozone and NO2
differ-ential slant column densities from the zenith-viewing UV-visible instruments are pre-sented herein. They are found to partially agree within NDACC (Network for the
Detec-10
tion of Atmospheric Composition Change) standards for instruments certified for pro-cess studies and satellite validation. Vertical column densities of ozone from the zenith-sky UV-visible instruments, the FTSs, a Brewer spectrophotometer, and ozonesondes are compared, and found to agree within the combined error estimates of the instru-ments (15%). NO2vertical column densities from two of the UV-visible instruments are
15
compared, and are also found to agree within combined error (15%).
1 Introduction
MANTRA was a series of balloon campaigns conducted in Vanscoy, Saskatchewan (52◦N, 107◦W) to measure stratospheric trace gases that impact mid-latitude strato-spheric ozone chemistry (Strong et al., 2005). Balloons were flown in late summer
20
during the reversal of the stratospheric flow. This is the period when the atmosphere is closest to photochemical equilibrium and dynamics do not have a large influence
(Wunch et al.,2005, and references therein). MANTRA field campaigns were held
bi-ennially from 1998 to 2004. In 2004, a suite of five UV-visible ground-based instruments operated through the duration of the campaign, measuring the day-to-day variability of
25
ACPD
7, 10205–10234, 2007 Ground-based ozone and NO2 during MANTRA 2004 A. Fraser et al. Title Page Abstract Introduction Conclusions References Tables Figures ◭ ◮ ◭ ◮ Back CloseFull Screen / Esc
Printer-friendly Version
Interactive Discussion
EGU
were part of the main balloon payload and, in preparation for the launch, made spo-radic ground-based measurements. Ozonesondes were also launched, on average, every other day. The campaign took place between 3 August and 15 September, with 40 days of measurements.
Ozone and NO2differential slant column densities and vertical column densities were
5
determined for the duration of the campaign from the four zenith-viewing UV-visible instruments and are discussed and compared. The ozone vertical column densities are also compared to measurements from a Brewer spectrophotometer, the three FTS instruments, and integrated ozone profiles from the ozonesonde flights.
The UV-visible instruments are compared following the protocols established by the
10
UV-visible Working Group of the Network for the Detection of Atmospheric Composi-tion Change (NDACC) (Kurylo and Zander,2000). In order to maintain the uniformity of measurements made throughout the NDACC, intercomparison campaigns between UV-visible instruments are periodically held. Three such campaigns have been held to date: in 1992 at Lauder, New Zealand (Hofmann et al.,1995), in 1996 at the
Obser-15
vatoire de Haute Provence, France (Roscoe et al.,1999), and in 2003 at the Andøya Rocket Range in Andenes, Norway (Vandaele et al., 2005). Vandaele et al. (2005)
andRoscoe et al.(1999) present two methods of statistically comparing data from two
zenith-viewing instruments, which have been adopted by the UV-visible NDACC Work-ing Group for the validation of new instruments (Johnston et al.,1999). Although the
20
MANTRA campaign was not an NDACC intercomparison campaign, it did meet the requirements of an instrument intercomparison: the measurement site was reasonably free from tropospheric pollution (Vanscoy is upwind from Saskatoon, which is 60 km to the north-west), measurements were made for at least ten days, measurements were taken over the the course of the entire day, and the measurements were coincident in
25
ACPD
7, 10205–10234, 2007 Ground-based ozone and NO2 during MANTRA 2004 A. Fraser et al. Title Page Abstract Introduction Conclusions References Tables Figures ◭ ◮ ◭ ◮ Back CloseFull Screen / Esc
Printer-friendly Version
Interactive Discussion
EGU
2 The instruments
The University of Toronto’s Ground-Based Spectrometer (UT-GBS) was assembled in 1998 and has since participated in all four MANTRA campaigns (Bassford et al.,
2001, 2005; Farahani, 2006). It is a triple-grating spectrometer with a cooled,
two-dimensional array CCD (charged-coupled device) detector. Before the 2004 campaign,
5
the CCD detector began malfunctioning and a replacement was loaned by the manu-facturer, JY Horiba. The loaned CCD was a liquid-nitrogen-cooled 1024×128 pixel front-illuminated CCD. Due to the front-illumination, the CCD was not as senstive to the UV-visible (quantum efficiency of ∽10% at 450 nm) as the original CCD (quantum effciency of ∽60% at 450 nm). Sunlight is gathered from the zenith-sky by a fused silica
10
lens with a two-degree field-of-view and focused onto a liquid light guide, minimizing the effects of polarization. During MANTRA 2004, spectra were recorded between 345 and 555 nm, with a resolution of approximately 0.5 nm in the NO2region (425–450 nm) and 1.0 nm in the ozone region (450–550 nm). Spectra were recorded continuously throughout the day, with varying exposure times to maximize the signal on the CCD.
15
Due to the lower sensitivity of the loaned detector, longer exposure times were required to maximize the signal, leading to fewer measurements over twilight. Due to an error in the data acquisition software, since corrected, a low signal-to-noise ratio was obtained during the campaign. Despite these issues, good data was obtained from 7 August (day number 220) to 15 September (day number 259).
20
The Syst `eme d’Analyse par Observations Z ´enithales (SAOZ) instrument was devel-oped in the late 1980’s, and is now deployed in a global network for measurements of stratospheric concentrations of trace gases important to ozone loss (Pommereau
and Goutail,1988). SAOZ is a grating spectrometer with an uncooled 1024-pixel lin-ear diode array. SAOZ records zenith-sky spectra with a 10◦field-of-view between 270
25
and 620 nm, with a resolution of 1.0 nm. Throughout the day, spectra are recorded every thirty minutes, and are continuously obtained when the solar zenith angle (SZA) is between 80◦and 95◦. SAOZ instruments have participated in all three of the
UV-ACPD
7, 10205–10234, 2007 Ground-based ozone and NO2 during MANTRA 2004 A. Fraser et al. Title Page Abstract Introduction Conclusions References Tables Figures ◭ ◮ ◭ ◮ Back CloseFull Screen / Esc
Printer-friendly Version
Interactive Discussion
EGU
visible NDACC intercomparison campaigns. During MANTRA 2004, SAOZ measured between 6 August and 15 September (days 219–259).
MAESTRO-G (Measurements of Aerosol Extinction in the Stratosphere and TRopo-sphere by Occultation-Ground) (McElroy et al.,2007) is the ground-based clone of the grating spectrometer on board the Atmospheric Chemistry Experiment (ACE) satellite
5
launched in August 2003 (Bernath et al.,2005). MAESTRO-G (hereafter MAESTRO) is a double spectrometer, with two independent input optics, gratings, and detectors. The UV spectrometer has a spectral range from 260 to 560 nm and a resolution of 1.0 nm. The visible spectrometer has a spectral range from 525 to 1010 nm and a resolution of 2 nm. Both detectors are uncooled 1024-pixel linear diode arrays. The field-of-view is
10
0.1◦by 6.5◦. Only data from the UV spectrometer are used in this work. Because
MAE-STRO was primarily a balloon instrument, only eight days of ground-based zenith-sky data were obtained, from 16 to 23 August (days 229–236).
The SunPhotoSpectrometer (SPS) is the heritage instrument to MAESTRO. It is a photodiode array grating spectrometer that has been flown aboard the NASA ER-2
15
aircraft as the Composition and Photodissociative Flux Measurement (CPFM) experi-ment (McElroy,1995). Zenith-sky spectra are recorded between 375 and 775 nm, with a resolution of 1.5 nm in both the NO2and ozone regions. The detector is a 1024-pixel
uncooled linear photodiode array. Sunlight is collected by an achromatic lens, providing a 0.1◦by 10◦field-of-view. The SPS participated in the first two UV-visible NDACC
in-20
tercomparison campaigns. The SPS measured between 16 August and 14 September (days 229–258).
The Brewer spectrophotometer (hereafter Brewer) was designed in the early 1980’s to provide automated measurements of ozone and SO2 (Savastiouk and McElroy,
2005). Brewers operate at twelve stations in Canada, as part of the Canadian
Strato-25
spheric Ozone and UV Monitoring Network, and throughout the world. The Brewer records direct Sun UV spectra between 290 and 325 nm at five discreet wavelengths: 306.3 nm, 310.1 nm, 313.5 nm 316.7 nm and 320.0 nm. A photomultiplier tube is used as the detector. Brewer # 007 was used at Vanscoy, and operated between 6 August
ACPD
7, 10205–10234, 2007 Ground-based ozone and NO2 during MANTRA 2004 A. Fraser et al. Title Page Abstract Introduction Conclusions References Tables Figures ◭ ◮ ◭ ◮ Back CloseFull Screen / Esc
Printer-friendly Version
Interactive Discussion
EGU
and 15 September (days 219–259).
The University of Toronto’s Fourier Transform Spectrometer (U of T FTS) is an ABB Bomem DA5 instrument that has a 50-cm maximum optical path difference, and records single-sided interferograms along a linear mirror path. The instrument measures simul-taneously on InSb (Indium antimide) and MCT (Mercury cadmium telluride) detectors.
5
Both detectors are photovoltaic in order to ensure a linear response to signal intensity. The U of T FTS has a spectral range spanning 1200–5000 cm−1(2–8.3 µm) that is con-strained by the detectors, the calcium fluoride (CaF2) beamsplitter and a germanium
solar filter. The instrument was extensively refurbished for the MANTRA 2004 cam-paign: new electronics and software were installed so that it could participate in both
10
the balloon flight and the ground-based campaign. The refurbishment is described in
Wunch et al.(2006). Only data from the MCT detector is discussed here, due to poor
alignment of the InSb detector for the ground-based measurements. Ground-based data was recorded on six days: 10–12, 19, and 27 August and 7 September (days 223–225, 232, 240, and 251).
15
The Portable Atmospheric Research Interferometric Spectrometer for the Infrared (PARIS-IR) is a compact, portable Fourier transform spectrometer built by ABB Bomem for performing atmospheric remote sensing measurements from balloon-borne plat-forms and the ground (Fu et al.,2007). It records double-sided interferograms and has the same spectral resolution (0.02 cm−1) and spectral coverage (750–4400 cm−1) as
20
the satellite-borne Atmospheric Chemistry Experiment Fourier Transform Spectrome-ter (ACE-FTS) (Bernath et al.,2005). This is due to their similar design, and the use of components such as the beamsplitter that were flight spares for the satellite instrument. PARIS-IR recorded ground-based data on 13 August (day number 226).
The University of Denver Fourier Transform Spectrometer (DU FTS) is an early ABB
25
Bomem model with an extensive flight history. For the 2004 MANTRA flight, it was configured with a pair of MCT detectors. It has a maximum optical path difference of 50 cm and at flight time was operating at a resolution of approximately 0.03 cm−1. The spectrometer control and acquisition electronics have been updated several times, and
ACPD
7, 10205–10234, 2007 Ground-based ozone and NO2 during MANTRA 2004 A. Fraser et al. Title Page Abstract Introduction Conclusions References Tables Figures ◭ ◮ ◭ ◮ Back CloseFull Screen / Esc
Printer-friendly Version
Interactive Discussion
EGU
this configuration used a pair of digital filtering processors, providing two bandpasses of approximately 718–1438 and 1438–2154 cm−1. The data acquisition control
hard-ware and softhard-ware were upgraded for the 2004 campaign. More details of the flight configuration can be found in Fogal et al. (2005). The major difference between the 1998 flight configuration described therein and this campaign is in the improved
detec-5
tors and control and acquistion electronics. Ground-based data was obtained on 25 August and 13 September (days 238 and 257). All three FTSs measure direct sunlight through the use of three independent solar trackers.
3 Data analysis
3.1 UV-visible instruments
10
In this work, the DOAS (Differential Optical Absorption Spectroscopy) technique (e.g.
Solomon et al.,1987;Platt,1994) is used for the analysis of spectra from the UT-GBS,
SAOZ, MAESTRO, and SPS with absorption cross-sections of ozone (Burrows et al.,
1999), NO2 (Vandaele et al.,1998), H2O (Rothman et al.,2003), and O4 (Greenblatt
et al.,1990) fit using a simultaneous Marquart-Levenberg technique. Differential slant
15
column densities (DSCDs) of ozone are retrieved between 450 and 550 nm, while NO2 DSCDs are retrieved between 425 and 450 nm. WinDOAS, a programme developed at the IASB-BIRA (Belgian Institute for Space Aeronomy, Fayt and Van Roozendael,
2001), was used to analyse data for the zenith-viewing instruments. A single spectrum for each instrument from day number 247 (SZA=44.8◦, 3 September) was used as the
20
reference spectrum. As a result, any differences seen in the differential slant columns should be a result of the original spectra, and not an artifact of the analysis method. Since MAESTRO was not operating on day 247, and because there were no clear sky days during the period when it was operating, a reference spectrum from day number 233 (SZA=44.7◦, 20 August) was used for the MAESTRO analysis. The DSCDs of
25
ACPD
7, 10205–10234, 2007 Ground-based ozone and NO2 during MANTRA 2004 A. Fraser et al. Title Page Abstract Introduction Conclusions References Tables Figures ◭ ◮ ◭ ◮ Back CloseFull Screen / Esc
Printer-friendly Version
Interactive Discussion
EGU
(Dobson Unit) of the DSCD measured by MAESTRO. It is expected that the impact of using a reference spectrum from this day is negligible. The NO2 DSCDs calculated
using WinDOAS for MAESTRO and SPS are unreliable, with the fitting error being the same order of magnitude as the fitted differential slant columns. As a result, no NO2
DSCDs from these instruments are presented here.
5
The primary quantity derived from the zenith-sky measurements is the DSCD as a function of solar zenith angle (SZA). In order to convert the measurements of DSCD into vertical column density (VCD), the use of an air mass factor (AMF) is required. In this work, AMFs are calculated using a radiative transfer model initialized with temper-ature, pressure, and ozone profiles taken from the average of all ozonesondes flown
10
during the campaign and an NO2 profile taken from a chemical box model at 55◦N in
August (McLinden et al.,2002). DSCDs are related to the VCD and the AMF by Eq. (1):
DSCD(SZA)=VCD(SZA) × AMF(SZA)−RCD. (1)
RCD is the reference column density, and is the amount of absorber in the reference spectrum used in the DOAS analysis. To convert DSCDs to VCDs, a Langley Plot of
15
DSCD between 86◦and 91◦versus AMF is made. From Eq. (1), the RCD can be found by taking the ordinate of the Langley Plot. The RCDs from each day are then averaged to give one RCD for the campaign. Each individual DSCD is then converted to a VCD using Eq. (1). The average VCD for one twilight period is found by averaging the VCDs between 86◦and 91◦(Sarkissian et al.,1997). This method is used for both ozone and
20
NO2. For ozone, the mean RCDs and standard deviations found are 307±178 DU for
the UT-GBS, 246±173 DU for SAOZ, 486±182 DU for MAESTRO, and 459±190 DU for SPS. For NO2, the mean RCDs and standard deviations are (1.07±0.68)×1016 molec/cm2for the UT-GBS and (0.77±0.52)×1016 molec/cm2 for SAOZ. Although the absolute values of the RCDs do not agree, the standard deviations are similar, showing
25
the instruments measure similar variability in the RCD throughout the campaign. Measurement errors for DSCD and VCD measurements are calculated from the root-sum-square of individual sources of error, afterBassford et al.(2005) and references
ACPD
7, 10205–10234, 2007 Ground-based ozone and NO2 during MANTRA 2004 A. Fraser et al. Title Page Abstract Introduction Conclusions References Tables Figures ◭ ◮ ◭ ◮ Back CloseFull Screen / Esc
Printer-friendly Version
Interactive Discussion
EGU
therein. They include random noise on the spectra, instrument error arising from uncer-tainties in the dark current, bias, and slit function, pseudo-random errors resulting from unaccounted-for structure in the spectra, errors in the absorption cross-sections, the temperature dependence of the NO2cross section, and the effects of multiple Raman
scattering, which fills in the absorption lines. For the UT-GBS, the DSCD error is 4.6%
5
for ozone and 11.9% for NO2. For SAOZ the DSCD error is 3.5% for ozone and 11.8%
for NO2. For MAESTRO and SPS ozone the DSCD error is 4.5%. VCD errors combine
the DSCD errors, the AMF error, and the uncertainty in the RCD. For the UT-GBS the VCD error is 5% for ozone and 15% for NO2. For SAOZ the VCD error is 4% for ozone
and 15% for NO2. For MAESTRO and SPS ozone the VCD error is 5%.
10
Total columns of ozone and SO2 for the Brewer spectrophotometer are retrieved using an algorithm based on Beer’s Law. Errors are calculated based on the standard deviation of the column measurements made over the course of a day and are generally less than 1% (Savastiouk and McElroy,2005).
3.2 Fourier transform spectrometers
15
Retrievals for the U of T FTS and PARIS-IR were performed using SFIT2 (v.3.82beta3 for U of T FTS, v.3.81 for PARIS-IR) (Rinsland et al.,1998;Pougatchev et al.,1995), which employs the optimal estimation method (OEM) of Rodgers (2000). SFIT2 re-trieves the primary trace gas volume mixing ratio (VMR) vertical profile represented on an altitude grid. Total column amounts are retrieved by integrating the VMR profiles.
20
Both instruments use the HITRAN 2004 (HIgh-resolution TRANsmission database) spectral database (Rothman et al.,2005a). For the U of T FTS, ozone was retrieved from the 3040 cm−1 microwindow (3039.90–3040.60 cm−1) with H2O and CH4 fit as
interfering species. Individual total columns are retrieved from spectra co-added over 20-minute time intervals. Daily averages are then computed from these individual total
25
column amounts, and the error bars (7%) represent the maximum standard deviation of the individual total columns (Wunch et al.,2006). For PARIS-IR, ozone is retrieved from the 990 cm−1microwindow (987.15–990.0 cm−1), with the isotopologues of ozone,
ACPD
7, 10205–10234, 2007 Ground-based ozone and NO2 during MANTRA 2004 A. Fraser et al. Title Page Abstract Introduction Conclusions References Tables Figures ◭ ◮ ◭ ◮ Back CloseFull Screen / Esc
Printer-friendly Version
Interactive Discussion
EGU
CO2, H2O, and solar lines fit as interfering species. The data analysis is described in detail inFu et al. (2007). The uncertainty in the retrieved PARIS-IR results for ozone include contributions from the spectral noise, interfering molecules, uncertainties in the viewing geometry and uncertainties in atmospheric temperature profiles. This value is estimated to be 2.7%. For both instruments, the a priori ozone profile was taken
5
from ozonesondes flown during the campaign. For the U of T FTS, the pressure and temperature profiles are taken from the National Centers for Environmental Prediction weather model (NCEP) (McPherson,1994) and the U.S. Standard Atmosphere. For PARIS-IR, the pressure and temperature profiles are taken from NCEP and the Mass-Spectrometer-Incoherent-Scatter model (MSIS-2000) (Picone et al.,2002).
10
The columns from the DU FTS were generated using an optimal estimation retrieval based on the DU RADCO code (RADiation COde) which is used as the spectral forward model, and from which the ray-tracing algothrithm is adapted (Blatherwick et al.,1989;
Fogal, 1994). The model atmosphere (pressure, temperature, and ozone) was
con-structed based on radiosonde data from sonde flights flown as part of the campaign.
15
The HITRAN 2004 spectral database was used. The spectra analyzed for ozone are all from the longer wavelength channel (987.45–987.55 cm−1), as the other channel
(1438–2154 cm−1) is dominated by water vapour at ground level. H2O and CO2 are
fit as interfering species. Given the relatively low resolution of the spectrometer, little profile information is retrieved. Nonetheless, very good column determinations can be
20
made. Uncertainty in the ozone columns is 15%, resulting primarily from the variance in the ozonesonde flights used in constructing the a priori VMR profile.
4 Differential slant column densities
4.1 DSCD comparison technique
Because the UT-GBS, SAOZ, MAESTRO, and SPS are all zenith-viewing instruments,
25
ACPD
7, 10205–10234, 2007 Ground-based ozone and NO2 during MANTRA 2004 A. Fraser et al. Title Page Abstract Introduction Conclusions References Tables Figures ◭ ◮ ◭ ◮ Back CloseFull Screen / Esc
Printer-friendly Version
Interactive Discussion
EGU
the DSCDs can be compared as described inJohnston et al. (1999). Two types of certification are defined by NDACC. Instruments that meet Type 1 standards are certi-fied for global studies and trend measurements. In this comparison, the DSCDs from two instruments for a single twilight are transformed onto a common SZA grid ranging from 75◦to 91◦, and then a linear regression analysis is performed. In this work, the
5
regression is performed using a least-squares estimation method, and errors in the fit parameters are calculated (York et al.,2004). The slope of the regression fit repre-sents how well the two data sets agree: a non-unity slope indicates the DSCDs do not vary with SZA in the same way. A non-zero ordinate represents a systematic offset between the two data sets. Residuals are also calculated. Residuals that increase
10
or decrease with SZA are a sign of diverging DSCDs between the two datasets. For ozone, the slope of the line should be 1.00±0.03, the intercept should be ±55.8 DU, and the root-mean-square (RMS) of the residuals should be less than 37.2 DU. For NO2, the slope of the line should be 1.00±0.05, the intercept should be ±0.15×10¹⁶ molec/cm2, and the RMS of the residuals should be less than 0.10×10¹⁶ molec/cm2.
15
All of these standards are for the campaign averaged values.
Instruments that meet Type 2 standards are certified for process studies and satellite validation. In this comparison, the VCDs over the course of a twilight are transformed onto a common SZA grid ranging from 85◦to 91◦and the ratio of the data from the two instruments is taken. For ozone, the campaign mean of the daily ratios should be in
20
the range from 0.95 to 1.05, with a standard deviation of the mean less than 0.03. For NO2, the campaign mean of the daily ratios should be between 0.90 and 1.10, with
a standard deviation of the ratio less than 0.05. Since NO2 concentrations increase throughout the day, the offset value between the morning and afternoon VCDs can be calculated by finding the y-intercept of a plot of the afternoon DSCDs against the
25
morning DSCDs. The standard deviation in this offset should be less than 0.25×10¹⁶ molec/cm2.
ACPD
7, 10205–10234, 2007 Ground-based ozone and NO2 during MANTRA 2004 A. Fraser et al. Title Page Abstract Introduction Conclusions References Tables Figures ◭ ◮ ◭ ◮ Back CloseFull Screen / Esc
Printer-friendly Version
Interactive Discussion
EGU
4.2 DSCD Type 1 comparisons
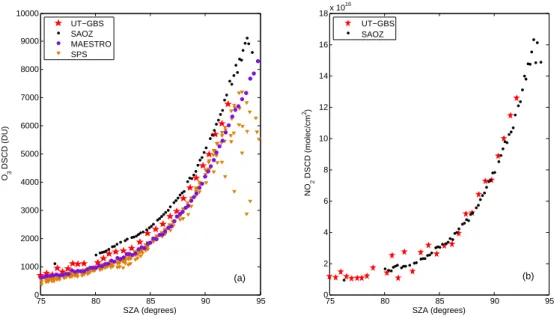
Figure 1 shows the ozone and NO2 DSCDs from the afternoon of 20 August (day
233) for the UT-GBS, SAOZ, MAESTRO, and SPS instruments. This was a relatively clear day, with all four instruments measuring. MAESTRO spectra are averaged over 0.25◦SZA intervals. The SPS and MAESTRO ozone agree, despite the scatter in the
5
SPS DSCDs. UT-GBS ozone DSCDs are approximately 250 DU higher than the SPS and MAESTRO, however this is a constant offset. The SAOZ ozone DSCDs are a further 200–300 DU higher than the UT-GBS DSCDs, the difference being smaller at lower SZAs and increasing with SZA. The low signal-to-noise ratio of the UT-GBS in-strument causes some scatter in the DSCDs, which is especially visible for NO2. NO2
10
absorption features are weaker and narrower than those of ozone, resulting in NO2
retrievals being more sensitive to the quality of the spectra, as well as to the retrieval parameters used in the DOAS analysis. Despite this scatter, the NO2 DSCDs show
good agreement. In the case of NO2, the UT-GBS DSCDs are scattered about those
from SAOZ. All of these observations are consistent throughout the campaign, with the
15
exception of the SPS and MAESTRO agreement. The two datasets are not always in agreement at small SZAs.
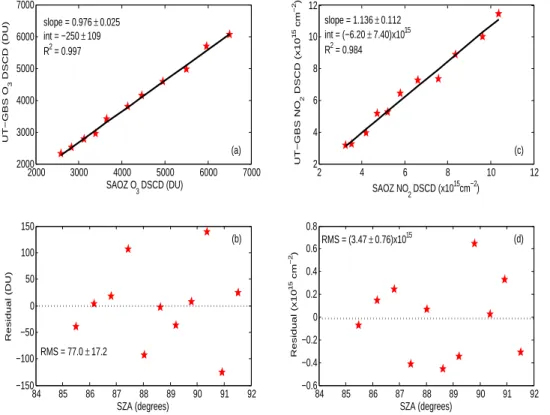
Figure 2shows an example of the regression analysis for ozone and NO2for
mea-surements taken at sunset on 20 August between the UT-GBS and SAOZ. Only SZAs between 85◦and 91◦are considered, due to the large errors for small SZAs in the
UT-20
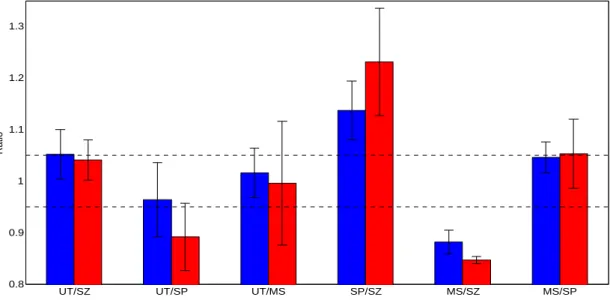
GBS data. SAOZ data has been interpolated onto the UT-GBS SZA grid because of the smaller number of UT-GBS data points. The top panels show the regression fit of the two datasets, while the bottom panels show the calculated residual versus SZA. The results of the fits are also shown. Figure3shows the average results of the analysis for ozone for the entire campaign for all pairs of instruments. Error bars are the standard
25
deviations of the parameter throughout the campaign. The required accuracies to be considered a certified NDACC instrument for global trend studies (Type 1) are shown as dashed horizontal lines in Fig.3. Only one regression analysis is shown for each
ACPD
7, 10205–10234, 2007 Ground-based ozone and NO2 during MANTRA 2004 A. Fraser et al. Title Page Abstract Introduction Conclusions References Tables Figures ◭ ◮ ◭ ◮ Back CloseFull Screen / Esc
Printer-friendly Version
Interactive Discussion
EGU
pair of instruments (i.e. only UT-GBS vs. SAOZ and not SAOZ vs. UT-GBS); the results from the other analyses have been calculated, and are in agreement with the analysis shown.
All of the slopes in Fig.3 agree with the Type 1 NDACC standards within the stan-dard deviations. The average values mostly meet the stanstan-dards, with the afternoon
5
comparisons against the UT-GBS slightly outside the desired range, and the morning UT-GBS vs. MAESTRO and the afternoon MAESTRO vs. SAOZ also just outside the range. For all the comparisons with the UT-GBS, the morning standard deviations on the slopes are larger than the afternoon standard deviations. In general for the UT-GBS, there are more measurements in the afternoon than in the morning, extending
10
to a larger SZA. This is a result of the general campaign trend of cloudier skies during sunrise than during sunset. Since the UT-GBS’s loaned detector was not as sensitive to UV-visible light as would have been ideal, the cloudy, darker skies meant that the first UT-GBS measurement of the day was often not until a SZA of 90◦. The intercepts in
Fig.3are all large, with large standard deviations. This is an indication that the
agree-15
ment at small SZA varies from day to day. The large intercepts are consistent with the differences in the RCDs discussed in Sect.3.1. The residuals are also all large and variable – indicating scatter in the DSCDs from all the instruments. In the case of the UT-GBS, this is partly due to the low signal-to-noise ratio discussed in Sect.2. For the other instruments, this may be a result of the diurnal temperature changes in the
in-20
struments, causing slight shifts in the calibration of the spectra which are unaccounted for in the WinDOAS analysis.
The campaign averages for the NO2 regression parameters for the UT-GBS and SAOZ are shown in Table 1. The errors given are standard deviations. The sunset slope falls within the required standards, while the sunrise slope falls outside the
ac-25
cepted range, although it agrees within error. The intercepts and residuals are approx-imately two to four times the standards. The error in the daily values of the parameters are all large, especially for the sunrise values. This is again due, in part, to fewer mea-surements in the morning than in the afternoon. In addition, due to the lower columns
ACPD
7, 10205–10234, 2007 Ground-based ozone and NO2 during MANTRA 2004 A. Fraser et al. Title Page Abstract Introduction Conclusions References Tables Figures ◭ ◮ ◭ ◮ Back CloseFull Screen / Esc
Printer-friendly Version
Interactive Discussion
EGU
of NO2 present during sunrise, it is to be expected that the sunrise values would be more uncertain than the sunset values.
4.3 DSCD Type 2 comparisons
The results from the Type 2 DSCD ozone comparisons are shown in Fig.4. The dotted horizontal lines indicate the required accuracy set by the NDACC. The error bars for
5
the ratios are the standard deviations. The UT-GBS vs. SPS, SPS vs. SAOZ, and MAESTRO vs. SAOZ ratios do not meet the NDACC standards, and these are the comparisons with the largest intercepts in the Type 1 comparisons shown in Fig. 3. The standard deviations are all larger than the standards, with the exception of the MAESTRO vs. SAOZ afternoon comparison. There are only five points in this
compar-10
ison, and although they are in good agreement, the errors of the individual ratios are all larger than 0.03, the standard deviation required in the NDACC comparison.
The campaign averages for the NO2ratios, the standard deviation of the ratios, and
the average offsets for the UT-GBS vs. SAOZ comparison are given in Table 2. The ratios meet the NDACC standards. The morning standard deviation of the ratios does
15
not meet the standard, while the afternoon standard deviation does. This is likely a result of the scattered UT-GBS DSCDs due to the low signal-to-noise ratio of the instrument. The standard deviation of the NO2 offset (given as the error) for both instruments are well within the NDACC standards. The average value of the offset is similar for both instruments.
20
5 Vertical column densities
5.1 Ozone
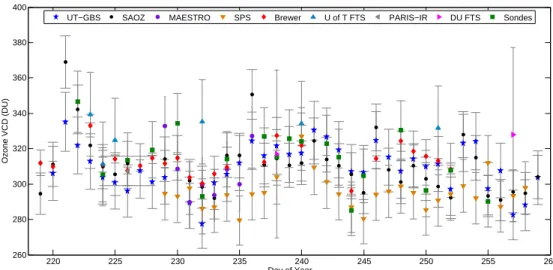
Daily averaged vertical column densities of ozone from all the ground-based instru-ments are shown in Fig.5. Integrated ozonesonde profiles are also shown in this figure.
ACPD
7, 10205–10234, 2007 Ground-based ozone and NO2 during MANTRA 2004 A. Fraser et al. Title Page Abstract Introduction Conclusions References Tables Figures ◭ ◮ ◭ ◮ Back CloseFull Screen / Esc
Printer-friendly Version
Interactive Discussion
EGU
A correction has been added to the ozonesonde column to account for ozone above the burst height of the balloons. Errors on the ozonesonde columns are 5% (Tarasick
et al.,2005). All instruments show a relatively constant ozone column throughout the campaign, varying between 280 and 340 DU.
The ozone VCDs from the zenith-sky UV-visible instruments agree within their error
5
bars, with the exception of day number 221 (8 August). For this day, only the UT-GBS and SAOZ were measuring. Returning to the DSCDs, this is the only day for which both the morning and afternoon ratios are below the NDACC standards. The slope results are close to one, while the intercepts are large and negative. This indicates that although the slope of the DSCDs is in agreement, there exists an offset, resulting
10
in the disagreement seen on this day. Both twilight periods of 8 August were foggy, cloudy, and generally variable, however this was not a condition unique to this day. On average for the campaign, the SPS VCDs are 15 DU lower than those of the other instruments. Despite these disagreements, the trends from the instruments are con-sistent. The measurements from the direct-Sun-viewing Brewer agree with the other
15
UV-visible instruments for the duration of the campaign. The measurements from the ozonesondes are scattered about the ground-based instruments, however the values agree within the combined error of the instruments.
The primary role of the FTS instruments during MANTRA 2004 was to participate in the main balloon flight. Ground-based measurements were taken to test the
per-20
formance of the instruments, when there were no flight tests being performed. As a result, the data for all three instruments is sporadic. The single PARIS-IR column of day number 226 agrees very well with the columns measured by the Brewer and the ozonesonde on that day, and is 11 DU (4%) higher than the UT-GBS column. The ozone columns from the U of T FTS agree with the other instruments within error bars
25
except for day number 232. This is most likely due to a detector alignment error. The columns are 4–7% higher than the UV-visible instruments on the six days of measure-ments, or 3–6% if day 232 is omitted. The DU FTS ozone column on day number 238 is in good agreement with the other instruments and the ozonesonde, falling in
ACPD
7, 10205–10234, 2007 Ground-based ozone and NO2 during MANTRA 2004 A. Fraser et al. Title Page Abstract Introduction Conclusions References Tables Figures ◭ ◮ ◭ ◮ Back CloseFull Screen / Esc
Printer-friendly Version
Interactive Discussion
EGU
the middle of the 24 DU measurement range. On day 257, the DU FTS ozone col-umn is approximately 35 DU (12%) higher than the other instruments. Disagreements between UV-visible and FTS instruments could be due to known issues with the cross-sections of ozone in the infrared and the UV-visible (Rothman et al.,2005b), sensitivity to different layers of the atmosphere (Rodgers and Conner, 2003), differences in the
5
time of day the instruments are measuring, and differences in the viewing geometry of the instruments (zenith sky versus direct Sun).
5.2 NO2
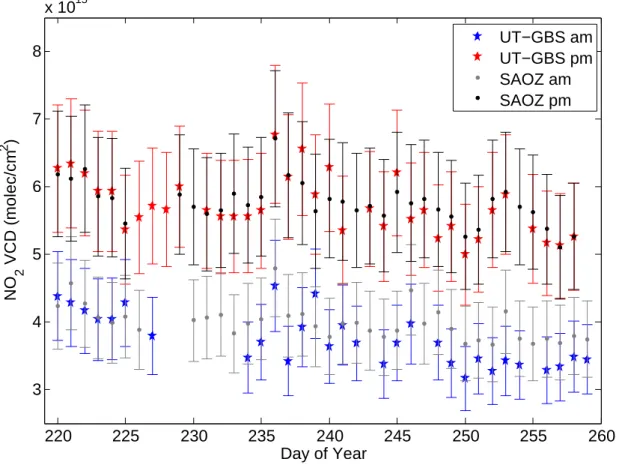
Vertical column densities of NO2from the UT-GBS and SAOZ are shown in Fig.6. Both
instruments show a general decrease in NO2 as the days get shorter and the
avail-10
able sunlight decreases. As expected from the agreement in the DSCDs discussed in Sect.4.3, the instruments agree within their error bars. The morning VCDs agree well for the first week of the campaign, after which the UT-GBS columns are approximately 10% lower than the SAOZ columns. The afternoon VCDs for the two instruments are in good agreement for the entire campaign. The trend in both the morning and afternoon
15
NO2VCDs is the same for both instruments.
The campaign average of the ratio of the morning to the afternoon NO2 VCDs for the UT-GBS is 0.66 with a standard deviation of 0.06. For SAOZ the average ratio is 0.63 with a standard deviation of 0.04. This is slightly lower than the 0.72 with a stan-dard deviation of 0.06 calculated for the UT-GBS during the MANTRA 1998 campaign
20
(Bassford et al., 2005). These values are in agreement with the 0.6 and 0.7 values
measured during the summer in Japan at similar latitudes to Vanscoy (43.4◦and 44.4◦) byKoike et al.(1999).
ACPD
7, 10205–10234, 2007 Ground-based ozone and NO2 during MANTRA 2004 A. Fraser et al. Title Page Abstract Introduction Conclusions References Tables Figures ◭ ◮ ◭ ◮ Back CloseFull Screen / Esc
Printer-friendly Version
Interactive Discussion
EGU
6 Conclusions
The ozone DSCD comparisons from the four UV-visible zenith-sky viewing instruments partially meet the NDACC standards for instruments certified for trend studies (Type 1). The slopes all agree with the standards within one standard deviation. Although some of the instrument comparisons yield intercepts and residuals that meet the standards
5
within one standard deviation, all of the intercepts and residuals are larger than the requirements. The intercepts indicate variability in the agreement at small SZA, and an offset in the DSCDs. The large residuals indicate increased scatter on the DSCDs; in the case of the UT-GBS, this scatter is caused by the low signal-to-noise ratio of the instrument during this campaign.
10
The ozone DSCD comparisons also partially meet the standards for instruments certified for process studies and satellite validation (Type 2). Some of the comparisons yield ratios that meet the standards. Those comparisons where the ratios do not fall into the range required by NDACC are the same instruments that have large intercepts in the Type 1 analysis. The standard deviations for all the comparisons fall outside of
15
the required range, with the exception of those comparisons that have only a handful of days to compare. As with the large residuals in the Type 1 comparisons, this indicates scatter in the DSCDs.
The NO2 DSCD comparison between the UT-GBS and SAOZ partially meets the NDACC standards for an instrument certified for trend studies (Type 1). The required
20
slope values are met for the afternoon data, while the morning slope, the intercepts and the residuals are larger than required. This is a result of fewer measurements in the morning, and the low signal-to-noise of the UT-GBS for the MANTRA 2004 campaign. The NO2 DSCDs also partially meet the NDACC standards for an instrument certified
for process studies and satellite validation (Type 2). The ratios of the DSCDs from the
25
two instruments meet the standards, while the standard deviations are larger than re-quired. This is also due to the low signal-to-noise of the UT-GBS during the campaign. The NO2 offsets between the morning and afternoon DSCDs are consistent with the
ACPD
7, 10205–10234, 2007 Ground-based ozone and NO2 during MANTRA 2004 A. Fraser et al. Title Page Abstract Introduction Conclusions References Tables Figures ◭ ◮ ◭ ◮ Back CloseFull Screen / Esc
Printer-friendly Version
Interactive Discussion
EGU
requirements of the NDACC.
Vertical column densities of ozone measured by the zenith-sky UV-visible instru-ments, Brewer spectrophotometer, PARIS-IR, the DU FTS, the U of T FTS, and ozoneson-des agree within combined error bars for the duration of the campaign. NO2VCDs from the UT-GBS and SAOZ are also in agreement during the campaign. All instruments
ob-5
served a relatively constant ozone field, and slightly decreasing NO2columns over the
course of the campaign.
Since the MANTRA 2004 campaign, a new detector has been acquired for the UT-GBS and the error in the data acquisition code has been repaired. Both of these improvements have increased the signal-to-noise ratio of the measurements. All four
10
zenith-sky viewing instruments and PARIS-IR have taken part in the springtime Cana-dian Arctic ACE Validation Campaigns in Eureka, Nunavut (80◦N, 86◦W) from 2004– 2007. Comparisons of these data sets are underway (Kerzenmacher et al.,2005;Sung
et al.,2007). PARIS-IR and the U of T FTS also took part in an intercomparison study at the Toronto Atmospheric Observatory in August 2005 which is described byWunch
15
et al. (2007).
Acknowledgements. MANTRA 2004 was supported by the Canadian Space Agency, the Me-teorological Service of Canada, and the Natural Sciences and Engineering Research Council of Canada (NSERC). The UT-GBS instrument was funded by NSERC. The loaned CCD was provided by the manufacturer, JY Horiba of Edison, NJ. The participation of the French SAOZ
20
in the campaign was supported by the Centre National d’ ´Etudes Spatiales. WinDOAS was kindly provided by C. Fayt and M. Van Roozendael of the Belgian Institute for Space Aeronomy (IASB-BIRA). Funding for the development of PARIS-IR was provided by the Canadian Foun-dation for Innovation and the Ontario Innovation Trust. The PARIS-IR team thanks Y. Bresler and A. M. Seguin for their work on developing the PARIS-IR flight software. The participation
25
ACPD
7, 10205–10234, 2007 Ground-based ozone and NO2 during MANTRA 2004 A. Fraser et al. Title Page Abstract Introduction Conclusions References Tables Figures ◭ ◮ ◭ ◮ Back CloseFull Screen / Esc
Printer-friendly Version
Interactive Discussion
EGU References
Bassford, M. R., Strong, K., and McLinden, C. A.: Zenith-sky observations of stratospheric gases: The sensitivity of air mass factors to geophysical parameters and the influence of tropospheric clouds, J. Quant. Spectrosc. Radiat. Transfer, 68, 657–677, 2001. 10208
Bassford, M. R. Strong, K., McLinden, C. A., and McElroy, C. T.: Ground-based measurements
5
of ozone and NO2 during MANTRA 1998 using a zenith-sky spectrometer, Atmos.-Ocean, 43, 325–338, 2005.10208,10212,10220
Bernath, P. F., McElroy, C. T., Abrams, M. C., et al: Atmospheric Chemistry Experiment (ACE): mission overview, Geophys. Res. Lett., 32,L15S01, doi:10.1029/2005GL022386, 2005. 10209,10210
10
Blatherwick, R. D., Murcray, F. H., Murcray, F. J., Murcray, A., Goldman, A., Vanasse, G. A., Massie, S. T., and Cicerone, R. J.: Infrared emission measurements of morning N2O5, J. Geophys. Res., 94, 18 337–18 340, 1989. 10214
Burrows, J. P., Richter, A., Dehn, A., Deters, B., Himmelmann, S., Voight, S., and Orphal, J.: At-mospheric remote-sensing reference data from GOME – 2. Temperature dependent
absorp-15
tion cross-sections of O3in the 231–794 nm range, J. Quant. Spectrosc. Radiat. Transfer, 61, 509–517, 1999. 10211
Farahani, E.: Measurements of stratospheric composition to investigate ozone loss in the Arctic and at mid-latitudes, Ph.D. Thesis, University of Toronto, Toronto, 2006. 10208
Fayt, C., and Van Roozendael, M.: WinDOAS 2.1 – Software user manual, Uccle, Belgium,
20
BIRA-IASB, 2001. 10211
Fogal, P. F.: The determination of atmospheric constituent vertical distribution information from ground-based, high-resolution, infra-red spectra, Ph.D. Thesis, University of Denver, Denver, 1994. 10214
Fogal, P. F., Blatherwick, R. D., Murcray, F. J., and Olson, J. R.: Infra-red FTS measurements
25
of CH4, N2O, O3, HNO3, HCl, CFC-11 and CFC-12 from the MANTRA balloon campaign, Atmos.-Ocean, 43, 351–359, 2005. 10211
Fu, D., Walker, K. A., Sung, K., Boone, C. D., Soucy, M.-A., Bernath, P. F.: The Portable Atmospheric Research Interferometric Spectrometer for the Infrared, PARIS-IR, J. Quant. Spectrosc. Radiat. Transfer, 103, 362–70, 2007. 10210,10214
30
Greenblatt, G. F., Orlando, J. J., Burkholder, J. B., and Ravshankara, A. R.: Absorption mea-surements of oxygen between 330 and 1140 nm, J. Geophys. Res., 95, 18 577–18 582, 1990.
ACPD
7, 10205–10234, 2007 Ground-based ozone and NO2 during MANTRA 2004 A. Fraser et al. Title Page Abstract Introduction Conclusions References Tables Figures ◭ ◮ ◭ ◮ Back CloseFull Screen / Esc
Printer-friendly Version
Interactive Discussion
EGU
10211
Hofmann, D. J., Bonasoni, P., De Mazi `ere, M., et al.: Intercomparison of UV/visible spectrome-ters for measurements of stratospheric NO2for the Network for the Detection of Stratospheric Change, J. Geophys. Res., 100, 16 765–16 791, 1995. 10207
Johnston, P. V., Pommereau, J.-P. and Roscoe, H.K.: Appendix II – UV/Vis instruments,www.
5
ndacc.org/, 1999.10207,10215
Kerzenmacher, T. E., Walker, K. A., Strong, K., et al.: Measurements of O3, NO2and temper-ature during the 2004 Canadian Arctic ACE Validation Campaign, Geophys. Res. Lett., 32, L16S07, doi:10.1029/2005GL023032, 2005.10222
Koike, M., Kondo, Y., Matthews, W. A., Johnston, P. V., Nakajima, H., Kawaguchi, A., Nakane,
10
H., Murata, I., Budiyono, A., Kanada, M., and Toriyama, N.: Assessment of the uncertainties in the NO2and O3measurements by visible spectrometers, J. Atmos. Chem., 32, 121–145, 1999. 10220
Kurylo, M. J. and Zander, R. J.: The NDSC – Its status after ten years of operation, in: Pro-ceedings of the Quadrennial Ozone Symposium, edited by: Bojikov, R. D. and Kazuo, S.,
15
Sapporo, Japan, 3–8 July 2000, 137–138, 2000. 10207
McElroy, C. T.: A spectroradiometer for the measurement of direct and scattered solar irradi-ance from on-board the NASA ER-2 high-altitude research aircraft, Geophys. Res. Lett., 22, 1361–1364, 1995. 10209
McElroy, C. T., Nowlan, C. R., Drummond, J. R., et al.: The ACE-MAESTRO instrument on
20
SCISAT: description, performance, and preliminary results, Applied Optics, 46, 4341–4356, 2007. 10209
McLinden, C. A., McConnell, J. C., Griffioen, E., and McElroy, C. T.: A vector radiative-transfer model for the Odin/OSIRIS project, Can. J. Phys., 80, 375–393, 2002. 10212
McPherson, R. D.: The national centers for environmental prediction: operational climate,
25
ocean, and weather prediction for the 21st century, Bull. Am. Meteor. of Soc., 75, 363–373, 1994. 10214
Picone, J. M., Hedin, A. E., Drob, D. P., and Aikin, A. C. NRLMSISE-00 empirical model of the atmosphere: statistical comparison and scientific issues, J. Geophys. Res., 107, 1468–1483, 2002. 10214
30
Platt, U.: Differential optical absorption spectroscopy (DOAS), in Air monitoring by spectro-scopic techniques, edited by Sigrist, M. W., 27–84, John Wiley, Hoboken, NJ, 1994. 10211
spec-ACPD
7, 10205–10234, 2007 Ground-based ozone and NO2 during MANTRA 2004 A. Fraser et al. Title Page Abstract Introduction Conclusions References Tables Figures ◭ ◮ ◭ ◮ Back CloseFull Screen / Esc
Printer-friendly Version
Interactive Discussion
EGU
trometry during Arctic winter and spring 1988, Geophys. Res. Lett., 15, 891–894, 1988.
10208
Pougatchev, N. S., Connor, B. J., and Rinsland, C. P.: Infrared measurements of the ozone vertical distribution above Kitt Peak, J. Geophys. Res., 100, 16 689–16 698, doi:10.1029/95JD01296, 1995. 10213
5
Rinsland, C. P., Jones, N. B., Connor, B. J., Logan, J. A., Pougatchev, N. S., Gold-man, A., Murcray, F. J., Stephen, T. M., Pine, A. S., Zander, R., Mahieu, E., and De-moulin, P.: Northern and southern hemisphere ground-based infrared spectroscopic mea-surements of tropospheric carbon monoxide and ethane, J. Geophys. Res., 103, 197-218, doi:10.1029/98JD02515, 1998. 10213
10
Rodgers, C. D.: Inverse methods for atmospheric sounding: theory and practice, vol. 2 of Series on atmospheric, oceanic and planetary physics, World Scientific Co. Pte. Ltd., 2000.10213
Rodgers, C. D. and Conner, B. J.: Intercomparison of remote sounding instruments, J. Geo-phys. Res., 108, 4116, doi:10.1029/2002JD002299, 2003. 10220
Roscoe, H. K., Johnston, P. V., Van Roozendael, M., et al.: Slant column measurements of O3
15
and NO2during the NDSC intercomparison of zenith-sky UV-Visible spectrometers in June 1996, J. Atmosp. Chem., 32, 281–314, 1999. 10207
Rothman, L. S., Barbe, A., Benner, D. C., et al.: The HITRAN molecular spectroscopic database: edition of 2000 including updates through 2001, J. Quant. Spectrosc. Radiat. Transfer, 82, 5–44, 2003.10211
20
Rothman, L. S., Jacquemart, D., Barbe, A. et al.: The HITRAN 2004 molecular spectroscopic database, J. Quant. Spectrosc. Radiat. Transfer, 96, 139–204, 2005a. 10213
Rothman, L. S., Jacquinet-Husson, N., Boulet, C., and Perrin, A. M.: History and future of the molecular spectroscopic databases, C. R. Physique, 6, 897–907, 2005b.10220
Sarkissian, A., Vaughan, G., Roscoe, H. K., Bartlett, L. M., O’Connor, F. M., Drew, D. G.,
25
Hughes, P. A., and Moore, D. M.: Accuracy of measurements of totla ozone by a SAOZ ground-based zenith sky visible spectrometer, J. Geophys. Res., 107, 1379–1390, 1997.
10212
Savasktiouk, V. and McElroy, C. T.: Brewer spectrophotometer total ozone measurements made during the 1998 Middle Atmosphere Nitrogen Trend Assessment (MANTRA)
cam-30
paign, Atmos.-Ocean, 43, 315–324, 2005. 10209,10213
Solomon, S., Schmeltekopf, A. L., and Sanders, R. W.: On the interpretation of zenith sky absorption measurements, J. Geophys. Res., 92, 8311–8319, 1987. 10211
ACPD
7, 10205–10234, 2007 Ground-based ozone and NO2 during MANTRA 2004 A. Fraser et al. Title Page Abstract Introduction Conclusions References Tables Figures ◭ ◮ ◭ ◮ Back CloseFull Screen / Esc
Printer-friendly Version
Interactive Discussion
EGU
Strong, K., Bailak, G., Barton, D., et al.: MANTRA – A balloon mission to study the odd-nitrogen budget of the stratosphere, Atmos.-Ocean, 43, 283–299, 2005. 10206
Sung K., Skelton, R., Walker, K. A., Boone, C. D., Fu, D., and Bernath, P. F.: N2O and O3 Arctic column amounts from PARIS-IR observations: Retrievals, characterization and error analysis, J. Quant. Spectrosc. Radiat. Transfer, doi:10.1016/j.jqsrt.2007.03.002, 2007.10222
5
Tarasick, D. W., Fioletov, V. E., Wardle, D. I., Kerr, J. B., and Davies, J.: Changes in the vertical distribution of ozone over Canada from ozonesondes: 19802001, J. Geophys. Res., 110, D02304, doi:10.1029/2004JD004643, 2005. 10219
Vandaele, A. C., Hermans, C., Simon, P. C., Carleer, M., Colin, R., Fally, S., M ´erienne, M. -F., Jenouvrier, A., and Coquart, B.: Measurements of the NO2 absorption cross-section from
10
42 000 cm−1to 10 000 cm−1(238–1000 nm) at 220 K and 292 K, J. Quant. Spectrosc. Radiat. Transfer, 59, 171–184, 1998.10211
Vandaele, A. C., Fayt C., Hendrick, F. et al.: An intercomparison campaign of ground-based UV-visible measurements of NO2, BrO, and OClO slant columns: Methods of analysis and results for NO2, J. Geophys. Res., 110, D08305, doi:10.1029/2004JD005423, 2005. 10207
15
Wunch, D. Tingley, M. P., Shepherd, T. G., Drummond, J. R., Moore, G. W. K., and Strong, K.: Climatology and predictability of the late summer stratospheric zonal wind turnaround over Vanscoy, Saskatchewan, Atmos.-Ocean, 43, 301–313, 2005. 10206
Wunch, D., Midwinter, C., Drummond, J. R., McElroy, C. T., and Bag `es, A.-F.: The Univer-sity of Toronto’s balloon-borne Fourier transform spectrometer, Rev. Sci. Inst., 77, 93–104,
20
doi:10.1063/1.2338289, 2006.10210,10213
Wunch, D., Taylor, J. R., Fu, D., Bernath, P. F., Drummond, J. R., Midwinter, C., Strong, K., and Walker, K. A.: Simultaneous ground-based observations of O3, HCl, N2O, and CH4over Toronto, Canada by three Fourier transform spectrometers with different resolutions, Atmos. Chem. Phys., 7, 1275–1292, 2007,
25
http://www.atmos-chem-phys.net/7/1275/2007/. 10222
York, D., Evensen, N. M., L ´opez Mart´ınez, M., and De Basabe Delgado, J.: Unified equations for the slope, intercept, and standard errors of the best straight line, Am. J. Phys., 72, 367– 375, 2004.
10215
ACPD
7, 10205–10234, 2007 Ground-based ozone and NO2 during MANTRA 2004 A. Fraser et al. Title Page Abstract Introduction Conclusions References Tables Figures ◭ ◮ ◭ ◮ Back CloseFull Screen / Esc
Printer-friendly Version
Interactive Discussion
EGU
Table 1. Type 1 regression analysis results for NO2 for the UT-GBS and SAOZ. Values given are campaign averages for the regression parameters. Values that meet the NDACC standards are shown in bold. The intercept and residual are given in 1016molec/cm2. N is the number of days used in calculating the average.
NO2AM, N = 14 NO2PM, N = 30 slope 1.070±0.075 1.046±0.068
intercept 0.617±0.333 0.229±0.492 RMS of residual 0.318±0.055 0.357±0.079
ACPD
7, 10205–10234, 2007 Ground-based ozone and NO2 during MANTRA 2004 A. Fraser et al. Title Page Abstract Introduction Conclusions References Tables Figures ◭ ◮ ◭ ◮ Back CloseFull Screen / Esc
Printer-friendly Version
Interactive Discussion
EGU
Table 2. Type 2 regression analysis results for NO2for the UT-GBS and SAOZ. The offsets are given in 1016molec/cm2. Values given are campaign averages for the regression parameters. Values that meet the NDACC standards are shown in bold. The number of days used in the average is the same as for the Type 2 comparisons (Table 1).
NO2AM NO2PM ratio 1.042 0.969
standard deviation 0.085 0.042
ACPD
7, 10205–10234, 2007 Ground-based ozone and NO2 during MANTRA 2004 A. Fraser et al. Title Page Abstract Introduction Conclusions References Tables Figures ◭ ◮ ◭ ◮ Back CloseFull Screen / Esc
Printer-friendly Version Interactive Discussion EGU 75 80 85 90 95 0 1000 2000 3000 4000 5000 6000 7000 8000 9000 10000 SZA (degrees) O3 DSCD (DU) 75 80 85 90 95 0 2 4 6 8 10 12 14 16 18x 10 16 SZA (degrees) NO 2 DSCD (molec/cm 2) UT−GBS SAOZ UT−GBS SAOZ MAESTRO SPS (a) (b)
Fig. 1. (a) Ozone differential slant column densities for the UT-GBS, SAOZ, MAESTRO, and
ACPD
7, 10205–10234, 2007 Ground-based ozone and NO2 during MANTRA 2004 A. Fraser et al. Title Page Abstract Introduction Conclusions References Tables Figures ◭ ◮ ◭ ◮ Back CloseFull Screen / Esc
Printer-friendly Version Interactive Discussion EGU 2000 3000 4000 5000 6000 7000 2000 3000 4000 5000 6000 7000 SAOZ O 3 DSCD (DU) UT−GBS O 3 DSCD (DU) 84 85 86 87 88 89 90 91 92 −150 −100 −50 0 50 100 150 SZA (degrees) Residual (DU) 2 4 6 8 10 12 2 4 6 8 10 12 SAOZ NO 2 DSCD (x10 15 cm−2) UT−GBS NO 2 DSCD (x10 15 cm −2 ) 84 85 86 87 88 89 90 91 92 −0.6 −0.4 −0.2 0 0.2 0.4 0.6 0.8 SZA (degrees) Residual (x10 15 cm −2 ) slope = 0.976 ± 0.025 int = −250 ± 109 R2 = 0.997 slope = 1.136 ± 0.112 int = (−6.20 ± 7.40)x1015 R2 = 0.984 RMS = 77.0 ± 17.2 RMS = (3.47 ± 0.76)x1015 (a) (b) (c) (d)
Fig. 2. (a) Type 1 regression analysis for ozone between UT-GBS and SAOZ for sunset, 20
ACPD
7, 10205–10234, 2007 Ground-based ozone and NO2 during MANTRA 2004 A. Fraser et al. Title Page Abstract Introduction Conclusions References Tables Figures ◭ ◮ ◭ ◮ Back CloseFull Screen / Esc
Printer-friendly Version
Interactive Discussion
EGU
UT/SZ UT/SP UT/MS SP/SZ MS/SZ MS/SP 0.9
1 1.1
Slope
UT/SZ UT/SP UT/MS SP/SZ MS/SZ MS/SP −1000
−500 0 500
Intercept (DU)
UT/SZ UT/SP UT/MS SP/SZ MS/SZ MS/SP 0 100 200 300 400 Residual (DU) N A = 24 N P = 31 N A = 18 N P = 21 NA = 3 N P = 3 NA = 23 N P = 21 N A = 5 N P = 5 N A = 5 N P = 5
Fig. 3. Type 1 regression analysis results for ozone for all pairs of UV-visible zenith-sky in-struments. Dashed horizontal lines indicate the required accuracies set by the NDACC. Blue is for the morning comparisons, red is for the afternoon. UT indicates the UT-GBS, SZ is SAOZ, SP is SPS, and MS is MAESTRO. NAand NP are the number of days used in calculating the morning and afternoon averages.
ACPD
7, 10205–10234, 2007 Ground-based ozone and NO2 during MANTRA 2004 A. Fraser et al. Title Page Abstract Introduction Conclusions References Tables Figures ◭ ◮ ◭ ◮ Back CloseFull Screen / Esc
Printer-friendly Version
Interactive Discussion
EGU
UT/SZ UT/SP UT/MS SP/SZ MS/SZ MS/SP
0.8 0.9 1 1.1 1.2 1.3 Ratio
Fig. 4. Type 2 regression analysis results for ozone for all pairs of UV-visible zenith-sky
instru-ments. Dashed horizontal lines indicate the required accuracy set by the NDACC. Blue is for the morning comparisons, red is for the afternoon. The number of days used in the average is the same as for the Type 1 comparisons (Fig.3).
ACPD
7, 10205–10234, 2007 Ground-based ozone and NO2 during MANTRA 2004 A. Fraser et al. Title Page Abstract Introduction Conclusions References Tables Figures ◭ ◮ ◭ ◮ Back CloseFull Screen / Esc
Printer-friendly Version Interactive Discussion EGU 220 225 230 235 240 245 250 255 260 260 280 300 320 340 360 380 400 Day of Year Ozone VCD (DU)
UT−GBS SAOZ MAESTRO SPS Brewer U of T FTS PARIS−IR DU FTS Sondes
Fig. 5. Daily-averaged ozone vertical column densities as measured by the UT-GBS, SAOZ,
ACPD
7, 10205–10234, 2007 Ground-based ozone and NO2 during MANTRA 2004 A. Fraser et al. Title Page Abstract Introduction Conclusions References Tables Figures ◭ ◮ ◭ ◮ Back CloseFull Screen / Esc
Printer-friendly Version Interactive Discussion EGU 220 225 230 235 240 245 250 255 260 3 4 5 6 7 8 x 10¹⁵ Day of Year NO 2 VCD (molec/cm 2 ) UT−GBS am UT−GBS pm SAOZ am SAOZ pm