HAL Id: hal-00299415
https://hal.archives-ouvertes.fr/hal-00299415
Submitted on 26 Feb 2007
HAL is a multi-disciplinary open access
archive for the deposit and dissemination of
sci-entific research documents, whether they are
pub-lished or not. The documents may come from
teaching and research institutions in France or
abroad, or from public or private research centers.
L’archive ouverte pluridisciplinaire HAL, est
destinée au dépôt et à la diffusion de documents
scientifiques de niveau recherche, publiés ou non,
émanant des établissements d’enseignement et de
recherche français ou étrangers, des laboratoires
publics ou privés.
Validation of landslide hazard assessment by means of
GPS monitoring technique ? a case study in the
Dolomites (Eastern Alps, Italy)
F. Tagliavini, M. Mantovani, G. Marcato, A. Pasuto, S. Silvano
To cite this version:
F. Tagliavini, M. Mantovani, G. Marcato, A. Pasuto, S. Silvano. Validation of landslide hazard
assessment by means of GPS monitoring technique ? a case study in the Dolomites (Eastern Alps,
Italy). Natural Hazards and Earth System Science, Copernicus Publications on behalf of the European
Geosciences Union, 2007, 7 (1), pp.185-193. �hal-00299415�
www.nat-hazards-earth-syst-sci.net/7/185/2007/ © Author(s) 2007. This work is licensed under a Creative Commons License.
and Earth
System Sciences
Validation of landslide hazard assessment by means of GPS
monitoring technique – a case study in the Dolomites
(Eastern Alps, Italy)
F. Tagliavini1, M. Mantovani1, G. Marcato1, A. Pasuto1, and S. Silvano1
1CNR-IRPI – National Research Council of Italy, Research Institute for Hydrological and Geological Hazard Prevention,
C.so Stati Uniti 4, 35127 Padova, Italy
Received: 24 October 2006 – Revised: 20 February 2007 – Accepted: 20 February 2007 – Published: 26 February 2007
Abstract. In the last years a research project aimed at the
assessment of the landslide hazard and susceptibility in the high Cordevole river basin (Eastern Dolomites, Italy) have been carried out. The hazard map was made adopting the Swiss Confederation semi-deterministic approach that takes into account parameters such as velocity, geometry and fre-quency of landslides. Usually these parameters are collected by means of geological and morphological surveys, histori-cal archive researches, aerophotogrammetric analysis etc. In this framework however the dynamics of an instable slope can be difficult to determine. This work aims at illustrating some progress in landslide hazard assessment using a mod-ified version of the Swiss Confederation semi-deterministic approach in which the values of some parameters have been refined in order to accomplish more reliable results in hazard assessment. A validation of the accuracy of these new val-ues, using GPS and inclinometric measurements, has been carried out on a test site located inside the high Cordevole river basin.
1 Introduction
In the 20th century numerous hydrological and geological disarray events caused the loss of at least 5381 lives in Italy and left over 100 000 people homeless or evacuated (Guzzetti, 2000). In the past 50 years, direct damage to assets and properties was estimated around 500 million euros per year (Catenacci, 1992). Following these disastrous events, there has been growing interest nationally and internationally in the search for new strategies aiming at mitigating geolog-ical and hydrologgeolog-ical risks.
In addition there is growing awareness from both public administrations and the general public that a correct policy of
Correspondence to: F. Tagliavini
territorial management can be attained only through in-depth understanding of natural processes. This interest led to the acquisition of a greater knowledge of landslide mechanisms and the definition of the useful instruments to manage and forecast landslides evolution.
After the Sarno (Campania Region) and Soverato (Cal-abria Region) mudflow disasters, which claimed several lives in 1998 and 2000 respectively (Zanchetta et al., 2004), a specific law (267/98) was passed with the goal of locating and zoning the areas prone to hydrological and geological risk. Numerous methodologies have been tested to obtain an evaluation of the risk situation of the territory as objec-tive as possible. This work aims at illustrating some progress in landslide hazard assessment using a modified version of the Swiss Confederation semi-deterministic approach (Hein-iman et al., 1998) in which the values of some parameters have been refined in order to accomplish more reliable results in hazard assessment. A validation of the accuracy of these new values, using GPS and inclinometric measurements, has been carried out on a test site located inside the high Cordev-ole river basin, showing interesting results for territorial plan-ning and management.
2 Present soil conservation law in Italy
A lack of prevention means and control over the territory by the authorities can be considered as a main factor contribut-ing to the high social costs of landslide events. A modern de-veloped country should have a set of rules for defining stan-dards both for strict soil conservation policy and for safe-guarding the public against natural hazards. In Italy where 38% of the national territory are hilly and 39% are mountain-ous, the implementation of such norms is an absolute neces-sity if the loss of human lives and economic assets caused by landslides and floods is to be reduced. In recent decades ex-isting norms have been continuously updated and improved,
186 F. Tagliavini et al.: GPS monitoring system in landslide hazard mapping
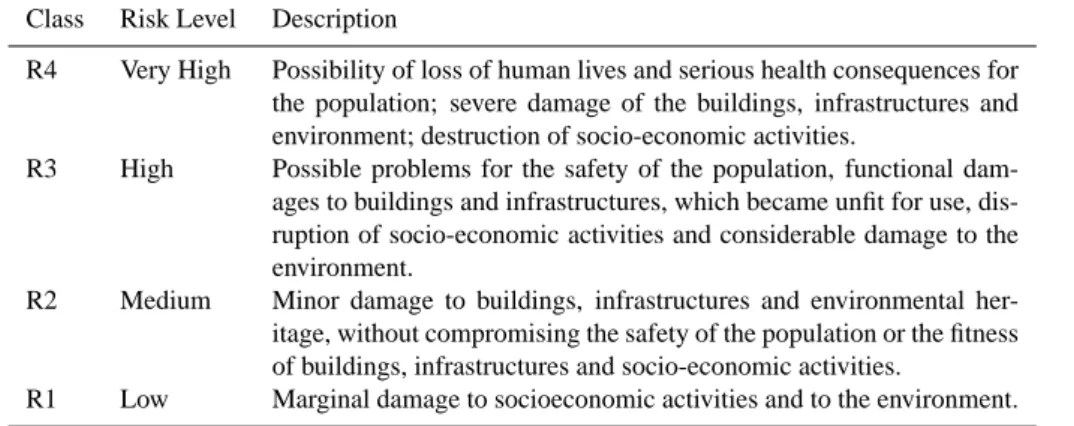
Table 1. Territory class risk according to law no. 267/98.
Class Risk Level Description
R4 Very High Possibility of loss of human lives and serious health consequences for the population; severe damage of the buildings, infrastructures and environment; destruction of socio-economic activities.
R3 High Possible problems for the safety of the population, functional dam-ages to buildings and infrastructures, which became unfit for use, dis-ruption of socio-economic activities and considerable damage to the environment.
R2 Medium Minor damage to buildings, infrastructures and environmental her-itage, without compromising the safety of the population or the fitness of buildings, infrastructures and socio-economic activities.
R1 Low Marginal damage to socioeconomic activities and to the environment.
even if this has always taken place following the emotional reaction to major catastrophes. The main Italian law dealing with environmental management is law no. 267/98, which was passed after the disastrous Sarno events that claimed over 150 lives. The law defines territorial control and man-agement pattern in order to assess and zone hydrogeological risk. For the first time this law pinpoints, as its primary goals, the prevention and forecast of hydrogeological catastrophes. In addition, a series of short and long-term planning inter-ventions have been set up, one of which is a special plan for the most urgent measures concerning maximum hazard areas, together with a more comprehensive plan (plan for hy-drogeological adjustment – PAI) which provides for the iden-tification and analysis of all areas at risk all over Italy.
The risk zonation is made by attributing one of the four risk levels defined by law no. 267/98 (Table 1). The law pro-vides suitable guidelines not only for existing settlements and infrastructures but also for urban and territorial planning, so as not to trigger off new risk situations due to improper use of the territory. Furthermore the law clearly defines the re-strictions in the use of the high risk areas.
3 Methodological approach
Considerable difficulties have emerged in the application of the rules introduced by law no. 267/98 because it establishes that the “risk” must be calculated directly on the basis of foreseen or foreseeable damage. It does not, however, pro-vide informations on how to quantify the characteristics of disarray processes and their possible evolution. For this rea-son, territorial management boards have decided to follow alternative paths taking into account the characteristics and distribution of landslides and risk elements, which give pri-ority to the definition of hazard rather than risk.
As a consequence, in north-eastern Italy the Swiss Con-federation semi-deterministic approach developed by Heini-mann et al. (1998) was adopted. This method allows greater objectivity in the definition of the parameters involved in
haz-ard assessment by using matrices compiled on the basis of the combination of probability of occurance (frequency) and magnitude of the phenomena, followiong Fell (1994), Canuti and Casagli (1996) and Crescenti (1998).
Particular attention was given to the analysis of proce-dures in vulnerability assessment. In the most frequently used methods, the degree of expected loss is usually ex-pressed by a value ranging between 0 (no loss) and 1 (total loss). Nevertheless, in contrast with other natural processes, such as flooding and earthquakes, it is very difficult to as-sess vulnerability resulting from landslides, at basin-scale or region-scale studies. This is due to the complexity and wide range of landslide processes and, therefore, to the typology of structures affected. In addition, the assessment of risk and of economic losses caused by a certain disarray event should not take into account only the value of the elements involved (direct damage), but also consider the dynamic of economic processes which are typical of the investigated area, in other words, what economists define as “indirect damage”. There-fore not only the possible structural damage to assets subject to risk (e.g., transport infrastructure, power lines, tourism, handicraft activities and industrial structures) should be as-sessed but also indirect economic losses resulting from the disruption of these assets and from the suspension of and/or administrative activities activities.
The need to operate at a regional scale, as in this case study, has suggested to adopt a simplified methodology to render results and risk elements homogeneous by defining, for each landslide, only the hazard. The determination of vulnerability and risk has been deliberately neglected since it could not be proposed in this case due to lack of economic expertises.
The essential steps of the methodology adopted are:
– identification of landslide processes (landslides map); – assessment of the intensity or magnitude of disarray
processes;
– assessment of hazard;
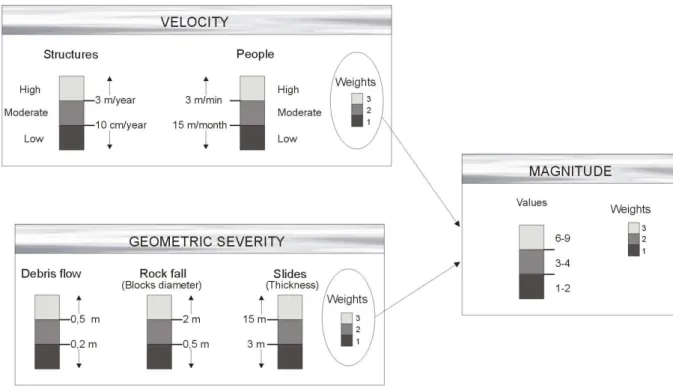
Fig. 1. Matrices for the velocity and geometric severity classification, the product of the two weights gives the magnitude value.
The intensity or magnitude should produce information on the energy accumulated by each landslide process during its movement.
The basic and fundamental element for landslide hazard assessment should be a landslide inventory map containing the following elements:
– landslides typology (according to Varnes, 1984); – affected or prone areas;
– state of activity; – geometric parameters;
– possible evolution of the phenomenon.
In the past years the methodology suggested by Heinimann et al. (1998) has been often applied to the north eastern Ital-ian basins (Pasuto et al., 2004). These experiences pointed out various problems concerning reliability of the data col-lected in comparison to the requested parameters. In fact if, on one hand it is correct to separate the velocity and the volume in the landslide magnitude evolution, on the other hand it is not possible to provide monitoring systems that could realistically discriminate landslide velocity working on a basin scale, as indicated by the Swiss Confederation semi-deterministic approach. In the high Cordevole river basin, for example, more than 800 landslides were mapped. This number makes obviously unfeasible any kind of monitoring system to be established. Therefore the only way to obtain
Table 2. Landslide frequency intervals proposed by Heinimann et
al. (1998).
Return Time Landslide Activity
<1 year active, continuous and/or intermittent landslides
1–30 years dormant – high-frequency episodic landslides 30–100 years dormant – mid-frequency episodic landslides 100–1000 years dormant – low-frequency episodic landslides
>1000 years non-active or very-low-frequency landslides
reliable results was to collect data on the basis of morpholog-ical evidences, multi-temporal aerophotographs and histori-cal data. In order to get over these limitations, new matrices with different ranges both of velocity and geometric severity were defined by the authors.
The different velocity intervals, schematically illustrated in Fig. 1, take into account the definitions already proposed in the literature, which define the velocity of 3 m/min as the maximum value for alerting people and evacuating buildings. The combination of rating values, intended as the prod-uct of the velocity and the geometric severity, deduced from figure and calculated for each identified landslides, allows to calculate a new matrix whose values define the magnitude of the process.
188 F. Tagliavini et al.: GPS monitoring system in landslide hazard mapping
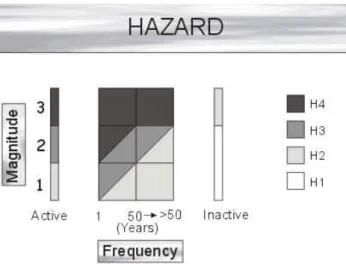
Fig. 2. Interaction matrix used for assessing landslide hazard.
Hazard is defined as the probability that a given event of a given magnitude may occur in a given time interval (Varnes, 1984). After the magnitude of a landslide has been evalu-ated, in order to asses the hazard it is necessary to define a frequency of the phenomena. Nevertheless, the determi-nation of time occurrence may present considerable difficul-ties. Data on the recurrence of landslide events are usually scarce or non-existent. Only occasionally and with refer-ence to processes such as debris flows and soil slips, that are directly linked to particular pluviometric events, field in-vestigations are carried out. Existing databases and histori-cal bibliographic references allow an assessment of temporal distribution. More frequently, owing to the low number of studied events and the lack of adequate historical series, the time occurrence cannot be defined with sufficient reliability. Considering the lack of historical data for statistically defining the frequency, Heinimann et al. (1998) suggest to split the time scale into five temporal classes. These classes were statistically defined on the basis of data on the recur-rence of different landslide types, and calibrated using geo-morphological evidences, analyses from archives of histori-cal photos and aerial imagery. The five temporal classes are so defined by Heinimann et al. (1998) in Table 2.
Nevertheless this subdivision appears too generic since it does not take into account the peculiarities of the investigated areas or the different distribution and amount of historical in-formation available. For these reasons the classes have been redesigned according to the characteristics of the study areas as follows:
– Active landslides (continuous); – Non-active landslides;
– Dormant landslides with return time lower than 50
years;
– Dormant landslides with return time higher than 50
years.
This temporal subdivision is justified by two factors. On the one hand, the need to establish time limitation, trying to simplify as far as possible the methodological approach; on the other hand, the awareness that, in the safeguarding of public safety, there are no substantial differences, in terms of hazard, if return times of a few years or decades are con-sidered. In fact, it is quite probable that major damage may occur just in the second case, since disarray processes which have been dormant for a long time might induce false percep-tions of risk condipercep-tions among the population and lead to the use of areas which should instead remain unspoiled because of their precarious stability conditions.
In particular, as regards north-eastern Italy, it seems ac-ceptable temporal limits between 50 and 100 years. The class up to 50 years would include also the disarray pro-cesses occurring in concomitance with the disastrous flood of 1966 (Castiglioni, 1973; Croce et al., 1973), which struck also Florence, Venice and North Eastern Italy, and which can be considered as the boundary for the diffusion and inten-sity of disarray processes that may occur during particularly exceptional meteorological events. In addition, the first com-plete aerial survey, which is a fundamental tool for assessing the evolution of a given territory, goes back to 1954. The methodological scheme utilised allows to define a basis ma-trix, according to which, one of the four hazard classes listed in Fig. 2 will be assigned to each landslide process examined. The four hazard classes obtained might now have a sort of correspondence with the four risk classes identified by Law no. 267/98, since the possibility of damage to assets and peo-ple can be associated to each of the hazard classes, although the difference has to be clear.
Once elaborated the new matrices the need was to vali-date the new values according to the real movements of the landslide. To accomplish this aim, a monitoring system con-stituted by GPS network and an inclinometric tube was in-stalled on a sub-basin of the study area.
4 Case study
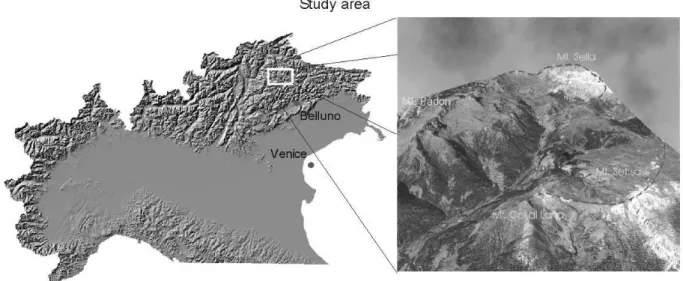
The illustrated methodological approach has been tested in the Cordevole river basin, in the province of Belluno (north-eastern Italy). The area, that stretches over some 50 km2, is completely located within the Dolomite Region with a differ-ence in altitude from 1200 m a.s.l. to 3100 m a.s.l. (Fig. 3).
The basin is characterised by steep slopes made up of lime-stone, dolomite and also of some consistent volcanic sand-stone. Instead the low slope angles present in the area are due to flyshoid bedrock, morainic deposits and product of their weathering.
Rocks cropping out in the area stretch in age from late Permian to Norian (Bosellini, 1996), with their uppermost parts constituted by dolomitic rocks forming isolated peaks
Fig. 3. Location of the study area.
or high standing plateaus. At the reef margins, they are inter-laced with basin deposits of volcanic, carbonaceous or cal-careous origin, often deposited as turbidites, that can now be found on slopes underlying the Dolomite mountains. They are mainly constituted by weak-layered rocks, with marl or limestone strata up to 50 cm thick, alternating with thin clay shale and claystone strata forming packs up to 1 m thick.
The area is affected by important tectonic structures, prevalently related to the Tertiary NE-SW trending Alpine compression (Doglioni and Bosellini, 1987). In the study area faults have been classified by geometric and kinematic elements, able to discriminate among low angle faults, thrust faults, tension faults, normal faults and thrusts. Moreover, folds of regional and/or local extension have been mapped too.
In the study area, precipitations are mainly concentrated during summer and autumn seasons, with an annual mean of about 920 mm.
Particularly prominent are landforms and deposits due to gravitational mass movements. Landslide deposits vary from rock falls to debris flows in the dolomitic cliffs and from ro-tational slides to earth flows in slopes made up of pelitic rock types.
All data useful for the analysis have been derived from field activities, photo interpretations and existing databases. The landslide inventory map and the predictor patterns sup-porting information on landslide conditioning factors, have been collected, critically reviewed, digitised and imple-mented into the project database, managed within a geo-graphical information system (GIS).
The following maps have been initially used:
– landslide inventory map, consisting of about 800
poly-gons. The map is linked to attribute tables,
contain-ing information on type, style of activities, geometrical characteristics, etc.
– bedrock map, depicting the main geological units
out-cropping in the area;
– structural map, representing detailed
morpho-structural elements;
– distance from tectonic lines, buffering the main tectonic
discontinuities;
– land use map, indicating the main land use units
that might affect the hydrological condition and soil strength;
– distance from rivers, buffering the streams of different
orders;
– slope geometry, such as altitude, slope angle, aspect,
longitudinal and transverse slope curvature. Morpho-metric and hydrological parameters have been automat-ically extracted from a digital elevation model, through neighbourhood operations (in part available beforehand, in part specifically designed within the GIS). Additional parameters such as watershed area, drainage density, drainage network order, channel length, etc. have been derived and used.
For analysis purposes, all thematic maps at 1:5000 scale have been transformed into a raster format with a pixel size of 5×5 m.
The geological and morphological survey of the territory allowed us to identify that more than 20% of the area are affected by landslides and that most of them belong to the two main typologies: earth flow and debris flow (Fig. 4).
190 F. Tagliavini et al.: GPS monitoring system in landslide hazard mapping
Fig. 4. Cordevole upper basin Hazard map.
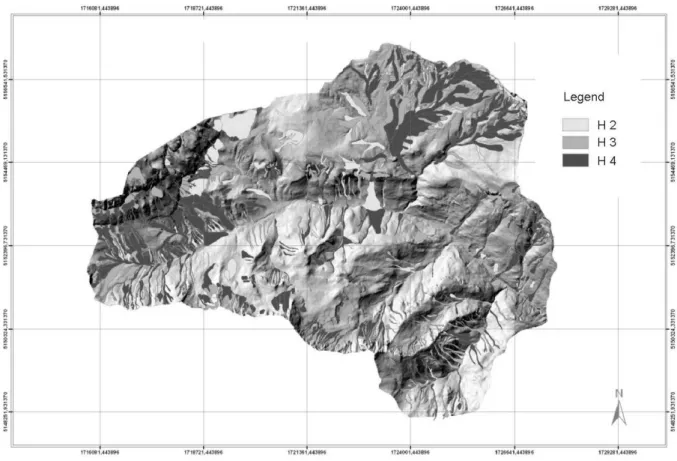
Fig. 5. Cherz plateau and its hazard classification.
In this framework the Cherz plateau was identified as area of particular interest due to the high concentration of land-slides (almost 200), with wide range of velocity and geomet-ric severity (Fig. 5). The Cherz plateau lithology consists of an alternance of marls and sandstones; this type of lithology,
along with the high amount of rainfall, causes a large num-ber of landslides distinguished by rotational slides and earth flow. Therefore this area has been selected in order to test the above illustrated hazard assessmentmethod and verify its re-liability by means of detailed investigations and monitoring. Further to geomorphological surveys and aerial photo in-terpretation the hazard was classified according to the new matrices proposed in this paper (Fig. 5).
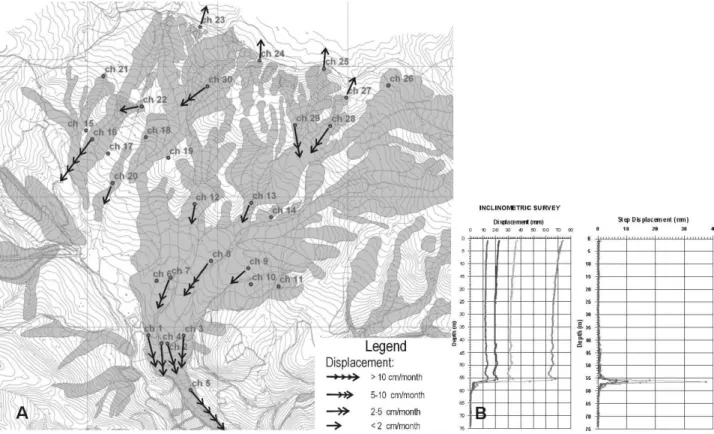
Once assessed the hazard according to the new matrices the new goal was to validate the results. To do that a GPS network consisting of 30 benchmarks and an inclinometric tube were installed (Fig. 6).
5 Monitoring system
The GPS control network was realized in order to monitor the rate of superficial deformation caused by the landslide to better define the hazard matrix. The GPS monitoring system consists of 1 reference benchmark located in a stable area and of 30 benchmarks spread all over the unstable slope. The length of the baselines ranges between 2976 m and 137 m. In order to warrant the repetitiveness of the surveys, avoid-ing positionavoid-ing errors, a forced centravoid-ing system was realized for each benchmark. During the GPS surveys 4 geodetic (dual frequency) receivers were employed. Static relative
Fig. 6. (a) planar displacement, as oserved from GPS survey, (b) displacement of the slip surface, data from inclinometric tube.
positioning technique was used in order to achieve more ac-curate results (Hofmann-Wellenhof et al., 2001), within a site occupation time of 20 min, a 2 second sampling rate and a 15◦cut off angle. Tropospheric effects were calculated us-ing Hopfield model. Startus-ing from November 2004, 4 GPS surveys were carried out during two and a half years investi-gation period. The stability of the reference station, that was materialized over consistent bedrock, was checked during ev-ery survey using the permanent station located in Bolzano (Itay) at about 44 km far from the site . The survey param-eters such as the number of reference points and the site oc-cupation time were chosen after a network design simulation according to the maximum accuracy achievable and the in-strumentation available. The results are summarized in Ta-bles 3 and 4.
The displacements recorded by 9 benchmarks (ch06, ch10, ch11, ch14, ch15, ch17, ch18, ch19, ch21, ch26) are smaller then the relative error ellipses so they are not significant and the points can be considered stable so far. Benchmarks ch01, ch02, ch03, ch04, ch07 show a quasi-constant rate of dis-placement with an average ranging from 3 to 4.4 cm/month and a slight increase of the velocity. A significant accelera-tion between July 2005 and October 2005 has been recorded by benchmarks ch08, ch16, ch28, ch29, ch30 although for the last 3 points the rate of displacements average between 1.1 and 2.1 cm/month while for ch08 exceed 6 cm/month and
almost reaches 13 cm/month for ch16. Slower displacements ranging between 1 and 0.3 cm/month have been recorded by benchmarks ch09, ch12, ch13, ch20, ch22. Regressive displacements that are in good agreement with the dynam-ical evolution of the crown of the landslide are witnessed by backward displacements collected by benchmarks ch23, ch24, ch25, ch27. Finally point ch05, located at the toe of the landslide, recorded an average rate of movement of 15.9 cm/months with a continuous increment of speed that reached 17.6 cm/month.
The inclinometric tube was installed on November 2004 in order to evaluate both the rate of deep displacements caused by the landslide and the position of its sliding surface. Four surveys were carried out before the tube breaking on Jan-uary 2005. The data so far collected showed the presence of the main sliding surface at a depth of 55 m with a constant rate of the deformation of about 4.75 mm/month. This result agrees almost perfectly with the rate of constant deformation recorded by benchmark ch4 (3.8 cm/month) that is the clos-est to the inclinometric tube.
6 Conclusions and discussion
The monitoring system was used to validate the new parame-ters adopted for the Swiss Confederation semi-deterministic approach. The GPS monitoring technique allows us to
192 F. Tagliavini et al.: GPS monitoring system in landslide hazard mapping
Table 3. Cumulative planar displacements, minus sign shows
re-gressive displacements.
Cumulative Planar Displacements [cm]
Benchmarks July 2005 October 2005 July 2006
ch01 31 44.8 86.9 ch02 25.3 35.9 75.5 ch03 21.2 29.9 61.1 ch04 26.5 37.9 76.8 ch05 112.3 160.3 318.5 ch07 20.3 29.9 61.8 ch08 33.5 61.7 112.2 ch09 1.7 2.3 5.6 ch12 0 2.4 3.6 ch13 2.8 7.5 18.6 ch16 73.7 126.6 233.5 ch20 1.1 3.1 5.8 ch22 2.2 5 6.6 ch23 −1.5 −1.5 −2.1 ch24 −2.8 −2.8 −2.8 ch25 −2.6 −2.6 lost ch27 −2.3 −3.2 −3.2 ch28 0 14.8 18.5 ch29 0 8.7 11 ch30 4.2 20.2 24.5
Time elapsed since 8 11 20
first reading [months]
exactly define the velocity of the landslide mapped and to compare these values to those assigned by morphological ev-idences. Two different hazard maps were thus carried out: the first one takes into account the values of the parameters deduced by the monitoring system and the second mapped just by morphological evidences. The results of this re-classification clearly demonstrate that almost every landslide mapped by morphological evidences in the test site fits with the hazard value calculated from measured data, and only five landslides changed hazard class.
Figures 7 and 8 show an evident resemblance between the hazard classes calculated using the above mentioned method-ologies. The landslides mapped on the base of morphological evidences that preserve their hazard class after the correction with the real values average 90 percent.
Moreover the lower class of hazard (H2) is underestimated while the higher hazard class (H4) is overestimated, meaning that the new parameters adopted are indeed conservative.
It is possible to assert that with the values adopted in these new matrices the data such as velocity and geometric severity are easy to collect by morphological evidences and properly estimated, making the Swiss approach a reliable methodology in hazard mapping. Finally from the results achieved in this work, it can be assumed that it is possible to extend the effectiveness of this new parameters with good reliability to all the sites in the High Cordevole Valley that have geological and geomorphological characteristics, similar to the Cherz plateau.
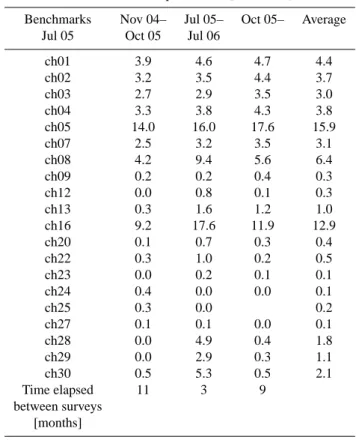
Table 4. Rate of planar displacements.
Rate of Planar Displacements [cm/month]
Benchmarks Nov 04– Jul 05– Oct 05– Average Jul 05 Oct 05 Jul 06
ch01 3.9 4.6 4.7 4.4 ch02 3.2 3.5 4.4 3.7 ch03 2.7 2.9 3.5 3.0 ch04 3.3 3.8 4.3 3.8 ch05 14.0 16.0 17.6 15.9 ch07 2.5 3.2 3.5 3.1 ch08 4.2 9.4 5.6 6.4 ch09 0.2 0.2 0.4 0.3 ch12 0.0 0.8 0.1 0.3 ch13 0.3 1.6 1.2 1.0 ch16 9.2 17.6 11.9 12.9 ch20 0.1 0.7 0.3 0.4 ch22 0.3 1.0 0.2 0.5 ch23 0.0 0.2 0.1 0.1 ch24 0.4 0.0 0.0 0.1 ch25 0.3 0.0 0.2 ch27 0.1 0.1 0.0 0.1 ch28 0.0 4.9 0.4 1.8 ch29 0.0 2.9 0.3 1.1 ch30 0.5 5.3 0.5 2.1 Time elapsed 11 3 9 between surveys [months]
Edited by: T. Glade
Reviewed by: H. Staffler and two other referees
References
Bosellini, A.: Geologia delle Dolomiti, Athesia Bolzano, 192 pp., 1996.
Canuti, P. and Casagli, N.: Considerazioni sulla valutazione del rischio di frana, Fenomeni franosi e centri abitati eds, CNR-GNDCI, 846, 57 pp., 1996.
Castiglioni, G. B.: Note di commento alla carta dell’alluvione del novembre 1966, nel Veneto e nel Trentino Alto Adige: effetti morfologici ed allagamenti, Proc. of XXI Congresso Geografico Italiano, Verbania 1971, Istituto Geografico de Agostini Novara, 2(3), 1973.
Catenacci, V.: Geological and geoenvironmental failure from the post war to 1990, Italy, Roma, Istituto Poligrafico e Zecca dello Stato, 301 pp., 1992.
Crescenti, U.: Il rischio da frana: appunti per la valutazione, Quaderni di Geologia Applicata, 5(2), 87–100, 1998.
Croce, D., Nodari, P., Pellegrini, G. B., Tessari, F.: Effetti dell’alluvione del novembre 1966 sulle sedi abitate delle Tre Venezie. Proc. of XXI Congresso Geografico Italiano, Verbania 1971, Istituto Geografico de Agostini Novara, 2(2), 1973.
Fig. 7. Comparison between (a) hazard map carried out with morphological evidences and (b) hazard map carried out with the aid of
monitoring system.
Fig. 8. Diagram of hazard overlapping between the different hazard
maps.
Doglioni, C. and Bosellini, A.: Eoalpine and mesoalpine tecton-ics in the Southern Alps, Geologische Rundschau, 76, 735–754, 1987.
Fell, R.: Landslide risk assessment and acceptable risk, Canadian Geotechnical Journal, 31(2), 261–272, 1994.
Guzzetti, F.: Landslide fatalities and evolution of landslide risk in Italy, Engineering Geology, 58, 89–107, 2000.
Heinimann, H. R., Holtenstein, K., Kienholz, H., Krummenhacher, B., and Mani, P.: Methoden zur Analyse und Bewertung von Naturgefahren, Umwelt-Materialien, Naturgefahren BUWAL, 85, Bern, pp. 248, 1998.
Hofmann-Wellenhof, B., Lichtenegger, H., and Collins, J.: GPS Theory and practice, 5a revised edit., Springer Verlag, Wien, 2001.
Legge 3 agosto 1998, no. 267: Conversione in legge, con modifi-cazioni, del decreto-legge 11 giugno 1998, n. 180, recante mis-ure urgenti per la prevenzione del rischio idrogeologico ed a fa-vore delle zone colpite da disastri franosi nella regione Campa-nia. Gazzetta Ufficiale n. 183 del 7 agosto 1998.
Pasuto, A., Silvano, S., and Tagliavini, F.: Evaluation of landslide hazard and risk in north-eastern Italy, Risk Analysis IV, C. A. Brebbia, pp. 221–233, 2004.
Varnes, D. J.: Landslide Hazard Zonation: a review of principles and practice. Commission on landslide of the IAEG UNESCO, Nat. Hazard, 3, 61 pp., 1984.
Zanchetta, G., Sulpizio, R., Pareschi, M. T., Leoni, F. M., and San-tacroce, R.: Characteristics of May 5-6, 1998 volcanoclastic de-bris flows in the Sarno area (Campania, southern Italy): rela-tionships to structural damage and hazard zonation, Journal of Volcanology and Geothermal Research, 133, 377–393, 2004.