HAL Id: inserm-00788132
https://www.hal.inserm.fr/inserm-00788132
Submitted on 13 Feb 2013HAL is a multi-disciplinary open access archive for the deposit and dissemination of sci-entific research documents, whether they are pub-lished or not. The documents may come from teaching and research institutions in France or abroad, or from public or private research centers.
L’archive ouverte pluridisciplinaire HAL, est destinée au dépôt et à la diffusion de documents scientifiques de niveau recherche, publiés ou non, émanant des établissements d’enseignement et de recherche français ou étrangers, des laboratoires publics ou privés.
Changes in cerebral blood flow and vasoreactivity to
CO(2) measured by Arterial Spin Labeling after 6 days
at 4,350 m.
Marjorie Villien, Pierre Bouzat, Thomas Rupp, Paul Robach, Laurent
Lamalle, Irène Troprès, François Estève, Alexandre Krainik, Patrick Lévy, Jan
Warnking, et al.
To cite this version:
Marjorie Villien, Pierre Bouzat, Thomas Rupp, Paul Robach, Laurent Lamalle, et al.. Changes in cerebral blood flow and vasoreactivity to CO(2) measured by Arterial Spin Labeling after 6 days at 4,350 m.. NeuroImage, Elsevier, 2013, epub ahead of print. �10.1016/j.neuroimage.2013.01.066�. �inserm-00788132�
Changes in cerebral blood flow and vasoreactivity to CO2 measured by Arterial Spin
Labeling after 6 days at 4,350 m
Marjorie Villien1,2, Pierre Bouzat1,2,3, Thomas Rupp4,5, Paul Robach4,5,6, Laurent Lamalle7,8,9,
Irène Troprès7,8,9, François Estève1,2,10, Alexandre Krainik1,2,10, Patrick Lévy4,5, Jan M.
Warnking1,2, and Samuel Verges4,5
1
U836, INSERM, Grenoble, France
2
Grenoble Institut des Neurosciences, Université Joseph Fourier, Grenoble, France
3
Pôle Anesthésie Réanimation, CHU de Grenoble, Grenoble, France
4
U1042, INSERM, Grenoble, France
5
Laboratoire HP2, Université Joseph Fourier, Grenoble, France
6
Ecole Nationale de Ski et d’Alpinisme, Chamonix, France
7
Plate-forme IRMaGe, Université Joseph Fourier, Grenoble, France
8
US 17, INSERM, Grenoble, France
9
UMS 3552, CNRS, Grenoble, France
10
Clinique Universitaire de Neuroradiologie et d’IRM, CHU Grenoble, Grenoble, France
Corresponding author:
Samuel Vergès, PhD
Laboratoire HP2 (INSERM U1042), Université Joseph Fourier
UF Recherche sur l'Exercice, CHU Grenoble, Hôpital Sud, Avenue Kimberley 38 434 Echirolles, France
sverges@chu-grenoble.fr
Tel: +33 4 76 76 68 60, Fax: +33 4 76 76 89 21
*7. Manuscript
ABSTRACT
Changes in cerebral perfusion and CO2 cerebrovascular reactivity during and immediately
after a sojourn at high altitude remain unclear but may be critical for acclimatization. The aim of the present study was to assess the effects of 6 days at 4,350 m on cerebral perfusion and cerebrovascular reactivity (CVR) to CO2 by arterial spin labeling (ASL) magnetic resonance
imaging at sea level and to compare it with transcranial Doppler (TCD) results at altitude. Eleven healthy male subjects, non-acclimatized to altitude, stayed for 6 days at 4,350 m (Observatoire Vallot, massif du Mont-Blanc). Prior to the stay and within 6 h after returning to sea level, subjects were investigated using pseudo-continuous ASL at 3 T during a block-design inhalation paradigm to measure basal cerebral blood flow (CBF) and CO2 CVR. End-tidal CO2 (PetCO2),
respiratory rate, heart rate and oxygen saturation were recorded during the exam. Subjects were also examined using TCD prior to and on day 5 of the stay at altitude to measure blood velocity in the middle cerebral artery (MCAv) and CO2 CVR. CO2 CVR was expressed as percent change
in ASL CBF or TCD MCAv per mmHg change in PetCO2. PetCO2 was significantly decreased
during and after altitude. Significant increases in TCD MCAv compared to before altitude measurements were observed on day 5 at altitude (+20.5 ± 15.5 %). Interestingly, ASL CBF remained increased in the MCA and anterior vascular territories (+22.0 ± 24.1 % and 20.5 ± 20.3 %, respectively) after altitude under normoxic conditions. TCD CVR tended to decrease on day 5 at 4,350 m (-12.3 ± 54.5 % in the MCA) while the ASL CVR was significantly decreased after altitude (-29.5 ± 19.8 % in the MCA). No correlation was observed between cerebral hemodynamic changes and symptoms of acute mountain sickness at high altitude. In conclusion, prolonged exposure to high altitude significantly increases blood flow during the altitude stay and within 6 h after returning to sea level. Decreased CO2 CVR after prolonged
altitude exposure was also observed using ASL. Changes in cerebral hemodynamics with altitude exposure probably involve other mechanisms than the vasodilatory effect of hypoxia only, since it persists under normoxia several hours following the descent.
Key words: hypoxia, cerebral perfusion, cerebrovascular reactivity, MRI, arterial spin labeling,
INTRODUCTION
Changes in cerebral blood flow (CBF) are observed during acclimatization to high altitude. The original report from Severinghaus et al. (1966) indicating an increase in CBF after several days at high altitude (3,810 m) compared to sea level was confirmed by subsequent studies (Chan et al., 2005; Fan et al., 2010; Huang et al., 1987; Lucas et al., 2011; Wolff, 2000). Others, however, failed to observe this change (Ainslie et al., 2008; Van Osta et al., 2005), probably due to differences in exposure duration and altitude levels as well as methodological considerations (see below). Increased CBF is believed to be a compensatory mechanism serving to maintain normal oxygen delivery to the brain under hypoxemic conditions. CBF changes at altitude mainly result from the opposite effects of reduced arterial oxygen (PaO2) and carbon
dioxide (PaCO2) partial pressures. Hypoxia is known to produce cerebral vasodilatation (at least
when reaching a certain threshold, i.e. PaO2< 50-60 mmHg) and a proportional increase in CBF
(Ainslie, 2004; Cohen et al., 1967). However, hypoxic exposure also provokes hyperventilatory-induced hypocapnia and subsequent cerebral vasoconstriction. Hence, Poulin et al. (2002) that 48 h of poikilocapnic normobaric hypoxic exposure (end tidal O2 partial pressure, PetO2 =
60 mmHg) induces a reduction in CBF predominantly due to hypocapnia since exposure to the same hypoxic stress but under isocapnia does not induce any change in CBF. After several days at high altitude, the initial increase in extracellular pH due to hyperventilation-induced hypocapnia is progressively compensated by a change in the concentration of HCO3- in extracellular and
cerebrospinal fluids, although cerebrospinal pH may still remain alkaline over several weeks at altitude (Brugniaux et al., 2007). Therefore, it remains to be determined how CBF is affected by a
sojourn of several days at high altitude, and the role of the opposing influences of reduced PaO2
and PaCO2 remains to be clarified.
In addition to the critical importance of changes in PaO2 and PaCO2, another factor that
determines CBF is the relative degree of cerebrovascular reactivity to circulating gases (CVR). Changes in CO2 CVR may be a key mechanism underlying ventilatory responses and
acclimatization to high altitude (Ainslie et al., 2007; Lucas et al., 2011). Controversial results have been published regarding changes in CO2 CVR following several days at high altitude, with
unchanged (Ainslie and Burgess, 2008; Ainslie et al., 2007; Jansen et al., 1999) reduced (Lucas et al., 2011) or increased (Fan et al., 2010; Jensen et al., 1990) responses. These contradictory results are probably due to methodological issues (e.g. rebreathing versus steady state protocols, hypoxic versus hyperoxic gas mixtures) and differences in altitude exposure (e.g. preliminary acclimatization or not, measurement during versus after high altitude exposure).
The large majority of studies performed in this area have used transcranial Doppler ultrasound (TCD) measurements to assess middle cerebral arterial blood flow velocity (MCAv), rather than absolute measurements of CBF. Hence, most of the conclusions regarding hypoxia-induced changes in CBF rely on the assumption that the MCA diameter remains unchanged in hypoxia, despite recent results suggesting that this may not be true (Wilson et al., 2011). Limitations due to movements and changes in insonation angle are also an issue with TCD measurements, in particular for between-day comparisons. Absolute CBF can be measured with an arterial spin labeling (ASL) magnetic resonance imaging (MRI) method that magnetically tags blood water and measures its delivery to tissue capillaries, to obtain a global or regional measure of tissue perfusion in ml blood·100 g tissue-1·min-1 (Aguirre and Detre, 2012). Only one group
(Smith et al., 2012) has assessed cerebral perfusion changes with ASL following two days at high altitude and reported an increase in whole-brain CBF in hypoxia compared to normoxia.
In the present study, we used ASL measurements to clarify the regional changes in CBF and CVR induced by a prolonged stay at high altitude and the relative impact of reduced PaO2
and PaCO2 on cerebral hemodynamics. CBF and CVR were measured at sea level with TCD and
ASL, on day 5 at 4,365 m of altitude with TCD, and on day 7 with ASL, 6 hours following return to sea level. Based on the current knowledge suggesting that in addition to the hypoxic vasodilator stimulus per se other mechanisms such as cerebral autoregulation, neuronal and endothelium-dependent pathways may influence CBF at altitude (Ainslie and Ogoh, 2010; Wilson et al., 2009), we hypothesized that CBF assessed by TCD would be increased on day 5 at 4,365 m and would remain elevated after return from high altitude when measured with ASL. This would confirm a contribution of mechanisms other than reduced PaO2 to the
altitude-induced CBF changes. We also hypothesized that reduced CO2 CVR would be associated with
MATERIAL & METHODS
Subjects
Eleven healthy male subjects (28 ± 8 years old) were recruited to participate to this study and provided written informed consent. Participants were recreational climbers, taking no medication and having no history of cardiovascular, cerebrovascular and respiratory diseases. They were unacclimatized to high altitude (no night above 1,500 m or sojourn above 2,500 m of altitude over the past 3 months) and received no treatment to prevent acute mountain sickness. The study was approved by the local institutional review board and performed according to the Declaration of Helsinki (registration number: RCB2011-A00071-40, ClinicalTrials.gov ID: NCT01565603).
Experimental design
Before ascending to high altitude, subjects underwent i) a complete MRI examination including anatomical MR images as well as baseline CBF and CVR measurement using ASL and ii) a TCD exam including CBF and CVR evaluation in Grenoble (212 m). On day 1, subjects underwent helicopter transport to be dropped within 10 min at 4,350 m of altitude (ObservatoireVallot, Mont Blanc, Chamonix, France) where they stayed for 6 days. The TCD exam was repeated on day 5 of high-altitude acclimatization. On day 7, subjects were transported back to Grenoble and underwent a second and similar complete MR examination within 6 hours after returning to sea level. Because 11 subjects could not have been evaluated simultaneously during and immediately after the altitude stay, the experiment was performed over 2 weeks, a subgroup of 5 or 6 subjects being exposed to high altitude and investigated according to the same protocol during each week.
MRI examination
Before and after the altitude stay, subjects were examined using functional and anatomical MRI acquisitions at 3T (Philips Achieva TX scanner, Best, Netherlands). Acquisitions, performed with a 32-channel head-only receive array, included a pseudo-continuous ASL (pCASL) sequence (Aslan et al., 2010; Dai et al., 2008) during a block-design inhalation paradigm to measure CVR to CO2 and basal CBF maps. Pseudo-continuous ASL acquisition parameters were: WET
pre-saturation, 1650 ms label, 1525 ms post-label delay, multi-slice single-shot EPI readout (3x3x6 mm3, 20 slices, TE 12 ms, sense-factor 2.5), TR of 4 s. A total of 180 control and tag
images were acquired in 12 min. An ASL reference scan and a T1 map were acquired for CBF
quantification and a T1 weighted morphological image was acquired as anatomical reference.
Capnia was modulated during the pCASL acquisition in a 1/2/1-min paradigm (3 cycles, see figure 1) by alternating medical air and an air/CO2 mixture (7% CO2, 21% O2, balance N2)
administered at 12 l·min-1 via a nonrebreathing mask with low-resistance check valves (Hudson
RCI Ref 41060, Teleflex, NC, USA). This protocol is used as a matter of routine for clinical research within our Lab and typically induces an increase in end-tidal CO2 partial pressure
(PetCO2) of about 10 mmHg. PetCO2 was measured via nasal cannula using an MR-compatible
capnometer (Maglife, Schiller medical), and recorded together with scanner triggers for synchronization in order to build a regressor representing the physiological response to hypercapnia for use in the data analysis (Figure 1). Breathing frequency, heart rate and arterial oxygen saturation (SpO2) were also recorded during the exam. Physiologic data acquired during
periods of medical air and air/CO2 were averaged separately in the analysis (ΔPetCO2 =
PetCO2Hypercapnia - PetCO2Ambiant air).
software (SPM, Wellcome Department of Imaging Neuroscience, http://www.fil.ion.ucl.ac.uk/spm/) and custom routines. Images were realigned after removing any systematic bias in realignment parameters between tag and control images. Frames exhibiting strong motion were marked for exclusion from the subsequent analysis. Structural images were segmented and all images were normalized to the template of the Montreal Neurological Institute (MNI) (Ashburner and Friston, 2005). ASL signal amplitude was scaled to express the difference between control and tag images in units of ml·100g-1·min-1. The ASL signal is dependent on
arterial blood T1 (T1a) and thus on hematocrit. Individual hematocrit values were measured before
altitude only (47 ± 3% on average; NPT7, Radiometer, Copenhagen, Denmark). The hematocrit level was previously observed to increase by 3.7% on average in the same conditions of altitude and exposure duration (Robach et al., 2002). Therefore, in the absolute quantification of CBF we assumed T1a to be 1602 ms prior to altitude exposure, corresponding to a mean hematocrit of
0.47, and T1a equal 1554 ms after altitude, corresponding to a mean hematocrit of 0.51 (Gevers et
al., 2012; Lu et al., 2004). Outliers in hypercapnia data were discarded and data were interpolated to the pCASL volume acquisition times, taking lag due to dead space in the sample line into account. Basal CBF was modeled with a regressor alternating between 0.5 and -0.5 for control and tag images respectively throughout the scan (Hernandez-Garcia et al., 2010; Mumford et al., 2006) (Figure 1). Hypercapnia-related perfusion increase (CVR) was modeled with a baseline-corrected capnia regressor (ctl/tag modulated for perfusion, unmodulated for BOLD) (Figure 1). CVR was expressed as percent change in perfusion per mmHg change in PetCO2.
The T1 weighted morphological images were segmented using SPM and for each scanning
session a ROI was defined including all voxels with a grey-matter fraction of at least 90%. For the perfusion analyses, this ROI was subdivided into vascular territories. The vascular territories were defined as those of the left and right middle cerebral arteries (MCA) and in the anterior
(ACA) and posterior (PCA) cerebral artery territories (Figure 2). The CVR analysis was based on the same ROIs, further constrained to voxels in which significant basal perfusion was detected (p<0.05, false discovery rate) and excluding outliers in the CVR measurement (Thompson, 1985). ROI-average response amplitudes were computed for the two sessions before and after the altitude stay.
TCD exam
TCD measurements were performed by a trained operator using two different methods:
- MCAv at rest was assessed using a 5 to 1 MHz Transducer CX-50 (Philips, Eindhoven, Netherlands). The clinoid process of the sphenoid bone and the brain stem were initially identified. Color-coded sonography allowed recognizing the circle of Willis. The M1 segment of the right MCA was identified and manual angle correction was applied to measure mean right MCAv (in cm·s-1) by the inbuilt software. This device was used to have a better reliability for
between-day comparisons of absolute TCD MCAv values at rest (Martin et al., 1995).
- A Doppler instrument operating at 2MHz (Wakie, Atys Medical, Soucieu en Jarrest,
France) was used to perform TCD measurements during the CVR protocol. This device could be used with a Doppler probe secured by a headband maintaining the same insonation position throughout the CVR protocol lasting for one hour. In all subjects, right middle cerebral artery was insonated through the transtemporal window at a depth of 50 to 60 mm. Mean right MCAv (in cm.s-1) were then acquired over each heartbeat during the entire experiment. MCAv during the
hypercapnic challenge was calculated as relative value, i.e. % change between the hypercapnic condition and the previous reference normoxic period (see below).
To assess TCD CVR, subjects inhaled gas mixtures with various inspiratory O2 (FiO2) and
a face mask and were blinded for the gas mixture composition. FiO2 and FiCO2 were adjusted to
reach the target values for PetO2 and PetCO2 according to the modified “Leiden proposal”
(Teppema and Dahan, 2010). The protocol consisted of six consecutive 10-min phases. In phases 1, 3 and 5, target PetO2 was 100 mmHg and FiCO2 was 0 (poikilocapnic normoxia). In phases 2,
4 and 6, target PetO2 was 55 mmHg (similar to the value observed at 4,350 m of altitude). Target
PetCO2 in phases 2, 4 and 6 was respectively 0, 5 and 12 mmHg above the value measured at the
end of phase 1. These three levels thus represent isocapnic hypoxia, hypercapnic hypoxia +5 mmHg and hypercapnic hypoxia +12 mmHg, respectively. PetO2 and PetCO2 were continuously
measured using an automated metabolic cart (Quark b2, Cosmed, Rome, Italy). MCAv was acquired continuously during the entire protocol and mean MCAv was averaged over the last minute of each period. Measurements corresponding to isocapnic hypoxia, hypercapnic hypoxia + 5 and + 12 mmHg phases were expressed as a percentage of the respective previous poikilocapnic normoxic periods and used to calculate the TCD CVR, i.e. the slope of the linear regression between relative MCAv values and PetCO2.
Clinical examination
Clinical examination included measurements of heart rate and non-invasive blood pressure (Dinamap, GE Medical Systems Inc., Milwaukee, WI) under resting conditions. SpO2
was measured using finger-pulse oxymetry (Biox 3740 Pulse Oximeter, Ohmeda, Louisville, CO) after 30 s of signal stabilization. Every morning at high altitude, subjects were also asked to complete self-reported questionnaires for acute mountain sickness (AMS) evaluation according to the Lake Louise Score (LLS, 5 items) (Roach et al., 1993) and the cerebral subscore of the Environmental Symptom Questionnaire (ESQ-III AMS-C, 11 items) (Sampson et al., 1983). The presence of AMS was defined as LLS > 3 and AMS-C ≥ 0.70.
Statistical analysis
Statistical analyses were performed using SPSSv18 on resting perfusion and CVR values obtained by ASL MRI and TCD. An ANOVA with repeated measures was first conducted to rule out a potential main effect of the hemispheric SIDE in the ASL MCA values. In absence of SIDE effect, right and left ASL MCA values were averaged. ANOVAs were further conducted to identify main effects of factor ROI (ACA, MCA, PCA), factor TIME (before and after altitude stay), and an interaction ROIxTIME. Pairwise comparisons were conducted using Wilcoxon rank tests. Correlations analyses were assessed using Spearman coefficient. All data are expressed as means ± standard deviation (SD). An omnibus significance threshold of p<0.05 was used.
RESULTS
Physiological and clinical data
Nine subjects presented AMS according the LLS score (peak LLS score during the altitude stay: 5.7 ± 2.5 points, on average), three of them had severe AMS with LLS > 6. AMS-C score indicated AMS in 6 subjects (peak AMS-C score during the altitude stay: 1.03 ± 0.87 points, on average).
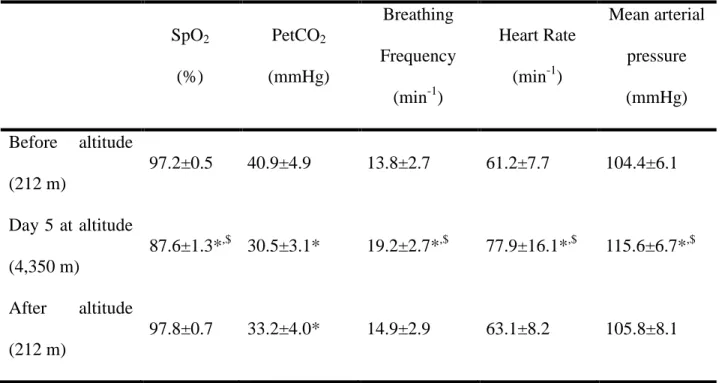
Physiological data measured prior to the altitude exposure, on day 5 at altitude and after the altitude stay are shown in Table 1. SpO2 was significantly lower on day 5 at altitude compared
to before and after the altitude stay. PetCO2 was significantly reduced on day 5 and after the
altitude stay compared to before. Breathing frequency, heart rate and arterial blood pressure had increased significantly by day 5 compared to before and after the altitude stay.
No adverse reaction was detected in subjects during the hypercapnic stimuli. During the ASL CVR assessment, the hypercapnic gas mixture increased PetCO2 similarly before
(+10.2 ± 3.6 mmHg compared to breathing air) and after (+11.0 ± 3.6 mmHg) the altitude stay. This increase in PetCO2 was also similar to the maximum hypercapnic stimulus imposed by the
TCD CVR protocol (i.e. +12 mmHg) .
MRI and TCD data
In the MRI analysis, datasets from 3 subjects were excluded due to excessive head motion (n=1), inappropriate hypercapnic stimulus (n=1) and a technical problem (n=1), leaving 9 subjects for the ASL CBF study, and 8 subjects for the ASL CVR study. In TCD, all TCD MCAv datasets were available at rest, and one TCD CVR dataset was missing due to a technical problem, leaving 10 subjects to study TCD CVR.
Cerebral perfusion
ASL MRI. The delay between the helicopter descent and the MRI exam after the altitude stay
was 6 h 30 min ± 2 h 10 min on average. Because no effect of the hemispheric side was detected, right and left MCA values were averaged. The ANOVA showed main effects of TIME (p=0.02) and ROI (p<0.01), without interaction TIMExROI. The main effect of TIME was due to significant ASL CBF increase in MCA and ACA territories (Figure 3) after altitude exposure. Increased CBF was observed in all subjects in the MCA territory (Figure 4a). Group-average ASL CBF increased by 22.0 ± 24.1 % in the MCA territory, by 20.5 ± 20.3 % in the ACA territory, and by 14.8 ± 18.4 % in the PCA territory. The main effect of ROI was due to higher CBF values in ACA compared to MCA and PCA (Figure 3).
TCD. TCD MCAv increased significantly by 20.5 ± 15.5 % on day 5 at 4,350 m (Figure 4b).
An increase in TCD MCAv was observed in all subjects but one.
No correlation between altitude-induced changes in TCD MCAv and ASL CBF was detected. No correlation was observed between AMS scores and altitude-induced changes in TCD MCAv or ASL CBF.
Cerebrovascular reactivity
ASL MRI. The ANOVA for ASL CVR showed a main effect of TIME (p=0.01) and a trend for
ROI (p=0.06) without interaction TIMExROI. The main effect of TIME was due to significant ASL CVR decrease in all territories (Figure 5). This result was observed in all subjects in the MCA territory (Figure 6a). To note, most of the variance of the ROI factor was due to a lower
reactivity in the MCA compared to ACA and PCA territories. No significant correlation was detected between altitude-induced ASL CBF and ASL CVR changes (Spearman ρ=-0.52, p=0.18).
TCD. TCD CVR was not significantly reduced (p=0.10) from before the altitude stay to day 5
at 4,350 m (5.2 ± 2.0 and 3.9 ± 1.2 %∙mmHg-1, respectively; Figure 6b). A negative correlation
between altitude-induced TCD CVR and TCD MCAv changes was detected (Spearman ρ = 0.64; p<0.05).
Significant correlation between changes in TCD CVR and changes in ASL CVR was detected (Spearman ρ = 0.86; p<0.01). No correlation was observed between AMS scores during the altitude stay and changes in ASL or TCD CVR.
DISCUSSION
MCAv measured by TCD at 4,350 m on day 5 suggested an increase in CBF at altitude, in agreement with previous findings. Importantly, quantitative CBF measurements using ASL MRI showed that this perfusion increase persisted immediately after descent to sea level, under normoxic conditions. Cerebrovascular reactivity to CO2 measured by ASL concomitantly
decreased in all vascular territories. CO2 CVR measured by TCD did not change significantly,
although slightly lower values were observed at altitude compared to before altitude. Despite regional differences in amplitude, ASL changes were similar across vascular territories. No relationship was found between changes in cerebral hemodynamics and the severity of AMS during the altitude stay.
To our knowledge, this is the first study quantifying CBF and CVR before and immediately after prolonged high-altitude exposure using ASL. The majority of previous studies having investigated cerebral hemodynamic changes at high altitude used TCD, mostly because this method is relatively easy to carry and use at altitude. TCD is however a manipulator-dependent technique with poor between-day reproducibility (McMahon et al., 2007). Moreover, while this technique relies on constant MCA diameter, recent data suggest that MCA diameter may be increased at high altitude (Wilson et al., 2011). Because 2D transcranial color-coded sonography enables precise identification of the M1 segment of the right MCA and correction for the angle of insonation when determining blood flow velocities (Martin et al., 1995), this technique was used in the present study to measure basal MCAv before and during the altitude stay. Compared to TCD, ASL has the advantage to measure perfusion in absolute units and its resolution and spatial coverage allows the quantification of CBF and CVR regionally. Moreover, ASL reflects the
microcirculation in the tissue whereas TCD is a direct measurement of the velocity in the macro-circulation, usually in the MCA. ASL is not easily performed at high altitude, but the present results demonstrate its usefulness to study CBF immediately after altitude exposure to better characterize changes in cerebral hemodynamics associated with prolonged hypoxic exposure.
Only one group has measured CBF by ASL within the context of AMS and reported increased CBF after 30 min of normobaric hypoxia (Dyer et al., 2008) or 2 days at 3,800 m (Smith et al., 2012), this increase being similar in subjects with or without AMS. Such hypoxic exposures are however different from more prolonged and severe hypoxia as encountered during high-altitude stay. In the present study, ASL demonstrated a significant and widespread increase in CBF after 6 days at high altitude that was larger compared to acute normobaric hypoxic exposure (Dyer et al., 2008) but similar to the CBF increase following 2 days at lower altitude (Smith et al., 2012).
Various mechanisms can cause a change in perfusion during or immediately after a high-altitude stay. Hypoxia-induced hyperventilation reduces arterial CO2 and therefore potentially
induces cerebral vasoconstriction and reduced CBF. The large effect of hyperventilation on arterial CO2 is shown in the present study by the reduced PetCO2 values on day 5 and
immediately after the altitude stay (Table 1). After several days at altitude however, the initial increase in cerebrospinal pH and consequently its vasoconstrictive effect is thought to be partly compensated (Brugniaux et al., 2007). Although we did not measure blood or cerebrospinal pH, the present results indicate that despite the potential effect of still alkaline pH, MCAv on day 5 at altitude was clearly elevated compared to sea level. After returning to sea level on day 7, subjects were still hypocapnic, although slightly less than on day 5 at altitude, and CBF remained elevated. In order to assess whether the enhanced CBF on day 7 at sea level was the consequence of a slightly increased arterial CO2 compared to the acido-basic balance reached at altitude (i.e.
compared to the PetCO2 observed on day 5 at altitude), we can extrapolate the CBF that would
have been obtained on day 7 at the same level of capnia as was observed at altitude (on day 5), based on the measured ASL CVR. The correction for the slight difference in capnia between the two conditions only accounts for about 30% of the perfusion increase observed between the MRI exams before and after the altitude stay (results not shown). Hence, most of the increase in CBF measured immediately after altitude by ASL compared to before altitude cannot be explained by slightly reduced ventilation and reduced hypocapnia compared to the levels obtained after several days at altitude.
A significant reduction in CO2 CVR measured by ASL immediately after the altitude stay and
a similar tendency measured by TCD at altitude suggest that vasoreactivity was impaired as a consequence of altitude exposure. Similar results were recently reported by Lucas et al. (2011) using TCD and a steady-state hypercapnic protocol after several days at 5050 m. Lower CO2
CVR has been reported in the hypocapnic compared to the hypercapnic range (Ide et al., 2003). Hence, the reduction in CO2 CVR associated with altitude exposure in the present study could be
a consequence of the reduction in baseline arterial CO2 (Table 1). CVR is dependent on arterial
CO2 through the relationship between arterial CO2 and pH. As stated above, after several days at
high altitude, this relationship is modified and consequently arterial CO2 remains reduced while
pH progressively decreases toward normal values (Brugniaux et al., 2007). Hence, although we cannot exclude a potential effect of still alkaline pH on CO2 CVR, the CVR reduction observed in
the present study after several days at high altitude is likely due to additional mechanisms. Such a reduction in CO2 CVR may underlie the enhanced hypercapnic ventilatory response observed at
high altitude which is a critical aspect of ventilatory acclimatization (Lucas et al., 2011; Xie et al., 2006). Reduced CO2 CVR at high altitude can affect the ventilatory response during various
apnea for instance (Ainslie and Duffin, 2009). A correlation was detected between the increase in basal perfusion and the reduction in CO2 CVR on day 5 with TCD but not after the altitude stay
with ASL. Hence, while the mechanisms underlying alterations in cerebrovascular reactivity at altitude remain to be clarified (Ainslie and Ogoh, 2010), the inconsistent correlation between perfusion and CVR changes suggests that both phenomena may not share similar underlying mechanisms and that changes in CBF associated with altitude may be due to other factors than alterations in CO2 vasoreactivity.
It has also been shown that a significant (albeit relatively small, 3.7% on average) hematocrit increase is observed following a similar altitude stay (Robach et al., 2002). This change in hematocrit could have an effect on the ASL signal (Gevers et al., 2012; Silvennoinen et al., 2003), since a larger hematocrit leads to a decrease of the longitudinal relaxation time of the arterial blood, reducing the perfusion signal measured by ASL. To prevent this from affecting our measurements, we calculated the CBF after the altitude stay by taking into account the average increase in hematocrit observed by Robach et al. (2002) under similar conditions. We also acquired a tissue T1 map, which was used in the CBF quantification. We did not observe any
significant difference in grey matter tissue T1 before and after altitude, suggesting that any blood
relaxation time changes were not sufficient to affect overall tissue relaxation times, likely due to both the small blood volume fraction and the small amplitude of blood T1 changes. Therefore, the
changes in CBF and CVR measured by ASL were likely not the consequence of the specific effect of changes in hematocrit level on the ASL signal. As suggested by Møller et al. (2002), changes in CBF after prolonged high altitude exposure are the result of two opposite forces, one acting to increase flow because of the persistent low arterial oxygen tension, and the other acting to decrease flow as a consequence of the increased hematocrit. The increase in MCAv and ASL CBF measured in the present study indicates that the mechanisms increasing CBF following
prolonged hypoxic exposure clearly outweigh the opposing effect of the slightly increased hematocrit on blood velocity.
A significant increase in arterial blood pressure was observed on day 5 at 4,350 m, while similar values were observed before and after the altitude stay. Some studies have shown that cerebral autoregulation (i.e. the rapid response of the cerebral vessels to changes in mean arterial pressure in order to keep CBF within physiologically tolerable levels) is impaired at altitude (Ainslie et al., 2007; Jansen et al., 2000), especially in the presence of AMS (Bailey et al., 2009; Van Osta et al., 2005), and therefore some changes in blood pressure as observed in the present study may affect CBF. Although we cannot rule out this hypothesis which requires further investigations, the fact that CBF remained enhanced immediately after altitude while blood pressure and heart rate had returned to values similar to before the altitude stay suggests that changes in central hemodynamics and cerebral autoregulation may not be the main reasons for altitude-induced changes in cerebral perfusion. Furthermore, changes in cerebral autoregulation are not thought to be a critical factor underlying changes in CBF at altitude under resting conditions (Brugniaux et al., 2007).
Angiogenesis can occur after several days or weeks at altitude (Xu and LaManna, 2006) and could influence the CBF measured by ASL post altitude in our protocol. This phenomenon is probably still at its very early stage at the end of the altitude stay in the present study. In order to assess the contribution of angiogenesis to the increase in CBF observed here, imaging absolute CBV, vessel size and vessel density could provide additional information (Jensen et al., 2006; Troprès et al., 2001). Angiogenesis may also be characterized in vivo by dosing blood biomarkers such as VEGF and its soluble receptors (Batchelor et al., 2007), though this approach is not specific to the brain.
the increase in CBF at high altitude and we speculated that the increased CBF at altitude (as suggested by the TCD measurement on day 5 at altitude) would persist after the subjects came back to sea level, i.e. when the hypoxic stimulus would not be present anymore. In accordance with this hypothesis, the ASL measurements showed that CBF was increased after the altitude stay to a similar extent than TCD MCAv at altitude. This confirms that, in addition to the hypoxic vasodilator stimulus per se, additional mechanisms such as angiogenesis, stimulation of neuronal pathways or release of circulating and endothelium-derived vasoactive stimuli (Ainslie and Ogoh, 2010) may significantly contribute to the larger CBF observed at altitude.
While the increase in CBF serves to maintain oxygen delivery to the brain under hypoxic conditions, its role regarding altitude acclimatization remains debated. In the present study and in accordance with recent results (Dyer et al., 2008; Smith et al., 2012; Subudhi et al., 2011), no relationship was observed between the severity of AMS symptoms at altitude and changes in CBF. Similarly, no correlation was observed between changes in CO2 CVR and AMS symptoms.
Hence, even though it has been shown by our group and others that ventilatory and cerebrovascular responses to CO2 are critical for high altitude acclimatization (Jansen et al.,
1999; Lucas et al., 2011; Nespoulet et al., 2012), we could not confirm a link between cerebral hemodynamics and the development of AMS in the present study. Further studies are needed to investigate the potential impact of changes in cerebral hemodynamics at high altitude on sleep or exercise responses for instance.
One limitation of the present study is the small sample size, due to the complexity of the logistics of an experimental protocol at high altitude combined with MRI investigations. However, the observed changes in perfusion and CVR as assessed by MRI between pre- and post-altitude sessions were clear already with this sample size and we believe that the present study provides data contributing significantly to our understanding of hemodynamic changes
associated with prolonged hypoxic exposure. Also, the slightly different protocols used to assess CO2 vasoreactivity with ASL and TCD (in particular normoxic conditions for ASL and hypoxic
conditions for TCD measurements) and difference in test scheduling (TCD CVR was measured on day 5 at altitude while ASL CVR was measured on day 7 at sea level) may affect the comparisons of CVR obtained by TCD and ASL. Because the aim of this study was to investigate changes in cerebral hemodynamics at altitude and to compare them to measurements at sea level immediately after the altitude stay, TCD measurements were performed on day 5 (days 6 and 7 at altitude were impossible due to logistical considerations) rather than on day 7 when ASL investigations were conducted. However, since altitude-induced CVR changes obtained with both techniques were significantly correlated, we believe these results indicate a consistent reduction in CO2 vasoreactivity.
This study is the first to measure cerebral perfusion and vasoreactivity with ASL after a prolonged stay at high altitude. We demonstrated that prolonged exposure to high altitude significantly increases CBF and decreases vasoreactivity to CO2 measured in normoxia several
hours following return to sea level. Hence, these changes in cerebral hemodynamics after several days at high altitude are not only the consequences of the vasodilating effect of hypoxia but probably involve other mechanisms such as changes in cerebral autoregulation and angiogenesis. Further investigations are needed to explore these mechanisms and to determine the role of cerebral hemodynamic changes for acclimatization to high altitude.
Acknowledgments
We thank all the subjects for participating to this study, the SMTEC company for providing the gas mixing device, Philips and Atys Medical for providing the TCD devices, the Rhône-Alpes
Region for financial support, Prof. Le Bas, the CNRS and the ENSA for supporting the VALLOT 2011 project.
Bibliography
Aguirre, G.K., Detre, J.A., 2012. The development and future of perfusion fMRI for dynamic imaging of human brain activity. NeuroImage 62, 1279–1285.
Ainslie, P.N., 2004. Ventilatory, cerebrovascular, and cardiovascular interactions in acute hypoxia: regulation by carbon dioxide. Journal of Applied Physiology 97, 149–159. Ainslie, P.N., Burgess, K., Subedi, P., Burgess, K.R., 2007. Alterations in cerebral dynamics at
high altitude following partial acclimatization in humans: wakefulness and sleep. Journal of Applied Physiology 102, 658–664.
Ainslie, P.N., Burgess, K.R., 2008. Cardiorespiratory and cerebrovascular responses to hyperoxic and hypoxic rebreathing: effects of acclimatization to high altitude. Respir Physiol
Neurobiol 161, 201–209.
Ainslie, P.N., Celi, L., McGrattan, K., Peebles, K., Ogoh, S., 2008. Dynamic cerebral
autoregulation and baroreflex sensitivity during modest and severe step changes in arterial PCO2. Brain Res 1230, 115–124.
Ainslie, P.N., Duffin, J., 2009. Integration of cerebrovascular CO2 reactivity and chemoreflex control of breathing: mechanisms of regulation, measurement, and interpretation. AJP: Regulatory, Integrative and Comparative Physiology 296, R1473–R1495.
Ainslie, P.N., Ogoh, S., 2010. Regulation of cerebral blood flow in mammals during chronic hypoxia: a matter of balance. Experimental Physiology 95, 251 –262.
Ashburner, J., Friston, K.J., 2005. Unified segmentation. NeuroImage 26, 839–851.
Aslan, S., Xu, F., Wang, P.L., Uh, J., Yezhuvath, U.S., Osch, M. van, Lu, H., 2010. Estimation of labeling efficiency in pseudocontinuous arterial spin labeling. Magn Reson Med 63, 765– 771.
Bailey, D.M., Evans, K.A., James, P.E., McEneny, J., Young, I.S., Fall, L., Gutowski, M., Kewley, E., McCord, J.M., Møller, K., Ainslie, P.N., 2009. Altered free radical
metabolism in acute mountain sickness: implications for dynamic cerebral autoregulation and blood-brain barrier function. J Physiol 587, 73–85.
Batchelor, T.T., Sorensen, A.G., Di Tomaso, E., Zhang, W.-T., Duda, D.G., Cohen, K.S., Kozak, K.R., Cahill, D.P., Chen, P.-J., Zhu, M., Ancukiewicz, M., Mrugala, M.M., Plotkin, S., Drappatz, J., Louis, D.N., Ivy, P., Scadden, D.T., Benner, T., Loeffler, J.S., Wen, P.Y., Jain, R.K., 2007. AZD2171, a pan-VEGF receptor tyrosine kinase inhibitor, normalizes tumor vasculature and alleviates edema in glioblastoma patients. Cancer Cell 11, 83–95. Brugniaux, J.V., Hodges, A.N.H., Hanly, P.J., Poulin, M.J., 2007. Cerebrovascular responses to
altitude. Respir Physiol Neurobiol 158, 212–223.
Chan, C.W.M., Hoar, H., Pattinson, K., Bradwell, A.R., Wright, A.D., Imray, C.H.E., 2005. Effect of sildenafil and acclimatization on cerebral oxygenation at altitude. Clinical Science 109, 319.
Cohen, P.J., Alexander, S.C., Smith, T.C., Reivich, M., Wollman, H., 1967. Effects of hypoxia and normocarbia on cerebral blood flow and metabolism in conscious man. J Appl Physiol 23, 183–189.
Dai, W., Carmichael, O.T., Lopez, O.L., Becker, J.T., Kuller, L.H., Gach, H.M., 2008. Effects of image normalization on the statistical analysis of perfusion MRI in elderly brains. J Magn Reson Imaging 28, 1351–1360.
Dyer, E.A.W., Hopkins, S.R., Perthen, J.E., Buxton, R.B., Dubowitz, D.J., 2008. Regional cerebral blood flow during acute hypoxia in individuals susceptible to acute mountain sickness. Respir Physiol Neurobiol 160, 267–276.
Fan, J.-L., Burgess, K.R., Basnyat, R., Thomas, K.N., Peebles, K.C., Lucas, S.J.E., Lucas, R.A.I., Donnelly, J., Cotter, J.D., Ainslie, P.N., 2010. Influence of high altitude on
cerebrovascular and ventilatory responsiveness to CO2. J. Physiol. (Lond.) 588, 539–549. Gevers, S., Nederveen, A.J., Fijnvandraat, K., Van den Berg, S.M., Van Ooij, P., Heijtel, D.F.,
Heijboer, H., Nederkoorn, P.J., Engelen, M., Van Osch, M.J., Majoie, C.B., 2012. Arterial spin labeling measurement of cerebral perfusion in children with sickle cell disease. Journal of Magnetic Resonance Imaging 35, 779–787.
Hernandez-Garcia, L., Jahanian, H., Rowe, D.B., 2010. Quantitative analysis of arterial spin labeling FMRI data using a general linear model. Magn Reson Imaging 28, 919–927. Huang, S.Y., Moore, L.G., McCullough, R.E., McCullough, R.G., Micco, A.J., Fulco, C.,
Cymerman, A., Manco-Johnson, M., Weil, J.V., Reeves, J.T., 1987. Internal carotid and vertebral arterial flow velocity in men at high altitude. J. Appl. Physiol. 63, 395–400. Ide, K., Eliasziw, M., Poulin, M.J., 2003. Relationship between middle cerebral artery blood velocity and end-tidal PCO2 in the hypocapnic-hypercapnic range in humans. J. Appl. Physiol. 95, 129–137.
Jansen, G.F., Krins, A., Basnyat, B., 1999. Cerebral vasomotor reactivity at high altitude in humans. J. Appl. Physiol. 86, 681–686.
Jansen, G.F., Krins, A., Basnyat, B., Bosch, A., Odoom, J.A., 2000. Cerebral autoregulation in subjects adapted and not adapted to high altitude. Stroke 31, 2314–2318.
Jensen, J.B., Wright, A.D., Lassen, N.A., Harvey, T.C., Winterborn, M.H., Raichle, M.E., Bradwell, A.R., 1990. Cerebral blood flow in acute mountain sickness. J. Appl. Physiol. 69, 430–433.
Jensen, J.H., Lu, H., Inglese, M., 2006. Microvessel density estimation in the human brain by means of dynamic contrast-enhanced echo-planar imaging. Magn Reson Med 56, 1145– 1150.
Lu, H., Clingman, C., Golay, X., Van Zijl, P.C.M., 2004. Determining the longitudinal relaxation time (T1) of blood at 3.0 Tesla. Magnetic Resonance in Medicine 52, 679–682.
Lucas, S.J.E., Burgess, K.R., Thomas, K.N., Donnelly, J., Peebles, K.C., Lucas, R.A.I., Fan, J.-L., Cotter, J.D., Basnyat, R., Ainslie, P.N., 2011. Alterations in cerebral blood flow and cerebrovascular reactivity during 14 days at 5050 m. J. Physiol. (Lond.) 589, 741–753. Martin, P.J., Evans, D.H., Naylor, A.R., 1995. Measurement of blood flow velocity in the basal
cerebral circulation: advantages of transcranial color-coded sonography over conventional transcranial Doppler. J Clin Ultrasound 23, 21–26.
McMahon, C.J., Mcdermott, P., Horsfall, D., Selvarajah, J.R., King, A.T., Vail, A., 2007. The reproducibility of transcranial Doppler middle cerebral artery velocity measurements: Implications for clinical practice. British Journal of Neurosurgery 21, 21–27.
Møller, K., Paulson, O.B., Hornbein, T.F., Colier, W.N.J.M., Paulson, A.S., Roach, R.C., Holm, S., Knudsen, G.M., 2002. Unchanged cerebral blood flow and oxidative metabolism after acclimatization to high altitude. J. Cereb. Blood Flow Metab. 22, 118–126.
Mumford, J.A., Hernandez-Garcia, L., Lee, G.R., Nichols, T.E., 2006. Estimation efficiency and statistical power in arterial spin labeling fMRI. Neuroimage 33, 103–114.
Nespoulet, H., Wuyam, B., Tamisier, R., Saunier, C., Monneret, D., Remy, J., Chabre, O., Pépin, J.-L., Lévy, P., 2012. Altitude illness is related to low hypoxic chemoresponse and low oxygenation during sleep. Eur. Respir. J. 40, 673–680.
Poulin, M.J., Fatemian, M., Tansley, J.G., O’Connor, D.F., Robbins, P.A., 2002. Changes in cerebral blood flow during and after 48 h of both isocapnic and poikilocapnic hypoxia in humans. Experimental physiology 87, 633–642.
Roach, R., Bartsch, P., Hackett, P., Oelz, O., 1993. The lake louise acute mountain sickness scoring system, in: Hypoxia and Molecular Medicine. pp. 272–274.
Robach, P., Lafforgue, E., Olsen, N.V., Déchaux, M., Fouqueray, B., Westerterp-Plantenga, M., Westerterp, K., Richalet, J.-P., 2002. Recovery of plasma volume after 1 week of
exposure at 4,350 m. Pflugers Arch. 444, 821–828.
Sampson, J.B., Cymerman, A., Burse, R.L., Maher, J.T., Rock, P.B., 1983. Procedures for the measurement of acute mountain sickness. Aviat Space Environ Med 54, 1063–1073. Severinghaus, J.W., Chiodi, H., Eger, E.I., 2nd, Brandstater, B., Hornbein, T.F., 1966. Cerebral
blood flow in man at high altitude. Role of cerebrospinal fluid pH in normalization of flow in chronic hypocapnia. Circ. Res. 19, 274–282.
Silvennoinen, M.J., Kettunen, M.I., Kauppinen, R.A., 2003. Effects of hematocrit and oxygen saturation level on blood spin-lattice relaxation. Magnetic Resonance in Medicine 49, 568–571.
Smith, Z.M., Krizay, E., Guo, J., Shin, D.D., Scadeng, M., Dubowitz, D.J., 2012. Sustained high-altitude hypoxia increases cerebral oxygen metabolism. J. Appl. Physiol.
Subudhi, A.W., Dimmen, A.C., Julian, C.G., Wilson, M.J., Panerai, R.B., Roach, R.C., 2011. Effects of acetazolamide and dexamethasone on cerebral hemodynamics in hypoxia. Journal of Applied Physiology 110, 1219–1225.
Teppema, L.J., Dahan, A., 2010. The Ventilatory Response to Hypoxia in Mammals: Mechanisms, Measurement, and Analysis. Physiological Reviews 90, 675–754. Thompson, R., 1985. A note on restricted maximum likelihood estimation with an alternative
outlier model. Journal of the Royal Statistical Society. Series B. Methodological 47, 53– 55.
Troprès, I., Grimault, S., Vaeth, A., Grillon, E., Julien, C., Payen, J.F., Lamalle, L., Décorps, M., 2001. Vessel size imaging. Magn Reson Med 45, 397–408.
Van Osta, A., Moraine, J.-J., Melot, C., Mairbaurl, H., Maggiorini, M., Naeije, R., 2005. Effects of High Altitude Exposure on Cerebral Hemodynamics in Normal Subjects. Stroke 36, 557–560.
Wilson, M.H., Edsell, M.E.G., Davagnanam, I., Hirani, S.P., Martin, D.S., Levett, D.Z.H., Thornton, J.S., Golay, X., Strycharczuk, L., Newman, S.P., Montgomery, H.E., Grocott, M.P.W., Imray, C.H.E., 2011. Cerebral artery dilatation maintains cerebral oxygenation at extreme altitude and in acute hypoxia--an ultrasound and MRI study. J. Cereb. Blood Flow Metab 31, 2019–2029.
Wilson, M.H., Newman, S., Imray, C.H., 2009. The cerebral effects of ascent to high altitudes. The Lancet Neurology 8, 175–191.
Wolff, C.B., 2000. Cerebral blood flow and oxygen delivery at high altitude. High Alt. Med. Biol. 1, 33–38.
Xie, A., Skatrud, J.B., Morgan, B., Chenuel, B., Khayat, R., Reichmuth, K., Lin, J., Dempsey, J.A., 2006. Influence of cerebrovascular function on the hypercapnic ventilatory response in healthy humans. J. Physiol. (Lond.) 577, 319–329.
Xu, K., LaManna, J.C., 2006. Chronic Hypoxia and the Cerebral Circulation. J Appl Physiol 100, 725–730.
Tables and Figures
Table 1. Physiological parameters. Physiological parameters (Mean ± SD) before the altitude
stay, on day 5 at 4,350 m, and after the altitude stay.
SpO2 (%) PetCO2 (mmHg) Breathing Frequency (min-1) Heart Rate (min-1) Mean arterial pressure (mmHg) Before altitude (212 m) 97.2±0.5 40.9±4.9 13.8±2.7 61.2±7.7 104.4±6.1 Day 5 at altitude (4,350 m) 87.6±1.3*,$ 30.5±3.1* 19.2±2.7*,$ 77.9±16.1*,$ 115.6±6.7*,$ After altitude (212 m) 97.8±0.7 33.2±4.0* 14.9±2.9 63.1±8.2 105.8±8.1
Figure 1. Vasoreactivity ASL design matrix for one representative subject. The first regressor
represents the average baseline MR signal. The second regressor represents the baseline ASL signal of alternating sign in control and tag images. The third regressor describes the perfusion changes during 1 min/2 min/1 min paradigm alternating air and air enriched in CO2. The fourth
regressor represents the BOLD signal changes during the vasoreactivity experiment. The last 2 regressors are calculated using the end-tidal CO2 measured during the experiment.
Figure 2. MRI images of cerebral blood flow and ROIs. a) Cerebral blood flow map of one
subject for 6 slices from the cerebellum to the superior parietal and frontal regions. The color bar indicates the quantitative blood flow measured by ASL in ml∙100g-1∙min-1. b) Superposition of the normalized anatomical image of the same subject with vascular territories (Blue: middle cerebral artery (MCA), Green: posterior cerebral artery (PCA), Red: anterior cerebral artery (ACA)).
Figure 3. Cerebral perfusion before and after the altitude stay in vascular territories
measured with ASL. (* p<0.05).
Figure 4. Cerebral perfusion in the middle cerebral artery (MCA) territory. a) Individual
and group mean cerebral perfusion measured by ASL in ml.100g-1.min-1 in the grey matter of the
MCA territory before and after the altitude stay increased in all subjects (* p<0.05). b) Individual and group mean blood velocity measured by 2D TCD in cm.s-1 in the right MCA before the
altitude stay and on day 5 at 4,350 m increased in 10 subjects out of 11 (* p<0.05).
Figure 5. Cerebrovascular reactivity (CVR) before and after the altitude stay in vascular
territories measured by ASL. The mean decrease of CVR in the middle cerebral artery (MCA)
territory was -29.5 ± 19.8 %, -26.9 ± 24.1 % in the anterior (ACA) territory, and -23.8 ± 23.2 % in the posterior (PCA) territory (* p<0.05).
Figure 6. Cerebrovascular reactivity (CVR) in middle cerebral artery (MCA) territory. a)
Individual and group mean CVR measured by ASL in the grey matter of the MCA territory before and after the altitude stay was decreased in 8 subjects out of 9. b) Individual and group mean
CVR measured by TCD in the right MCA before the altitude stay and on day 5 at 4,350 m was decreased in 7 subjects out of 10, but this change did not reach significance at the group level.
Figure1
Figure2
Figure3
Figure4
Figure5
Figure6