READ THESE TERMS AND CONDITIONS CAREFULLY BEFORE USING THIS WEBSITE. https://nrc-publications.canada.ca/eng/copyright
Vous avez des questions? Nous pouvons vous aider. Pour communiquer directement avec un auteur, consultez la première page de la revue dans laquelle son article a été publié afin de trouver ses coordonnées. Si vous n’arrivez pas à les repérer, communiquez avec nous à PublicationsArchive-ArchivesPublications@nrc-cnrc.gc.ca.
Questions? Contact the NRC Publications Archive team at
PublicationsArchive-ArchivesPublications@nrc-cnrc.gc.ca. If you wish to email the authors directly, please see the first page of the publication for their contact information.
NRC Publications Archive
Archives des publications du CNRC
This publication could be one of several versions: author’s original, accepted manuscript or the publisher’s version. / La version de cette publication peut être l’une des suivantes : la version prépublication de l’auteur, la version acceptée du manuscrit ou la version de l’éditeur.
Access and use of this website and the material on it are subject to the Terms and Conditions set forth at
A review of test methods for alkali-expansivity of concrete aggregates
Grattan-Bellew, P. E.
https://publications-cnrc.canada.ca/fra/droits
L’accès à ce site Web et l’utilisation de son contenu sont assujettis aux conditions présentées dans le site LISEZ CES CONDITIONS ATTENTIVEMENT AVANT D’UTILISER CE SITE WEB.
NRC Publications Record / Notice d'Archives des publications de CNRC:
https://nrc-publications.canada.ca/eng/view/object/?id=696ce302-8d0c-4c3f-9095-f84517ff9221
https://publications-cnrc.canada.ca/fra/voir/objet/?id=696ce302-8d0c-4c3f-9095-f84517ff9221
S e r
TH1
N21d
no.
990
c .
2
National Research
Conseil national
I
*
Council Canada
de recherches Canada
A
REVIEW OF TEST METHODS FOR
ALKALI EXPANSIVlTY OF CONCRETE AGGREGATES
by
P.E.
Grattan-Bellew
Reprinted from
Proceedings, Conference on alkali-aggregate
reaction in concrete
Cape Town, South Africa
30 March 3 April 1981
DBR Paper No. 990
Division of Building Research
On essaie de d6terminer quelle serait la meilleure m6thode expgrimentale, pour 6valuer la rgaction alcali-agr6gat potentielle de m6langes de ciment et d'agrsgats. Afin de surmonter les difficult6s qu'ont rencontr6es divers auteurs en voulant comparer des r6sultats obtenus pendant des pEriodes d'essai variables, on propose et on Pvalue une nouvelle m6thode d'sdition des donnSes venant des mesures d'expansion d'un barreau de mortier, d'un prisme de bEton et d'un cylindre de roche. Cette msthode consiste 5 dEterminer la vitesse d'expansion, en traGant un graphique du pourcentage d'expansion en fonction de la racine carr6e du temps. On a repris et report6 sur un graphique les nombreuses donn6es venant de la documentation scientifique et des r6sultats non publies par l'auteur, pour d6terminer les vitesses de dilatation. '
A
partir de ces donnGes, on emploie diverses m6thodes exp6rimentales pour d6terminer les vitesses critiques d'expansion qui permettraient de distinguer les agr6gats normalement expansifs des agr6gats trop expansifs.
ALKALI
A~REGATIREAC
(1
-
1-I
ALKALI
-
AGGREGAATREAKSIE
S252
ANALYZED
A
REMEW
OF
TEST
METHODS FOR
ALKALI-E)(PANSIVITY
OF CONCRETE
AGGREGATES
by Dr
P E Grattan-Bellew*
SYNOPSIS
The
aim
of these test procedures is the prediction of the performance of a given cement-aggregate combination
in a particular environment. The problem of identifying potentially expansive rock types is complicated by the
fact that, in some cases, the reactive component of the rock is of secondary origin and that there are several
types of alkali-aggregate reaction, each with its own characteristics and reaction rate.
SAMEVATTING
Die mikpunt met hierdie toetsprosedures is die voorspelling van die gedrag van 'n bepaalde sement-
aggregaatkombinasie in 'n besondere omgewing. Die probleem om potensieel uitsetbare rotstipes te identifiseer
word bemoeilik deur die feit dat, in sornmige gevalle, die reaktiewe komponent van die rots van sekond6re
oorsprong is en dat daar verskeie tipes alkali-aggregaatreaksies bestaan, elk met afsonderlike eienskappe en
reaksietempo.
Conference on alkaliaggregate reaction in concrete
Cape Town
-
South AfricaMach 30 -April 3,1981
Konferensie oor alkaliaggrqaatreaksie in beton
Kaapstad - Suid-Afrika
30 Maart
-
3 April, 1981Secretariat: NBRI of the CSIR Sekretariaat: NBNI van die WNNR
P 0 Box 395, Pretoria 0001, South Africa Posbus 395, Pretoria 0001, Suid-Afrika
Telephone (012) 86-921 1 Telegrams Navorsbou Telefwn (012) 86-9211 Telegramme Navorsbou
Telex SA 3-630 Teleks SA 3-630
I . INTRODUCTION 2 . DISTRIBUTION OF ALKALIS IN CLINKER In the past tive years. the Technical Centre tfolderbank
tias taken a special interest in thc relationship bctwecn <.linker characteristics and the properties of cement and concrete. One of tlic reasons for initiating a study of this topic was dcvclopiiicnts in the manufacture and usc of port- land canent. The inorc sophisticated and demanding re- quire~nents for cvment quality stipulated by users a r well as cl~angcs in manufacturing technology have implied changes in the composition of cciiient. Among others, the large encrgy-saving production units with suspension preheaters cniployed today and the use of sulphur-rich fuel have lead to increases in tlic alkali and sulphate content oC the clinker which is considered to have had the following negative side eftects: poor storage stability of the cement; and prema- ture stiffening and lower final strength of the concrete. Our study was designed to critically examine thcse effects. Therefore, special attention was given to thealkalisand their influence upon cemcnt and concrete properties. In thc course of a comprehensive investigation, 57 different clinkers produced in 57 kilns at 4 8 different cement plants werc collected. The clinkers and the cement, cement paste, mortar and concrete made froin them were examined by means of clieniical analysis, X-ray diffraction analysis (XKDA), light microscopy and physical tests. The 1SO mortar test and a standardized concrete mix werc used in the investigation. A selection of I I clinkers out of the total of 57, each representing a group of several clinkers, were subjected to further special analytical procedures such as rnicroprobe and scanning electron microscopy. Part of the results were presented and published' in 1978-79. I
The various raw materials, fuels and processes applied in the production of clinker ensured a wide range of compositions representing a cross section of the portland cement clinker produced today. The ranges of clinker composition para- meters are listed in Table 1.
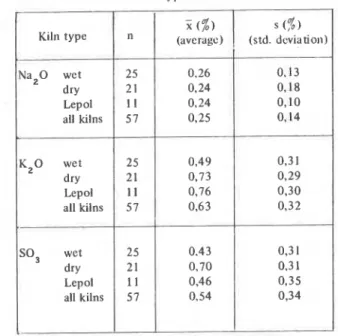
TABLE 1: Ranges of clinker compositions (n =57)
Minimum Maximum X -
c,s
%
36 6 9 54 C2S%
8 43 23 C,A%
1 ,o 13,4 8.5 C4AF%
5 2 17,3 8.7 LS 85 101 9 3 s SR 1 3 3,9 2,87 AR 0,7 3,1 1,88 K 2 0%
0 , w 1,40 0.4 1 Na20%
0,01 0,6 9 0,M SO,%
0 , w 1,30 0 3 4On the average, higher amounts of K 2 0 than NazO were rccorded in clinker, whcrcby in the dry process an increased K 0-content was ascertained compared to thc wet pro- cess (see Table 2) The alkalis in clinker occur cithcr as sulpfiates or in solid solution in clinkcr minerals.
TABLE 2: Alkali content in clinker according to kiln type
5
( % ) s ( % )Kiln type n (average) (std. deviation)
Na20 wet 25 0.26 0.13 dry 2 1 0.24 0.18 Lepol I I 0,24 0,10 all kilns 57 0,25 0,14 K 2 0 wet 25 0.4 9 0,31 dry 21 0.73 0.29 Lepol 11 0,76 0,30 all kilns 57 0.63 0.32 SO, wet 25 0.43 0,3 1 dry 21 0.70 0.31 Lepol I I 0,46 0,35 all kilns 57 0.54 0,34
I
I
I
I
(a) Alkali sulphates. Potassium sulphate, identified by XRDA as arcanite, constituted the predominant com- pound of alkalis in clinker. In some clinkers the double sulphate 3K2S04. Na2S04, identified by XRDA as glnserite, was determined.
The total amount of potassium (sodium) sulphates in clinker estimated by means of XRDA and chemical ana- lysis varied between 0-3.0 per cent.
Less frequently and in smaller quantities the calcium- potassiu~n sulphate 2 CaS04
.
K2S04 was present, identi- fied by XRDA as calcium longbeinite. No pure calcium sulphate or sodium sulphate could be detected.The soluble alkalis constitute an important and inform- ative parameter for clinker co~~~position. They were ex- tracted from the clinker by dissolving them in cold water for 2 minutes. This method allows for the complete ex- traction of all alkalis present as sulphates. A more ex- tensive extraction leads to the dissolution of some al- kalis from the main phases, particularly the aluininates.
1 will confine my presentation to some of the essential findings of this study in regard to alkalis in clinker because a literature review will be given in another paper a t this con- ference. The problem of alkaliaggregate reaction was not investigated in our study and will thus not be discussed.
(b) Alkalis in aluminate and ferrite. The results of the chemical and microprobe analyses on the 11 select- ed clinkers are compiled in Table 3 which shows the dis- tribution of alkalis and sulphates in the main clinker phases. Because of the semiquantitative character of the microprobe analysis, the quantitative values for the al-
2
TABLE 3a: Cllen~ical composition of the selected clinkers
I
TABLE 3b: Average alkali and sulphate content in the main clinker phases of the selected clinkers
i Clinker No. I 2 3 4 5 6 7 8 9 10 11
-
x min. max. Clinker No. 1 2 3 4 5 6 7 8 9 10 11-
x
min. max. C,S%
65 62 52 4 5 5 7 57 62 6 3 67 56 45 5 7 45 67 Na ,O%
0,11 0,15 0.05 0,12 0,42 0.18 0.45 0,32 0,04 0,11 0,06 0,18 0 ,04 0,4 5 C,S%
17 19 25 29 2 1 22 16 15 16 2 1 32 2 1 15 3 2 In ali te Na20%
0,05 0,03 0,03 0,09 (lo6 0,08 0,08 0,07 0,03 0,07 0,09 0,06 0.03 0.09 C3 A%
7,7 8,O 9,4 13,4 8,O 2,7 11,8 11,3 2,4 8 3 10,4 8,6 2,4 13,4 K2°%
0.39 0 5 0 0,63 1.30 0,61 0,70 0.80 0,82 0,08 1,lO 0,15 0,64 0,08 1,30 In belite C,AF%
7 6 7 6 7,9 5,s 8,s 4,3 5.5 5,5 10.9 8,s 7.0 8.0 5,s 14,3 Na20 water soluble5
0,03 0,02 0,03 0,12 0,08O M
0,12 0,16 0,Ol 0,08 0.01 0,06 0.01 0,12%
0,29 0.28 0,60 1.11 0.39 0.35 0,64 0,95 0,18 0,84 0.43 0,55 0,18 1.11 K2°%
0.01 0,02 0,06 0,09 0,11 0,07 0,05o m
0,Ol 0,Ol 0,Ol 0,04 0,Ol 0,11 In aluminate+
ferrite K2° water soluble%
0,16 0,13 0,49 1.00 0,35 0,38 0 3 8 0,70 0,Ol 0,91 0.03 0,43 0,Ol 1,OO SO,%
0,65 0,03 0,16 0,60 0,20 0,17 0,lO 0,58 0,35 0,20 0,07 0,28 0,03 0,65%
0,19 0,03 0.03 0,16 0,Ol 0,06 0,Ol 0,14 0,06 0,03o m
0,07 0,Ol 0,14 Na20%
0,15 0,11 0,M 0,05 0,20 0.29 0,3 3 0,26 0,08 0,lO 0.08 0,16 0,05 0,33 K2 O%
0,65 0,40 0,62 0,87 0,70 0,77 0,79 0,4 1 0,02 0,20 0,Ol 0,49 0,Ol 0,87%
0,04 0,O 1 0,Ol 0,16 0,02 0,06 0,Ol 0,08 0,12 0,02 0,02 0,05 0,Ol 0,16 Na, 0%
-0,42 0,32 0,06 0 3 4 1 3 6 0,50 1,51 0,90 0,19 0,34 0,46 0,62 0,06 1 3 0 Kz%
0,33 0,55 0,16 0,4 1 2,29 0,46 0,97 0,21 0,03 0,05 0,Ol 0,50 0.01 2,29TABLE 1 (continued)
Alkali content of Rate of Expansion at:
Author, sample, cement, % N a 2 0 expansion 140 300 600
rock type equivalent x loa days-\ days days days
Stantongs USA sand 4A silica reaction Hobbsa9 opal (3%) (2%) Houston2P USA
Republican River Sand Republican River Sand Louisiana Sand Louisiana Sand Davis2 Australia opal Gogte40 India quartz sandstone basalt ST phyllite chlorite sandstone basalt 3T phyllite sericitic charnockite argillaceous sandstone with chert
Duncan" Nova Scotia calcareous argillite AP 14A
quartzite AP 14C
phyllite AP 24/S9B
TABLE 2 : Expansion after 140,300 and 600 days of curing at 38 OC and 100% R.H. of mortar bars made with the
slowly expanding siliceous aggregates and one sample of volcanic glass
Alkali content of Rate of Expansion, % at: Sample and cement. % Na,O expansion 140 300 600
reference* equivalent x 10' days-); days days days
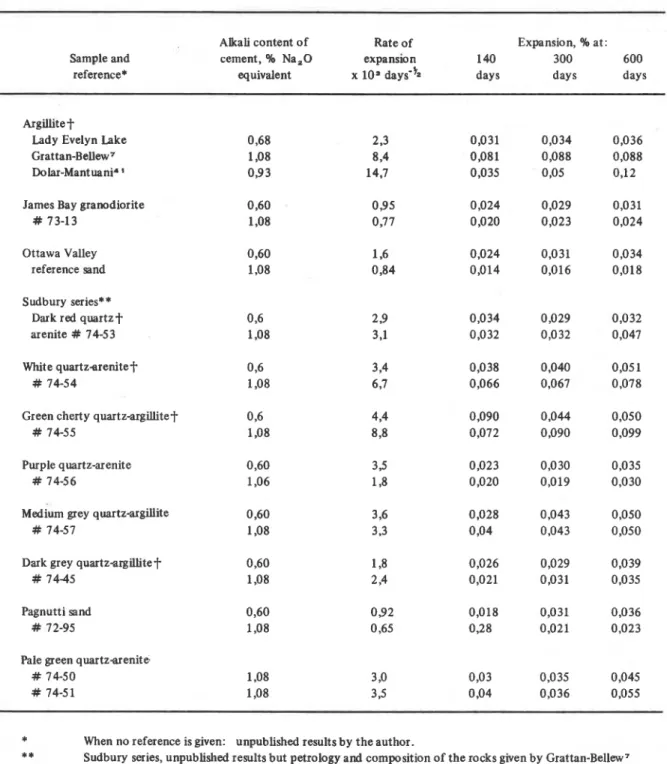
Argillitet
Lady Evelyn Lake Grattan-BeUew7 Dolar-Mantuani* James Bay granodiorite
# 73-13
Ottawa Valley reference sand Sudbury series**
Dark red quartz+ arenite # 74-53 White quartzarenitet
# 74-54
Green cherty quartz-argillitet 0 4
# 74-55 1,08
Purple quartz-arenite # 74-56
~ e d i u m grey quartz-argillite 0,60
# 74-57 1,08
Dark grey quartzargillitet 0,60
# 74-45 1,08
Pagnutti sand # 72-95
Pale green quartzarenite # 74-50
# 74-51
*
When no reference is given: unpublished results by the author.**
Sudbury series, unpublished results but petrology and composition of the rocks given by Grattan-Bellew7t
Material shown to be expansive by the concrete prism test.cylinders and concrete prisms made with lugh alkali The miniature rock prism test has been used t o evaluate the cement. This poor correlation may be due t o a combination expansivity of a mite of slowly expanding siliceous aggre- of factors: an insufficient number of samples may have gates from the Sudbury region of Ontario7 . The correlation been used to account for the variability of composition of coefficient between the rates of expansion of the rock the rock and difficulties encountered in making accurate prisms in 2N NaOH and of concrete prisms made with high length measurements of the expansive samples due t o gel alkali cement was 0,7845. Although the correlation was deposition o n the surfaces of the prisms. only moderately good, it indicates that, with these types of
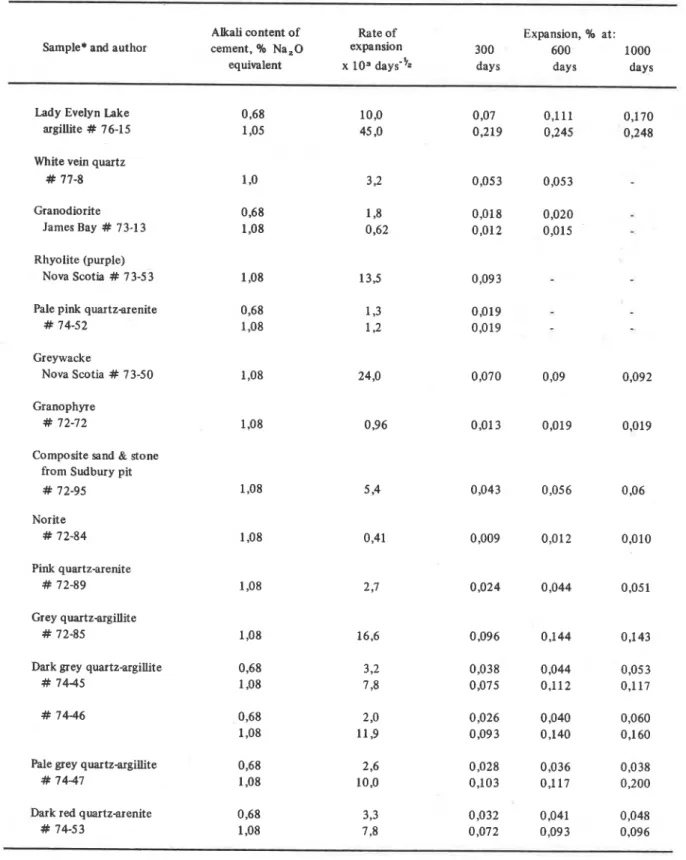
TABLE 3 : Rates of expansion and percentage expansion after 300,600 and 1000 days, moist curing at 38 OC of concrete prisns made with slowly expanding siliceous aggregates. A number of non-expansive samples are also included.
(Grattan-Bellew unpublished data from Sudbury)
Alkali content of Rate of Expansion, % at: Sample* and author cement, % Na,O expansion 300 600 1000
equivalent x
los
days-l/. days days daysLady Evelyn Lake argillite # 76-15 White vein quartz
# 77-8 Granodiorite
James Bay # 73-1 3 Rhyolite (purple)
Nova Scotia # 7 3-5
3
1,08 Pale pink quartzarenite 0,68# 74-52 1,08
Greywacke
Nova Scotia # 73-50 1,08 24,O 0,070 0,09 0,092
Granophyre # 72-72
Composite sand & stone from Sudbury pit
# 72-95 1,08 5 94 0,043 0,05 6 0,06 Norite # 72-84 Pink quartz-arenite # 72-89 Grey quartz-argillite # 72-85
Dark grey quartzargillite 0,68
# 74-45 1,08
Pale grey quartzargillite 0,68
# 74-47 1,08
Dark red quartzarenite 0,68
# 74-53 1,08
*
When author's samples are not from Sudbury, the location is listed.TABLE 3 (continued)
Alkali content of Rate of Expansion, % at: Sample* and author cement, % Na,O expansion 300 600 1000
equivalent x 10' days+ days days days
White quartzarenite
# 74-54
Purple grey quartz-arenite 0,68
# 74-56 1,08
Fine grey quartz-arenite 0,68
# 74-57 1,08
Pale green quartz-arenite
composite sample # 72-92 1,08 21
,O
0,204 1,212 0,212Medium green cherty quartz-arenite
# 74-55
Pale green quartz-arenite 0,68
# 74-50 1,08 Greywacke James Bay # 76-1 Amphibolite 0,68 JamesBay # 73-14 1,08 0berholsterP7 Malmesbury Hornfels Gillottas Alert Subgrewacke 43 Q4 Duncanag Nova Scotia Calcareous 0,71 0,3 0,005 0,006
Phyllite AP 14A 1 ,00 6,s 0,049 0,lO
Quartzite AP 14C
Phyllite AP 24/S9B
TABLE 4 : Rates of expansion of concrete made with alkali-carbonate expansive aggregates and cements of varying alkali content
Alkali content of Rate of Expansion after: Sample, location, cement, % Na,O expansion 300 600 1000
author equivalent x los days-(/. days days days
Kingston Grattan-Bellew
*
# 78-13 Smithzg Ontario 1,1 8,l 0,06 Buck"' # 1-8 1,o 55
0,08 0,09 0,101 Hadleyz5 St Louis #20007 North Vernon # 200024 0,60 0,890,45 0,009 both considered ex- 0,40 0,006 pansive by Hadley Osgoode # 2000
*
Unpublished results.aggregates, the miniature rock prism method gives more reliable results than the rock cylinder test.
(d) Chemical method, ASTM C289-77. In this test3, the aggregate is crushed t o pass a No 50 screen. The -50
+
100 mesh fraction is retained and heated with a 1N NaOH solution in a reaction vessel at 80 OC for 24 h. The amount of dissolved silica and the reduction in the alkalinity are then determined. This test was developed by Mielenz et all4 to evaluate the potential expansivity of classical alkali-silica reactive aggregates; good correlation was found between the results from the chemical method and those from the mortar bar test. The main advantage of this method is that Neither the rock cylinder nor the miniaturerock prism testgives a good indication of the expansivity of classical alkali-silica reactive aggregates because the samples either dissolve completely or break up owing to the dissolution of the bonding between the grainsP
".
The samples dissolve, indicating they are reactive, but this test gives no indication of the expansivity of the rock.the results can be obtained within three days. A disad- vantage is that the ratio of the amount of silica dissolved to the reduction in alkalinity, indicative of excessively expan- sive aggregates, varies with the type of aggregate and shows poor correlation between results obtained by different
workers (eg, Gudmundssong3. The results reported in the
literature indicate that this test should not be used unless it has f i s t been evaluated with aggregates of known expan- sivity taken from the area where aggregate deposits are to be tested. The chemical method is not applicable to alkali- carbonate aggregates where the expansion does not involve
silica. Duncan and Forangs found only a 50 per cent
agreement between the results of this test, applied to slowly expanding siliceous aggregates, obtained in two labora- tories. It may be possible, by further research, to improve the results of the chemical test when applied to slowly expanding aggregates.
3. THE RATE METHOD OF EVALUATING THE
EXPANSIVITY O F CEMENT-AGGREGATE COMBINATIONS
Figure 1 shows a typical expansion curve for mortar bars
containing an opal sand. From the shape of this curve it is apparent that the rate of expansion during the main expansion phase of the reaction largely determines the total expansivity of the sample. In the expansion mechan- ism of classical alkali-silica reactive aggregates" .- ",
diffusion appears to be the rate-controlling mechanism of the reaction. In a diffusion-controlled reaction the rate of reaction is proportional t o the square root of time. If the expansion during the main expansion phase of the akali- silica reaction is diffusion controlled then there should be a linear relationship between the percentage expansion and the square root of time during this period. To test this hypothesis, expansion values of a series of mortar bars made with cements of varying alkali contents, recorded by Stantong* (for sand No 4A), were replotted against the
square root of time (Figure 2). The mean correlation
coefficient for the regression lines fitted to the points is 0,9840. Similar results, obtained from those recorded in the
, , . , , , 0 I8
-
2-
'-
/
UTE ~ X P A N S I O N P H A S E 0 I6 - - 0 14-
-
* . 0 12 --
Z 0 O l O - - Z 4 2 0 0 s -/
i
. M A I N E X P A N S I O N P H A S E-
-
0 0 6 -/
-
0 0 4-
-
0 0 2 -j
I N D U C T I O N P H A S E-
9 o f l l l l l l *I l l L J I 0 5 10 15 LU 25 30 35 4 0 45 50 55 6 0 65literature, confirm that, during the main expansive phase of the reaction, diffusion is the ratecontrolling process. The rates of expansion are shown on the regression lines in Figure 2; from these it is evident that the rate of expansion expressed in terms of the square root of time is propor- tional t o the total expansivity of the samples. To test the validity of this hypothesis, sets of data recorded in the literaturess
-
O-
a were replotted to yield the rates of expansion and these were compared with the percentage expansion after various lengths of time. Nine sets of data of mortar bar and concrete prism expansion measurements from sources in the USA, Australia, USSR and Canada were used. A number of typical graphs are shown in Figure 3. The mean correlation coefficient for the straight lines fitted to the points on the graphs is 0,9693. This indicates that the rate of expansion during the main expansive phase of the reaction is linearly related to the expansivity of the sample. This correlation was found to hold for mortar bars and concrete prisms made with all types of aggregates. The time before the onset of the main expansive phase of the reaction varied, however, from a few days for the alkali-carbonate aggregates to 150 days for the slowly expanding
siliceous aggregates (Figure 4).
It was not possible from the available data to establish that the rate of expansion of rock cylinders was propor- tional to the expansivity of the samples. It was established, however, that during the main expansive phase of the reaction a linear relationship existed between the percent- age expansion and the square root of time. It seems probable, therefore, that the rate of expansion should be proportional t o the expansivity.
4. THE MINIMUM RATE O F EXPANSION FOR
THE DELETERIOUS EXPANSION OF SAMPLES An estimate of the rate of expansion corresponding to the cutaff between deleteriously expansive and normally expansive samples can be obtained from results reported in
-
ALKALI CONENT -OF EXPANSION
OF CEMNT lo3=-If2-
-
0 I 1 4 0 92 n 0 9 2 - A 0 7 7 - I I I I I I I I I 8 10 I2 14 I6 I8 S Q U A R E R O O T OF T I M E , d a y sT I M E , d a y s FIGURE 2: Linear relationship between the percentage expansion of mortar bars made with reactive
FIGURE 1 : Typical expansion curve of mortar bars made sand and cements with varying alkali contents
E X P A N S I O N AFTER 2 1 D A Y S . %
(a) Alkali-silica mortarbars, Brot&hi2
E X P A N S I O N AFTER 6 0 0 D A Y S . %
(c) Alkali-siliceous mortar bars. Sudbury (unpublished)
E X P A N S I O N AFTER 9 0 0 D A Y S . 8
-
(b) Alkali-silica concrete prisms, Davisa0
E X P A N S I O N AFTER 3 0 0 D A Y S . %
(d) ~lkali&bo&t~~oncaete prisms, HadleyPs FIGURE 3 : Percentage expansions a f t a varying times vs rates of expansion of mortar bars and concrete prisms showing the correlation between rate of expansion and the final expansion of the samples. Also included are the correlation coefficient rand the equation for each line fitted to the points in the graphs.
S Q U A R E R O O T OF T I M E . d a y s
FIGURE 4: Characteristic expandons of concrete prisms made with alkali-silica reactive aggregate No 1, alkali-carbonate expansive aggregate No 2 and slowly expanding siliceous aggregate No 3. The rates of expansion 'R' x l o 3 are indicated for the three phases of the expansions.
1 2 14 I6 I8 2 0 2 2 24 26 2 8
S Q U A R E R O O T OF TIME. d a y s
FIGURE 5: one standard deviation (s) timeexpansion envelopes about the mean expansion, of
expansive and non-expansive concrete prisms. The cutaff rate, 3 35 x days-%
,
used to differentiate between expansive and non- expansive concrete prisms is also shown.*
R is the rate of expansion expressed as days-h x loS.the literature for the various types of reactive samples as follows. The mean rate of expansion and its one standard deviation time expansion envelope .for both normal and deleteriously expansive concrete samples are plotted o n a graph (Figure 5). A line is positioned mid-way between the lower boundary of the one standard deviation time ex- pansion envelope for the expansive aggregates and the upper boundary of the one standard deviation time ex- pansion envelope of the nonexpansive samples. The slope of this line gives an estimate of the rate of expansion corresponding to the cut-off between deleteriously expan- sive and normally expansive samples. This procedure is
expected to give only a rough estimate of the cut-off between expansive and innocuous samples; it should be checked against known expansive and innocuous material from a particular area under investigation.
(a) Mortar bar test.
The mean rate of expansion for deleteriously expansive mortar bars obtained from data in the literature is 3 5 5 x
days-?z with a standard deviation of 26 x dayiYz
.
The mean rate of expansion and its one standard deviation for non-expansive aggregates is 2,O x lo-'2
1,3 x day<(/..
Using the procedure already outlined, a cut-off of 6,4 x lo-'days-?^
is found to differentiate between deleteriously expansive and normally expansive samples. Mortar bars made with Louisiana sandz2 expanded 0,04 per cent in 300 days and are considered non- expansive. The rate of expansion calculated for this sample is 3,s x lo-' dayi9z which is lower than the cut-off value. Mortar bars made with volcanic glass sand expanded 0,125 per cent in 600 days and cracked. This sample would be considered expansive. The rate of expansion for this sample was 11,2 x days-h.
These two results indicate that the cut-off rate of expansion to differentiate between deleteriously expansive and innocuous samples lies between 3,8 and 11,2 x days-&,
which is in reasonable agree- ment with the suggested value of 6,4 x d a y f h.
It must, however, be emphasized that this is not a unique value and its validity should be checked for a particular area, with a particular suite of rocks.Using the same logic and the results of Mukherjee et ale, a cut-off rate of expansion of 4,O x dayis/+ was found to differentiate between deleteriously expansive and innocuous mortar bars made with slowly expanding siliceous aggregates, but the value for a suite of quartzox aggregates from the Sudbury area was 1,9 x dayivz
.
As correlation between the expansion of mortar bars and that of concrete prisms for the Sudbury area was poor, the values from the latter method are probably unreliable. The lower cut-off value for the slowly expanding siliceous aggregates is to be expected as these rocks expand more slowly than the classical alkali silica aggregates.
(b) Concrete prism test.
(i) Siliceous aggregates. The mean rate of expansion of
expansive concrete prisms made with high alkali cement and slowly expanding siliceous aggregates listed in Table 2 is 10,86 x lo-' days-\ with a standard deviation of 6,16 x lo-' days-b
.
The mean rate of expansion of the non- expansive samples is 1,4 x loe3 days-b with a standard deviation of 1,15 xlo-'
d a y i k ; using the same logic as previously, a cut-off rate of expansion of 3,55 x lo-'day<\ is obtained. The lowest rate of expansion calcu- lated for a known expansive concrete is 9,s x lo-' day<% for a sample made with greywacke, Q4, from Alertx6. Most expansive samples have much higher rates of expansion, eg,
17 x for a hornfels from Cape Provincez7 or 4 5 x days-h for an argillite from Lady Evelyn Lake, Ontarioz. From these results, it would appear that the cut-off value of 3,55 x days-'z , to differentiate between deleteriously expansive and innocuous, is probably too low. A value of about 6 x lo-' days-(/r , as was found for mortar bars made with classical alkali-silica reactive aggregates, might be more realistic but in practice a cut-off should be determined for a particular suite of rocks in a given area.
(ii) Alkali-carbonate expansive aggregates. If the highly
expansive aggregate No 78-16 from Kingston (Table 3) with a rate of expansion of 48 x loe3 dayi4z is omitted, the mean rate of expansion for expansive aggregates is 6,39 x
2
2,16 x lo-)days‘"^
.
The mean rate of expansion of the non-expansive samples is 1,37 xt
0,61 x days-"2.
Using the same logic as before, a cut-off rate of expansion to differentiate between deleteriously expansive and innocuous samples of 3,l x lo-' days-?z was obtained. Expansion data for sample No 1-8 listed by BuckM gave a rate of expansion of 5,s x dayi7z.
The sample expanded by 0,101 per cent in 1 000 days and is hence expansive. Expansion data on a n alkali-carbonate aggregate from the Utinoff q w r y , Ontariozg, yielded a rate of expansion of 8,l x days-&.
This sample expanded by 0,06 per cent in 300 days. These low rates of expansion for moderately expansive concretes indicate that a cutaff of 3,l x day<% may be about correct. Because these samples start expanding after a few days, a lower rate of expansion may give rise to more expansion than would be obtained, for example, with concrete made with slowly expanding siliceous aggregate with the same rate of expansion.(c) Rockcylinder and miniature rock prism tests. (i) Alkali-carbonate expansive aggregates. From a survey of rockcylinder test results, it was not possible to determine a cut-off value to differentiate between expan- sive and innocuous samples. Different authors reported widely divergent results. It is thought that this may be due to variations in the samples and also to limitations of the method. The miniature rock prism method tends to give more reproducible results but not enough measurements have been made t o differentiate between expansive and innocuous samples and it appears the cut-off value may be about 10 x day<%
.
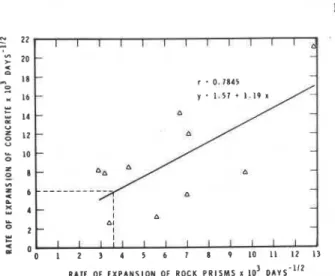
FIGURE 6: Correlation between expansion of miniature rock prisms in 2 N NaOH and concrete prisms made with high alkali cement made with Sudbury aggregates. The correlation co- efficient is 0,7845.
(ii) Slowly expanding siliceous aggregates As the correlation coefficient between the expansion of rock cylinders in alkali and the expansion of concrete prisms made with the same aggregates and high alkali cement is only 0,5703, no attempt was made to find a cut-off value to differentiate between deleteriously expansive and normally expansive samples. Using the miniature rock prism' method, a correlation coefficient between the rates of, expansion of rock prisms and concrete prisms from the Sudbury area was found to be 0,7845 (Figure 6). Assuming a cut-off rate of 6 x days-% for the concrete prisms, a corresponding rate of about 3 x
lo-'
d a y i t as the cut-off to differentiate between expansive and innocuous rock prisms may be read off the graph (Figure 6). From these results, it is evident that the cut-off rate of expansion is about the same for miniature rock prisms as it is for con- crete prisms made with slowly expanding siliceous aggregates. This is not unexpected as a large part of theexpansion of the concrete made with these aggregates is due to the expansion of the aggregate and not due to gel formation.
5. SUMMARY
The optimum test method for alkali expansivity of concrete aggregates depends on the type of aggregate. For classical alkali-silica reactive aggregates, opal, chert and volcanic
glass, the mortar bar method is the best. The concrete prism test is the optimum method for testing alkali-carbonate expansive rocks, but the rockcylinder and miniature rock prism methods can also apply. The concrete prism test is also optimum for evaluating slowly expanding siliceous aggregates, quartzites, argillites, quartz arenites and grey- wackes. Poor correlation is found between the expansion of rock cylinders and concrete prisms made with slowly expanding siliceous aggregates; better results seem to be obtained with the miniature rock prism test.
The chemical method is applicable to classical alkali-silica reactive aggregates but the interpretation of the results is not easy. This ~r~ethod also has some potential for the evaluation of slowly expanding siliceous aggregates, but more reseiuch on its application to these types of aggregates is needed.
6. CONCLUSIONS
The expansion of mortar bars and concrete prisms was found to be diffusion controlled. The rate of expansion, expressed as the square root of time, during the main expansive phase of the reaction was shown to be linearly related to the ultimate expansion of the sample. Approxi- mate minimum rates of expansion, above which samples would be considered deleteriously expansive, were de- termined for mortar bars made with alkali-silica reactive aggregates and for concrete prisms made with slowly expanding siliceous aggregates and alkali-expansive car-
bonate aggregates.
ACKNOWLEDGEMENTS
This
paper is a contniution from the Division of Building Research, National
Research
Council of Canada, and
REFERENCES
MIELENZ R C, GREENE K T and BENTON E J
J Am Conc Inst, 19, (3), P 193-224,1947.
ASTM C227-71, Potential alkali reactivity of cement 14.
aggregate combinations (mortar bar method). 1979
Annual book of ASTM Standards, Part 14.
15.
GRATTAN-BELLEW P E and LITVAN G G Proc
GUDMUNDSSON G Alkali efnabreytingar i stein-
steypu, Build Res Inst, Reykjavik 12,1971.
Symposium, 'The effect of alkalies o n the properties
DIAMOND S Cem & Concr Res 5, p 329-346,1975.
of concrete'. London. Cement and Concrete Associa- 16.
tion, Slough, England, 1976.
17.
ASTM C289-71, Potential reactivity of aggregates
(chemical method). 1978 Annual book of ASTM 18.
GILLOTT J E, Eng Ceol, 9, p 303-326, 1975.
POWERS T C and STEINOUR H H J Am Conc Inst,26, p 497-516,1955.
Standards, Part 14, American Soc for Testing and Materials.
19. STANTON T E Am Soc Civil Eng, Proc 66,
p 1781-1811,1940.
ASTM C295-65, Standard recommended practice for petrographic examination of aggregates for concrete.
1978 Annual book of ASTM Standards, Part 14. 20. DAVIS C E S Aust J App Sci, 8, p 222-234,1957.
SAL'NIKOV N S and IVANOV F M Trans1
Kolloidnyi Zhurnal, 33, (6), p 879-884, 1971.
SWENSON E G and GILLOTT J E Highway Res 21.
Board Bull 2 7 5 , 1 9 6 0 .
HOUSTON B J Tech Memorandum 6-368, US Army Engineer, Waterways Exp Stn, Corps of Engineers, Vicksburg, Mississippi, 1967.
MUKHERJEE P K, DUNCAN M A G, FORAN M R 22.
and SAMANTA A The expansive behaviour o f mortar bars prepared from alkali-sensitive Nova Scotia concrete aggregates. Atlantic Ind Res Inst,
Halifax, 1970. 23. McCONNELL D, MIELENZ R C, HOLLAND W Y
and GREENE K T Am Concr Inst J, Proc 4 4 (2),
p 93-128,1947.
GRATTAN-BELLEW P E Proc 4th Int Conf, 'The effects of alkalies in cement and concrete'. Purdue
University, Pub1 No CE-MAT-1-78, Indiana, USA, 24. 1978.
BROTSCHI J and MEHTA P K Cem & Concr Res, 8 (2), p 191-200,1978.
HADLEY D W Highway Res Rec 45, p 196-221, 1964.
CSA CAN3-A23.2-M77 Test Method; A23.2-14A 25.
Alkali-aggregate reaction. Concrete Materials and
Methods of Concrete Construction, Methods for Test
of Concrete, Can Standards Assoc, Ontario. 26. GILLOTT J E and SWENSON E G Eng Gwl, 7,
p 181-195,1973.
ASTM C586-69, Potential alkali reactivity o f
carbonate rocks for concrete aggregates (rock 27.
cylinder method). 1978 Annual book of ASTM Standards, Part 14.
OBERHOLSTER R E, BRANDT M
P
andWESTON A C Die Siviele Ing in Suid-Afrika, No 7 p 161-166,1970.
NEWLON H and SHERWOOD W C Potentially 28.
reactive carbonate rocks. Virginia Council of High-
way Investigation and Research, Charlottesville, Va,
1962.
BUCK A D Tech Report C-75-3, Control o f reactive carbonate rocks in concrete. US Army
Engineer, Waterways Experiment Station, Vicksburg, Miss, 39180,1975.
DUNCAN M A G Correlation of field and labora- 2 9 .
tory evidence of alkali-silica reactivity in Nova Scotia concrete. Unpublished Thesis, Nova Scotia Tech
College, Halifax, 1970. 30.
SMITH P Highway Res Rec 45, p 126-133, 1964.
ALDERMAN A R, GASKIN A J, JONES R H and VIVIAN H E Studies in cementaggregate reaction I.
CSIR Bull No 229, Melbourne, Australia, 1947.
DOLAR-MANTUANI L M M Highway Res Rec
268, P 99-117,1969.
31.
DUNCAN M A G and FORAN M R Performance o f
rock cylinder tests in the Nova Scotia alkali- expansive aggregate studies. Nova Scotia Project
Committee on Concrete, Atlantic Ind Res Inst, Nova 32.
Scotia Tech College, Halifax, 1970.
SIMS I and POOLE A B Concrete, p 27-30, May
1980.
BONZEL J and JURGEN D B6ton 23, ( l l ) ,
33. JAGUS P J and BAWA N S Alkali-aggregate reaction
in concrete construction. Road Res Papers, No 11,
Central Road Research Inst, Okhla, Delhi, India, 1958.
34. STARK D Roc of 4th Int Conf, 'The Effects of Alkalies in Cement and Concrete'. Purdue University Publ No CE-MAT-1-78, Indiana, USA, 47907, p 335-343,1978.
35. LENZNER D Roc of 4th Int Conf, 'The Effects of Alkalies in Cement and Concrete'. Purdue University Publ No CE-MAT-1-78, Indiana, USA, 47907, p 11-54,1978.
36. ALSINAWI S A Roc Symposium, London, 1976, 'The Effect of Alkalies on the Properties of Concrete. Cement and Concrete Association, Slough, England.
37. MIELENZ R C and WITTE L P Tests used by the Bureau o f Reclamation for identifying reactive concrete aggregates. Material Laboratories Report
C400, US Dept of the Interior, Bureau of Reclama- tion, Denver, Colorado, 1948.
38. KELLY T M, SCHUMAN L and HORNI- BROOK F B J Am Concr Inst, 20 (I), p 57-80, 1948.
39. HOBBS D W Mag Cem and Concr Res, 30, (105), p 215-219.1978.
40. GOGTE B S Eng Geol, 7, p 135-153,1973.
41. DOLAR-MANTUANI L M M Highway Res R w 45, p 178-195,1964.
?his publication i s being d i s t r i b u t e d by the Division of Building R e s e a r c h of the National R e s e a r c h Council of Canada. I t should not be reproduced in whole o r in p a r t without p e r m i s s i o n of the original publisher. The Di- vision would b e glad to be of a s s i s t a n c e in obtaining such p e r m i s s i o n .
Publications of the Division m a y be obtained by m a i l - ing the a p p r o p r i a t e r e m i t t a n c e ( a Bank, E x p r e s s , o r P o s t Office Money O r d e r , o r a cheque, m a d e payable to the R e c e i v e r G e n e r a l of Canada, c r e d i t NRC) t o the
National R e s e a r c h Council of Canada, Ottawa.
KIA
OR6.
Stamps a r e not acceptable.
A l i s t of a l l publications of the Division i s available and m a y be obtained f r o m the Publications Section. Division
of Building R e s e a r c h , National R e s e a r c h Council of