Copyright © 2015 European Crohn’s and Colitis Organisation (ECCO). Published by Oxford University Press. All rights reserved.
For permissions, please email: journals.permissions@oup.com 1113
Original Article
Endoscopic Factors Influencing Fecal
Calprotectin Value in Crohn’s Disease
F. Goutorbe,
aM. Goutte,
a,bR. Minet-Quinard,
cA-L. Boucher,
aB. Pereira,
dG. Bommelaer,
a,b, A. Buisson
a,baUniversity Hospital Estaing, Gastroenterology Department, Clermont-Ferrand, France bUMR 1071 Inserm/ Universite d’Auvergne; USC-INRA 2018, Clermont-Ferrand, France cGM Clermont-Ferrand University and Medical Center, Biochemistry Unit, Clermont- Ferrand, France dGM Clermont-Ferrand University and Medical Center, DRCI, Biostatistics Unit, Clermont-Ferrand, France
Corresponding author: Anthony Buisson, MD, Department of Gastroenterology, University Hospital Estaing of Clermont-Ferrand, 1 Place Lucie et Raymond Aubrac, 63100 Clermont-Clermont-Ferrand, France. Tel.: +33 4 73 750 523; fax: +33 4 73 750 524; email: a_buisson@chu-clermontferrand.fr
Abstract
Background and Aims: Fecal calprotectin [fcal] is a biomarker of Crohn’s disease [CD] endoscopic activity. Identifying the endoscopic situations in which fcal is less reliable remains unexplored. We aimed to determine the endoscopic factors influencing fcal level in CD.
Methods: Overall, 53 CD patients consecutively and prospectively underwent colonoscopy, with CD Endoscopic Index of Severity [CDEIS] calculation and stool collection. Fcal was measured using a quantitative immunochromatographic test. Correlation analysis was done with Pearson statistics. Results: Fcal was correlated with CDEIS [0.66, p < 0.001]. In univariate analysis, fcal was correlated with
the affected surface [0.65, p < 0.001] and the ulcerated surface [0.47, p < 0.001]. Fcal was significantly associated with ulceration depth, with median fcal of 867.5 µg/g, 1251.0 µg/g, and 1800.0 µg/g, in patients presenting with non-ulcerated lesions, superficial ulcerations [SU], and deep ulcerations [DU], respectively. Lesion locations did not influence fcal. In multivariate analysis, fcal was associated with affected surface [p = 0.04] and the presence of CD lesions. Moreover, fcal increased with the ulceration depth [p = 0.03]. However, ulcerated surface and CD location did not affect fcal. Using a receiver operating characteristic [ROC] curve, we showed that fcal of 400 µg/g was the best compromise between sensitivity [0.76] and specificity [0.77], whereas fcal ≥ 200 µg/g was highly sensitive [0.86] to detect SU or DU. Conclusions: Fcal is a very reliable biomarker to detect endoscopic ulcerations in CD. We suggest repeating measurement in case of intermediary results [200–400µg/g] in daily practice. Fcal level is mostly influenced by the presence of CD lesions [even non-ulcerated], in a depth-related manner and by the affected surface.
Key words: Crohn’ s disease; fecal calprotectin; Crohn’s Disease Endoscopic Index of Severity; endoscopy; biomarker
1. Introduction
Crohn’s disease [CD] is a chronic relapsing and remitting disorder which can involve the entire length of the digestive tract.1 In the era of biologicals, new therapeutic goals, such as achieving mucosal healing or preventing digestive damage, have emerged and require objective tools to evaluate disease activity.2,3,4,5,6 As ileocolonoscopy
remains, to date, the gold standard to assess ileocolonic CD, reach-ing these therapeutic goals implies repeatreach-ing endoscopies, to moni-tor the disease activity. However, the burden experienced by patients and the potential risks 7 have led physicians to seek for alternative non-invasive approaches. Therefore, surrogate markers reflecting the severity of mucosal inflammation have been investigated.
doi:10.1093/ecco-jcc/jjv150 Advance Access publication September 8, 2015 Original Article
One of the most attractive methods is the measurement of inflammatory proteins secreted by neutrophils in the stool, such as fecal calprotectin. Fecal calprotectin is reliably and reproductively measured in stool samples and this dosage might even be eligible for patient home-based measurement in the near future.8 Fecal cal-protectin level significance has been studied in CD clinical trials for more than 10 years.8,9,10,11,12,13,14,15,16,17,18,19,20,21 Its ability to dif-ferentiate inflammatory bowel disease [IBD] from irritable bowel syndrome patients, to predict clinical relapse, and to avoid useless colonoscopies in CD or ulcerative colitis patients has been exten-sively demonstrated.10,13,15,18,19,20,21,22 As a consequence, fecal calpro-tectin has been increasingly used in the diagnosis and the monitoring of CD in daily practice.17
More recently, some reports showed a significant correla-tion between fecal calprotectin level and both the Crohn’s Disease Endoscopic Index of Severity [CDEIS] and the Simple Endoscopic Score of Crohn’s Disease [SES-CD].14,23 However, some studies sug-gest that fecal calprotectin results are less relevant in patients with pure ileal CD,14,23 even if the data remain conflicting 9. Knowing in which conditions fecal calprotectin might be less reliable as a predic-tor of endoscopic activity is a key point in daily practice.
The correlation between fecal calprotectin level and specific items composing the CDEIS, such as ulceration depth, affected sur-face, ulcerated sursur-face, and stenosis, has never been investigated so far and could lead to an explanation of the weaknesses of fecal cal-protectin in some clinical situations.
In the present study, we aimed to determine endoscopic factors influencing fecal calprotectin level, including each independent item of the CDEIS 24.
2. Methods
2.1. Ethical considerations
The study was performed in accordance with the Declaration of Helsinki, Good Clinical Practice, and applicable regulatory require-ments. The study has been approved by the local Ethics Committee [IRB 00008526 – Ref. 2015 / CE 24].
2.2. Patients
We led an observational study of a single-centre cohort in which standardised evaluation was performed by experienced clinicians, in all patients. Patients from the Clermont-Ferrand IBD Unit with an established diagnosis of CD according to Lennard-Jones criteria,25 undergoing ileocolonoscopy regardless of the indication were pro-spectively and consecutively included between December 2013 and December 2014. Clinical parameters including the Crohn’s Disease Activity Index [CDAI] were collected [Table 1]. Blood samples were taken before the endoscopy and were used to measure the highly sensitive serum C-reactive protein [CRP] level.
Patients who took non-steroidal anti-inflammatory drugs [NSAIDs] or aspirin within the 4 weeks preceding the measurement of calprotectin were not included.
2.3. Endoscopy
Patients followed a bowel-cleansing protocol via oral ingestion of 2l of polythene glycol [PEG] [Fortrans, Ipsen Pharma, Paris, France] the previous evening, and 2l on the morning of the examination. Endoscopies were performed under anaesthesia with propofol [PROPOFOL DAKOTA PHARM; Sanofi-Aventis, Paris, France], by two experienced endoscopists [AB, GB], using column video colo-noscopy [QFC L 140; Olympus, Tokyo, Japan]. The endoscopists
were blinded to the results of fecal calprotectin dosage. An affected area was defined as the presence of at least one CD lesion [deep or superficial ulceration, aphthoid erosion, frank erythema, frankly swollen mucosa, stenosis, pseudopolyp] according to Mary et al. 24. An ulcerated area was defined as the presence of deep or superficial ulceration according to the CDEIS definitions.24 The lower diges-tive tract was divided into five segments according to CDEIS cal-culation [terminal ileum, caecum/right colon, transverse colon, left/ sigmoid colon, and rectum]. The affected or ulcerated surfaces were evaluated in each segment. The calculation of the overall affected or ulcerated surface was performed according to the following formula: sum of each segmental surface divided by the number of segments [exception: for affected surfaces of 5% in the ileum, 20% in the right colon, 0% in the transverse colon, 0% in the left/sigmoid colon, and 5% in the rectum, we calculated [5 + 20 + 0 + 0 + 5]/5 = 6 %]. In case of no previous surgery, each segment represented 20% of the overall surface; otherwise, the number of segments was adapted to the surgery extension and location.
2.4. Fecal calprotectin measurement
To reduce intra-individual variation, stools were collected in the morningof the day before the endoscopy and were immediately stored at 4°C. The bowel cleansing was started in all patients after stool collection. Patients were instructed to transport the stool
Table 1. Baseline population characteristics.
n = 53
Female, n [%] 30 [56.6]
Age at inclusion[years], mean ± SD 31 [21–44]
BMI, median [IQR] 22.1 [18.5–26.3]
Disease duration [months], median[IQR] 3.5 [1–9]
Active smokers, n [%] 17 [31.1]
Previous intestinal resection, n [%] 14 [26.4]
Anoperineal lesion, n [%] 14 [32.1] Montreal classification Age at diagnosis, n [%] A1 13 [24.5] A2 12 [22.7] A3 28 [52.8] Location, n [%] L1 13 [24.5] L2 12 [22.6] L3 28 [52.8] L4 4 [7.5] Behaviour, n [%] B1 28 [52.8] B2 12 [22.6] B3 11 [20.8] Concomitant therapies Anti-TNF, n [%] Infliximab 13 [26.0] Adalimumab 12 [23.5] 5-ASA, n [%] 9 [18.4] Budesonide, n [%] 3 [6] Corticosteroids, n [%] 8 [15.7] Thiopurines, n [%] 13 [31.4] Methotrexate, n [%] 1 [2.0]
CDAI, median [IQR] 198.5 [101–258]
CRP, median [IQR], mg/l 11.20 [4.6–71]
SD, standard deviation; IQR, interquartile range; BMI, body mass index; TNF, tumour necrosis factor; CDAI, Crohn’s Disease Activity Index; CRP, C-reactive protein.
samples in a dedicated container at 4°C. Fecal samples were imme-diately transferred upon patient arrival to the Clermont-Ferrand hospital Biochemistry Laboratory. Calprotectin was measured using quantitative immunochromatographic test Quantum Blue® High Range [Bühlmann Laboratories AG, Schönenbuch, Switzerland], according to the manufacturer’s instructions. Laboratory person-nel, who were blinded to the current clinical and endoscopic disease activity of the patients, performed the analyses. The lower and the upper limits of detection were 100 µg/g and 1800 µg/g, respectively. Consequently, all calprotectin levels < 100µg/g and > 1800µg/g were considered as equal to 100 µg/g and 1800 µg/g, respectively. 2.5. Data managing and statistical analysis
Study data were collected and managed using REDCap elec-tronic data capture tools hosted at Clermont-Ferrand University Hospital.
REDCap [Research Electronic Data Capture] is a secure, web-based application designed to support data capture for research studies, pro-viding: 1] an intuitive interface for validated data entry; 2] audit trails for tracking data manipulation and export procedures; 3] automated export procedures for seamless data downloads to common statistical packages; and 4] procedures for importing data from external sources26.
Statistical analysis was performed using Stata software [version 13, StataCorp, College Station, TX, US]. The tests were two-sided, with a type I error set at α = 0.05. Baseline characteristics were presented as mean [± standard deviation] or median [interquartile range] according to statistical distribution [assumption of normality assessed using the Shapiro–Wilk test] for continuous data and as the number of patients and associated percentages for categorical param-eters. Comparisons of patient’s characteristics between the independ-ent groups were performed using the chi-square or Fisher’s exact tests for categorical variables, and using ANOVA or the Kruskal-Wallis test for quantitative parameters [homoscedasticity verified using the Bartlett test]. Correlation coefficients [Pearson or Spearman, according to statistical distributions] were calculated to study rela-tions between quantitative parameters [calprotectin vs others, for example]. In multivariate situations, linear regression was performed according to univariate results and clinical relevance. Considering the statistical distribution of calprotectin, a log-transformation was pro-posed to achieve the normality. Results were expressed as regression coefficients with 95% confidence intervals [CIs]. A ROC curve was used to define the best fecal calprotectin threshold to detect super-ficial or deep ulceration in CD, taking into account the clinical rel-evance and using two different approaches, ie a usual test [Liu or Youden’s tests] or positive likelihood ratio calculation.
3. Results
Population characteristics
IN all, 53 CD patients were included [57% female], with a median age of 31 (interquartile range [IQR] [21–44]) years and a median CD duration of 3.5 [1.0–9.0] years at the inclusion time. Of these, 13 patients [24.5%] presented with pure ileal disease [L1 according to Montreal classification], 12 [22.7%] with colonic disease [L2], and 28 [52.8%] with ileocolonic CD [L3]. The median CDAI and CRP were 198.5 [101–258] and 11.40 [4.20–33.70] mg/l, respectively. Patients’ characteristics are shown in Table 1.
3.2. Endoscopic evaluation
All but five ileocolonoscopies [48/53, 90.5%] reached the ter-minal ileum. Median CDEIS was 3.6 [2.66–6.4]. Endoscopic
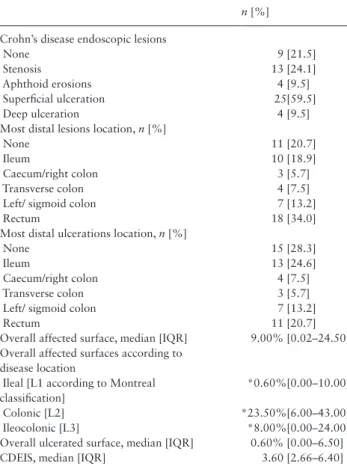
ulcerations were reported in 40 patients [75.5%]. The median percentage of affected surface was 9.00% [IQR 0.02–24.50]. The affected surface was significantly greater in colonic CD [L2 according to Montreal classification] than in ileal [L1] or ileoco-lonic [L3] CD [p = 0.03] [Table 2]. The median percentage of ulcerated surface was 0.60% [IQR 0.00–6.50]. Endoscopic data are given in Table 2.
3.3. Fecal calprotectin measurements
Median fecal calprotectin level was 1105 µg/g [191–1800] and was not significantly different according to disease location. We found a median fecal calprotectin level of 841 µg/g [265–1800], 1575 µg/g [1032– 800], and 416.5 µg/g [140–1800] in patients with pure ileal CD, colonic CD, and ileocolonic CD, respectively [p = 0.27] [Table 3]. The ulceration locations and the presence of stenosis did not impact on the fecal calprotectin values. Fecal calprotec-tin levels were significantly higher according to ulceration depth, with median calprotectin levels of 867.5 µg/g [273.0–1575.5], 1251.0 µg/g [396.0–1800.0] and 1800.0 µg/g [1019.0–1800.0] in patients presenting with non-ulcerated lesions [including aphthoid erosions], superficial ulcerations, and deep ulcerations, respectively [Table 3].
3.4. Correlations studies
Fecal calprotectin values were correlated with CDEIS [rho = 0.66,
p < 0.001] [Figure 1]. We observed the same correlation in the
Table 2. Description of baseline endoscopic characteristics.
n [%] Crohn’s disease endoscopic lesions
None 9 [21.5]
Stenosis 13 [24.1]
Aphthoid erosions 4 [9.5]
Superficial ulceration 25[59.5]
Deep ulceration 4 [9.5]
Most distal lesions location, n [%]
None 11 [20.7]
Ileum 10 [18.9]
Caecum/right colon 3 [5.7]
Transverse colon 4 [7.5]
Left/ sigmoid colon 7 [13.2]
Rectum 18 [34.0]
Most distal ulcerations location, n [%]
None 15 [28.3]
Ileum 13 [24.6]
Caecum/right colon 4 [7.5]
Transverse colon 3 [5.7]
Left/ sigmoid colon 7 [13.2]
Rectum 11 [20.7]
Overall affected surface, median [IQR] 9.00% [0.02–24.50] Overall affected surfaces according to
disease location
Ileal [L1 according to Montreal classification]
*0.60%[0.00–10.00]
Colonic [L2] *23.50%[6.00–43.00]
Ileocolonic [L3] *8.00%[0.00–24.00]
Overall ulcerated surface, median [IQR] 0.60% [0.00–6.50]
CDEIS, median [IQR] 3.60 [2.66–6.40]
IQR, interquartile range; CDEIS: Crohn’s disease Endoscopic Index of Se-verity.
*Significantly different [p = 0.03].
non-operated patients subgroup [rho = 0.70, p < 0.001]. Fecal calpro-tectin values were also correlated with CRP [rho = 0.64, p < 0.001] and CDAI [rho = 0.48, p < 0.001], but CRP and CDAI were moderately correlated with CDEIS [rho = 0.59, p < 0.05 and rho = 0.47, p < 0.05, respectively].
In univariate analysis, fecal calprotectin level was correlated with the affected surface [surface involved by CD lesions] [rho = 0.65,
p < 0.001] [Figure 2] as well as with the ulcerated surface [rho = 0.47,
p < 0.001].
We did not observe any difference regarding the correlation between CDEIS and fecal calprotectin value in disease location sub-groups (pure ileal disease [rho= 0.66, p < 0.001] vs colonic or ileoco-lonic CD [rho = 0.67, p < 0.001]).
3.5. Multivariate analysis
In the multivariate analysis, the fecal calprotectin level was related to the presence of at least one CD lesion [even non-ulcerated] [p = 0.04] and the affected surface [p = 0.04] [Table 4]. Moreover, fecal calpro-tectin level increased with the ulceration depth [p = 0.03] [Table 4]. Ulcerated surface and CD location were not associated with fecal calprotectin value.
3.6. ROC curve analysis
Using a ROC curve (area under the curve [95% CI] = 0.795, [0.624–0.966]), we attempted to determine the best fecal calpro-tectin threshold to detect the presence of superficial or deep ulcera-tions in CD [Figure 3]. We showed that a cut-off value of 400 /g was the best compromise between sensitivity [0.76] and specific-ity [0.77] (area under the curve [95% CI] =0.795, [0.624–0.966]) to detect superficial or deep ulcerations, with positive predictive value and negative predictive value of 0.88 and 0.56, respectively [Figure 3]. A cut-off value of 200 µg/g detected superficial or deep ulcerations with sensitivity, specificity, positive predictive value, and negative predictive value of 0.86, 0.70, 0.86, and 0.70, respec-tively [Figure 3].
4. Discussion
To our knowledge, this study [including multivariate analysis] is the first to attempt to identify endoscopic factors, including each item com-posing the CDEIS, that could influence fecal calprotectin level in CD.
0 0 500 1000 1500 Fecal calprotectin 2000 5 10 CDEIS 15 20
Figure 1. Correlation between fecal calprotectin level and Crohn’s disease endoscopic index of severity [CDEIS] in Crohn’s disease.
Table 3. Univariate analysis of endoscopic factors [qualitative
fac-tors] associated with fecal calprotectin levels.
Fecal calprotectin [µg/g], median [IQR] p-value Location NS L1 841.0 [265.0–1800.0] L2 1575.5 [1032.0–1800.0] L3 416.5 [140.5–1800.0] Lesions type, n [%] 0.003 None 100.0 [100.0–145.0] Aphthous ulcer 867.5 [273.0–1575.5] Superficial ulceration 1251.0 [396.0–1800.0] Deep ulceration 1800.0 [1019.0–1800.0] Most distal lesions
location, n [%]
None 100.0 [100.0–162.0] NS
Ileum 1570.0 [265.0–1800.0]
Caecum/right colon 1351.0 [410.0–1800.0] Transverse colon 1075.0 [777.5–1554.5] Left/ sigmoid colon 1105.0 [191.0–1800.0]
Rectum 1655.0 [384.0–1800.0]
Most distal ulcerations location, n [%]
None 162.0 [100.0–1105.0] NS
Ileum 1800.0 [437.0–1800.0]
Caecum/right colon 163.5 [129.0–300.5] Transverse colon 841.0 [714.0–1309.0] Left/ sigmoid colon 1800.0 [238.0–1800.0]
Rectum 1800.0 [1251.0–1800.0]
IQR, interquartile range; NS, non-significant.
Use of fecal calprotectin level to monitor CD activity in daily practice has been widespread since mucosal healing has been consid-ered as the therapeutic target in IBD. However, regarding the curves illustrating the correlation between endoscopic scores and fecal cal-protectin level published so far,11,14,22,23 one can observe that several points highlight conflicting data [ie low endoscopic score with high fecal calprotectin value or high endoscopic score with low fecal value]. Best knowledge of these situations in which fecal calprotectin results might less reliable is a key requirement in daily practice.
In our cohort, the CDEIS was correlated with the fecal calpro-tectin levels [0.66, p < 0.001], which is in line with previous stud-ies11,14,22,23 reporting correlation coefficients ranging from 0.48 to 0.73 between fecal calprotectin levels and endoscopic scores [CDEIS or SES-CD]. The two main endoscopic scores, CDEIS and SES-CD, depend on the affected area, the ulcerated area, the presence of ste-nosis, the ulceration size [only for SES-CD], and the ulceration depth [only for CDEIS]. Although the correlation between CDEIS and cal-protectin value has been previously demonstrated, we advocate that the lack of reliability of fecal calprotectin in some situations could be linked to the different impact that each item composing the endo-scopic scores has on fecal calprotectin level.
In our study, the first point is that the presence of CD lesions, even non-ulcerated, did increase the fecal calprotectin level. In addi-tion, we reported that fecal calprotectin values were significantly associated with ulceration depth, especially in the case of deep ulcer-ations. Our results complete the data from D’Haens et al.23 suggest-ing, in a univariate analysis, a correlation between fecal calprotectin levels and the presence of ulcerations larger than 5 mm. Recently the
same team confirmed the impact of the ulceration size on fecal cal-protectin value 27. We reported also that the fecal calprotectin value depends on the affected surface but not on the ulcerated surface in multivariate analysis. From a statistical point of view, we hypothesise that the non-significance of the ulcerated surface might be related to the weak variation of this item in our population.
We investigated the role of disease location on fecal calprotectin values. First, we showed that the location of the most distal seg-ment involved [eg right colon vs rectum] did not impact the calpro-tectin level, confirming that the calprocalpro-tectin is a very stable protein in the lower gastrointestinal tract, with negligible loss during the ileocolonic course. The question of the reliability of calprotectin measurement in pure ileal CD remains debated. Shoepfer et al.14 reported that ileocolonic CD was associated with significantly higher mean calprotectin level compared with ileal CD, in a uni-variate analysis. Regarding our multiuni-variate analysis, we consider that this difference is more likely to be linked to the affected sur-face or the ulceration depth rather than the CD location. They also suggested that fecal calprotectin was less reliable in patients with pure ileal CD as the correlation seemed to be decreased in the sub-group of pure ileal CD compared with the subsub-group of ileocolonic CD [0.649 vs 0.795].14 Other authors reported the same trend.16,23 Recently, the D’Haens team reported in a smaller cohort [n = 44] than ours that fecal calprotectin value was lower in ileal CD com-pared with colonic or ileocolonic CD, even in case of large ulcera-tions.27 However, they did not take into account several potential confounding factors, especially the affected area, as their statistical analysis did not include a multivariate analysis. In our study, fecal calprotectin levels were not different according to CD location, either in the univariate or in the multivariate analysis. Our results are consistent with those published by Jensen et al. who found that fecal calprotectin was equally sensitive in colonic and small-bowel CD.15 As suggested by this present study, we believe that the sup-posed decreased accuracy of fecal calprotectin in ileal CD could be related to the impact of the affected surface. In addition, the accuracy of endoscopic scores to assess pure ileal CD is a key point when discussing the performances of calprotectin. Indeed, endo-scopic scores are known to underestimate endoendo-scopic severity in pure ileal CD, in particular because a colonoscopy allows only few centimetres to be explored. 0 0 500 1000 1500 Fecal calprotectin 2000 20 40 60 Affected area 80 100
Figure 2. Correlation between fecal calprotectin level and endoscopic affected area in Crohn’s disease patients.
Table 4. Multivariate analysis of factors influencing fecal
calpro-tectin in Crohn’s disease.
Regression coefficient p-value 95% confidence interval Affected surface 0.0211 0.010 0.0053 0.0369 Ulcerated surface 0.0203 0.897 -0.0296 0.0337 Non-ulcerated lesions 1.1501 0.039 0.0642 2.2360 Superficial ulcerations 1.1237 0.004 0.3823 1.8652 Deep ulcerations 1.2569 0.035 0.0928 2.4209 Crohn’s disease location 0.387 0.239 -0.2693 1.0450
An ongoing issue is the fecal calprotectin cut-off value that should be used in practice to predict mucosal healing or endoscopic remis-sion. Although several trials have defined mucosal healing with differ-ent thresholds of CDEIS or SES-CD,28,29 large trials like ACCENT-1, EXTEND, and SONIC2,30,31 used ‘absence of ulcers’ as the main endoscopic endpoint, which seems to be a more consistent marker of lesion severity.2,30,31 We found that fecal calprotectin ≥ 400 µg/g was the best compromise between sensitivity and sensitivity [using posi-tive likelihood ratio] in detecting the presence of superficial or deep ulcerations, whereas a cut-off value ≥ 200µg/g showed a high sensitiv-ity [0.86]. Calprotectin ≥ 250 µg/g is, to date, the most acceped value to detect significant endoscopic activity defined as presence of ulcera-tions larger than 5 mm.23,32 The authors have chosen this point with low sensitivity [= 51.6%] and high specificity [= 82.6%] to avoid per-forming useless endoscopy in CD patients. Our daily experience and our results led us to consider that between 200 and 400µg/g remained a grey zone where fecal calprotectin value should be interpreted with caution and in which measurements should be repeated, owing to the intra-individual variability due to the time and the technique of stool collection.8 The stool collection should be performed preferably dur-ing the first morndur-ing stool to reduce intra-individual variability, and the sample should kept no longer than 3 days before dosage.17 These cut-off values could be discussed and should be confirmed in other studies. Therefore, we encourage IBD physicians to be cautious in interpreting intermediate calprotectin values in daily practice.
IBD physicians should be aware that the variation of calprotectin value under therapy is probably more informative than the absolute value. In addition, several factors could influence calprotectin values in daily practice, for example bacterial or drug-induced enterocolitis could increase calprotectin level.
Our sample size could be considered as a limitation, although it was large enough to provide widely significant results. Our study has also several strengths such as the prospective design and the use of multivariate analysis, which was not performed in the studies pub-lished so far.
In conclusion, fecal calprotectin is an effective surrogate marker of CD activity, which depends on the presence of CD elementary
lesions [even non-ulcerated] and the affected surface but not the ulcerated surface or disease location. Moreover, fecal calprotectin increases with ulceration depth, especially in case of deep ulcera-tions. Although fecal calprotectin is very reliable to detect superficial or deep ulcerations, the best threshold remains a grey zone ranging from 200 to 400 µg/g. These intermediary values warrant repeat-ing measurements before performrepeat-ing morphological examination, to confirm CD activity in daily practice.
Funding
None.Conflict of Interest
None.Authors’ Contributions
F. Goutorbe: acquisition of data; analysis and interpretation of data; drafting of the manuscript. M. Goutte: study concept and design; acqui-sition of data; analysis and interpretation of data; critical revision of the manuscript for important intellectual content. R. Minet-Quinard: acquisition of data [biochemistry]; analysis and interpretation of data. A-L. Boucher: acquisition of data. B. Pereira: statistical analysis. G. Bommelaer: study concept and design; critical revision of the man-uscript for important intellectual content. A Buisson: study concept and design; acquisition of data; analysis and interpretation of data; drafting of the manuscript; guarantor of the article.
References
1. Peyrin-Biroulet L, Loftus EV, Colombel J-F, et al. The Natural History of Adult Crohn’s Disease in Population-Based Cohorts. Am J Gastroenterol 2009;105:289–97.
2. Rutgeerts P, Van Assche G, Sandborn WJ, et al. Adalimumab induces and maintains mucosal healing in patients with Crohn’s disease: data from the EXTEND trial. Gastroenterology 2012;142:1102–11.e2.
0.00
0.00 Fecal calprotectin thresholds
≥200μg/g ≥400μg/g 0.86 [0.68-0.96] 0.69 [0.39-0.91] 0.86 [0.68-0.96]0.76 [0.53-0.87] 0.77 [0.46-0.95] 0.88 [0.67-0.97] 0.56 [0.31-0.79]0.69 [0.39-0.91] Sensitivity Specificity PPV NPV 0.25 0.50 0.75 1.00 0.25 0.50 200μg/g 400μg/g 0.75 1.00 Sensitivity 1-Specificity
Area under ROC curve = 0.7958
[95% confidence interval]: PPV: positive predictive value: NPV: negative predictive value
Figure 3. Receiver operating curve [ROC] illustrating the performances of fecal calprotectin value to detect the presence of superficial or deep ulcerations in
Crohn’s disease.
3. Sandborn WJ, Feagan BG, Hanauer SB, et al. A review of activity indices and efficacy endpoints for clinical trials of medical therapy in adults with Crohn’s disease. Gastroenterology 2002;122:512–30.
4. D’Haens G, Sandborn WJ, Feagan BG, et al. A review of activity indices and efficacy end points for clinical trials of medical therapy in adults with ulcerative colitis. Gastroenterology 2007;132:763–86.
5. Rutgeerts P, Feagan BG, Lichtenstein GR, et al. Comparison of scheduled and episodic treatment strategies of infliximab in Crohn’s disease.
Gastro-enterology 2004;126:402–13.
6. Rutter M, Saunders B, Wilkinson K, et al. Severity of inflammation is a risk factor for colorectal neoplasia in ulcerative colitis. Gastroenterology 2004;126:451–9.
7. Buisson A, Chevaux J-B, Hudziak H, et al. Colonoscopic perforations in inflammatory bowel disease: a retrospective study in a French referral cen-tre. Dig Liver Dis 2013;45:569–72.
8. Lasson A, Stotzer P-O, Öhman L, et al. The intra-individual variability of faecal calprotectin: a prospective study in patients with active ulcerative colitis. J Crohns Colitis 2015;9:26–32.
9. Tibble JA, Sigthorsson G, Bridger S, et al. I. Surrogate markers of intesti-nal inflammation are predictive of relapse in patients with inflammatory bowel disease. Gastroenterology 2000;119:15–22.
10. Costa F, Mumolo MG, Ceccarelli L, et al. Calprotectin is a stronger pre-dictive marker of relapse in ulcerative colitis than in Crohn’s disease. Gut 2005;54:364–8.
11. Sipponen T, Kärkkäinen P, Savilahti E, et al. Correlation of faecal calpro-tectin and lactoferrin with an endoscopic score for Crohn’s disease and histological findings. Aliment Pharmacol Ther 2008;15;28:1221–9. 12. Molander P, Färkkilä M, Ristimäki A, et al. Does fecal calprotectin predict
short-term relapse after stopping TNFα-blocking agents in inflammatory bowel disease patients in deep remission? J Crohns Colitis 2015;9:33–40. 13. Van Rheenen PF, Van de Vijver E, Fidler V. Faecal calprotectin for screen-ing of patients with suspected inflammatory bowel disease: diagnostic meta-analysis. BMJ 2010;341:c3369.
14. Schoepfer AM, Beglinger C, Straumann A, et al. Fecal calprotectin cor-relates more closely with the Simple Endoscopic Score for Crohn’s disease [SES-CD] than CRP, blood leukocytes, and the CDAI. Am J Gastroenterol 2010;105:162–9.
15. Jensen MD, Kjeldsen J, Nathan T. Fecal calprotectin is equally sensitive in Crohn’s disease affecting the small bowel and colon. Scand J
Gastroen-terol 2011;46:694–700.
16. Sipponen T, Savilahti E, Kärkkäinen P, et al. Fecal calprotectin, lactoferrin, and endoscopic disease activity in monitoring anti-TNF-alpha therapy for Crohn’s disease. Inflamm Bowel Dis 2008;14:1392–8.
17. Louis E. Fecal calprotectin: towards a standardized use for inflammatory bowel disease management in routine practice. J Crohns Colitis 2015;9:1– 3.
18. Vieira A, Fang CB, Rolim EG, et al. Inflammatory bowel disease activity assessed by fecal calprotectin and lactoferrin: correlation with laboratory
parameters, clinical, endoscopic and histological indexes. BMC Res Notes 2009;2:221.
19. Mooiweer E, Severs M, Schipper MEI, et al. Low fecal calprotectin pre-dicts sustained clinical remission in inflammatory bowel disease patients: a plea for deep remission. J Crohns Colitis 2015;9:50–5.
20. Langhorst J, Elsenbruch S, Koelzer J, et al. Noninvasive markers in the assessment of intestinal inflammation in inflammatory bowel diseases: performance of fecal lactoferrin, calprotectin, and PMN-elastase, CRP, and clinical indices. Am J Gastroenterol 2008;103:162–9.
21. Røseth AG, Aadland E, Grzyb K. Normalization of faecal calprotectin: a predictor of mucosal healing in patients with inflammatory bowel disease.
Scand J Gastroenterol 2004;39:1017–20.
22. D’Incà R, Dal Pont E, Di Leo V, et al. Calprotectin and lactoferrin in the assessment of intestinal inflammation and organic disease. Int J Colorectal
Dis 2007;22:429–37.
23. D’Haens G, Ferrante M, Vermeire S, et al. Fecal calprotectin is a surrogate marker for endoscopic lesions in inflammatory bowel disease: Inflamm
Bowel Dis 2012;18:2218–24.
24. Mary JY, Modigliani R. Development and validation of an endoscopic index of the severity for Crohn’s disease: a prospective multicentre study. Groupe d’Etudes Thérapeutiques des Affections Inflammatoires du Tube Digestif [GETAID]. Gut 1989;30:983–9.
25. Lennard-Jones JE. Classification of inflammatory bowel disease. Scand J
Gastroenterol Suppl 1989;170:2–6; discussion 16–9.
26. Harris PA, Taylor R, Thielke R, et al. Research electronic data capture [REDCap]-a metadata-driven methodology and workflow process for providing translational research informatics support. J Biomed Inform 2009;42:377–81.
27. Gecse KB, Brandse JF, van Wilpe S, et al. Impact of disease location on fecal calprotectin levels in Crohn’s disease. Scand J Gastroenterol 2015;50:841– 7.
28. Colombel J-F, Sandborn WJ, Allez M, et al. Association between plasma concentrations of certolizumab pegol and endoscopic out-comes of patients with Crohn’s disease. Clin Gastroenterol Hepatol 2014;12:423–31.e1.
29. Ferrante M, Colombel J-F, Sandborn WJ, et al. Validation of endoscopic activity scores in patients with Crohn’s disease based on a post hoc analy-sis of data from SONIC. Gastroenterology 2013;145:978–86.e5. 30. Colombel JF, Sandborn WJ, Reinisch W, et al. Infliximab, azathioprine, or
combination therapy for Crohn’s disease. N Engl J Med 2010;362:1383– 95.
31. Hanauer SB, Feagan BG, Lichtenstein GR, et al. Maintenance inf-liximab for Crohn’s disease: the ACCENT I randomised trial. Lancet 2002;359:1541–9.
32. Nancey S, Boschetti G, Moussata D, et al. Neopterin is a novel reliable fecal marker as accurate as calprotectin for predicting endoscopic disease activity in patients with inflammatory bowel diseases. Inflamm Bowel Dis 2013;19:1043–52.
![Figure 1. Correlation between fecal calprotectin level and Crohn’s disease endoscopic index of severity [CDEIS] in Crohn’s disease.](https://thumb-eu.123doks.com/thumbv2/123doknet/14024304.457688/4.896.83.432.222.651/figure-correlation-calprotectin-crohn-disease-endoscopic-severity-disease.webp)

![Figure 3. Receiver operating curve [ROC] illustrating the performances of fecal calprotectin value to detect the presence of superficial or deep ulcerations in Crohn’s disease.](https://thumb-eu.123doks.com/thumbv2/123doknet/14024304.457688/6.896.181.718.72.414/receiver-operating-illustrating-performances-calprotectin-presence-superficial-ulcerations.webp)
