XV.
COGNITIVE INFORMATION PROCESSING
Prof. Murray Eden Prof. Jonathan Allen Prof. Barry A. Blesser Prof. Francis F. Lee Prof. William F. Schreiber Prof. Donald E. Troxel Prof. Ian T. Young Dr. Brian E. Boyle Dr. Ralph W. Gerchberg Robert P. Bishop Ronald E. Boucher Charles H. Cox James R. Ellis, Jr. Irvin S. Englander Richard S. Goldhor Samuel M. Goldwasser Monson H. Hayes
Su Ling Hsu
Academic and Research Staff Dr. Martin J. Hewlett Dr. Marvin E. Jernigan Dr. Dennis J. Kfoury Dr. Murat Kunt* Dr. Douglas O'Shaughnessy Dr. David M. Ozonoff Dr. Louis-Francois Pau Dr. Armando Roy Yarza
Graduate Students Malik Khan Theodore T. Kuklinski Jay S. Kunin Sze-Ping Kuo Michael D. Lesh Donald S. Levinstone Charles W. Lynn Ulick O. Malone Dennis V. Marsicano Joseph T. Olesik Dr. Stephanie E. Sher Dr. Robert J. Shillman Dr. Robert D. Solomon Dr. Makoto Yasuharait Caleb J. Drake Allison G. Hagerich M. Sharon Hunnicutt Kenneth A. Okin Kenneth P. Wacks Alan Palevsky Douglas B. Paul Roger S. Putnam John N. Ratzel James R. Seeley Mark A. Shalloway Robert J. Steingart
Allen W. Wiegner
Gregory W. ZackA.
THE DISTINCTIVE FEATURES OF THE LETTERS O AND D
Joint Services Electronics Program (Contract DAAB07-75-C-1346) National Science Foundation (Grant ENG74-24344)Robert J. Shillman, Gregory J. Naus
An approach to automatic character recognition based on human perception has been 1-3
reported elsewhere. In this approach, letters are described in terms of an abstract set of functional attributes, each of which can be related to a type of ambiguity between two letters. The relations between the physical attributes derived from the physical image and the functional attributes that specify the letter's identity are called physical-to-functional rules (PFRs). The PFR for the attribute LEG which distinguishes Y from V, F from C, P from D, H from U and A from O has been determined.4
Our current work deals with the attribute SYMMETRY which has been hypothesized to be the attri-bute that distinguishes the letter O from the letter D.
Two experiments were performed: in the first experiment characters from two dif-ferent O-D trajectories were utilized in an attempt to describe the interletter boundary; the second experiment was an investigation to find out whether the labeling of a
Visiting Scientist, Laboratoire de Traitement de Signaux, Lausanne, Switzerland. _Visiting Scientist, The University of Electro-Communications, Tokyo, Japan.
JSEP
JSEP character as an O or a D depends upon the categorization of the left side of the character as functionally curved or functionally straight.
1. Experiment 1
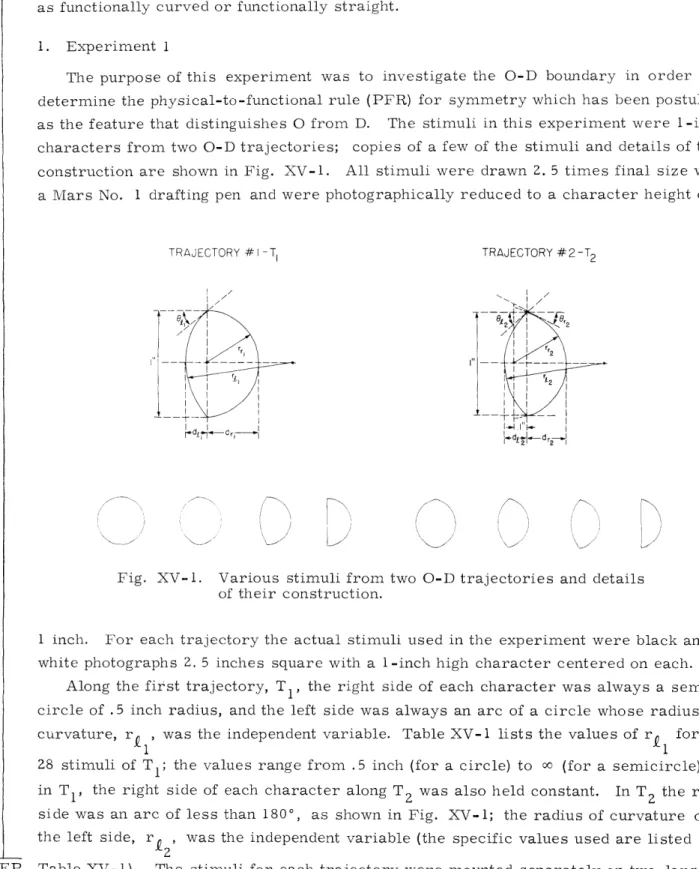
The purpose of this experiment was to investigate the O-D boundary in order to determine the physical-to-functional rule (PFR) for symmetry which has been postulated1 as the feature that distinguishes O from D. The stimuli in this experiment were 1-inch characters from two O-D trajectories; copies of a few of the stimuli and details of their construction are shown in Fig. XV-1. All stimuli were drawn 2. 5 times final size with a Mars No. 1 drafting pen and were photographically reduced to a character height of
TRAJECTORY #I -TI I I --I-- i TRAJECTORY 2-T2 2 12 I- I-I I I~ IL dLi- dI
Fig. XV-1.
Various stimuli from two O-D traj of their construction.ectories and details
1 inch. For each trajectory the actual stimuli used in the experiment were black and white photographs 2. 5 inches square with a 1-inch high character centered on each.
Along the first trajectory, T1, the right side of each character was always a
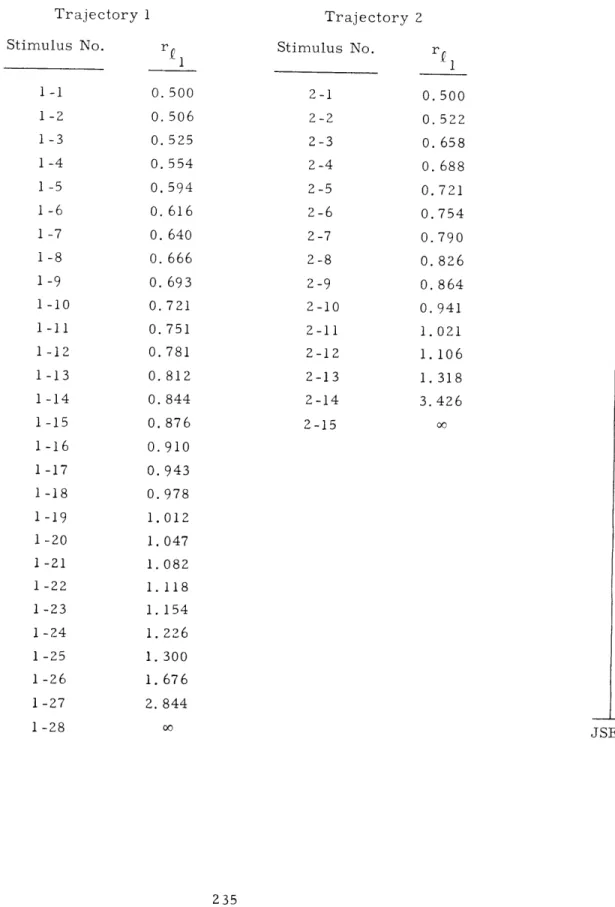
semi-circle of .5 inch radius, and the left side was always an arc of a semi-circle whose radius of curvature, r1 , was the independent variable. Table XV-1 lists the values of r1 for the 28 stimuli of TI; the values range from .5 inch (for a circle) to oc (for a semicircle). As in T1 , the right side of each character along TZ was also held constant. In T2 the right
side was an arc of less than 1800, as shown in Fig. XV-1; the radius of curvature of the left side, r 2, was the independent variable (the specific values used are listed in Table XV-1). The stimuli for each trajectory were mounted separately on two large JSEP
Table XV-1. Values of r for T and T2 used in Experiment i. Trajectory 1 Stimulus No. 1-1 1-2 1-3 1-4 1-5 1-6 1-7 1-8 1-9 1-10 1 -11 1-12 1-13 1-14 1-15 1-16 1-17 1-18 1-19 1-20 1-21 1 -22 1 -23 1-24 1 -25 1 -26 1-27 1-28 Trajectory 2 r f 0. 500 0. 506 0. 525 0.554 0.594 0. 616 0. 640 0. 666 0. 693 0.721 0.751 0. 781 0. 812 0.844 0. 876 0.910 0.943 0.978 1.012 1.047 1.082 1.118 1.154 1. 226 1. 300 1.676 2. 844 Stimulus No. 2-1 2-2 2-3 2-4 2-5 2-6 2-7 2-8 2-9 2-10 2-11 2-12 2-13 2-14 2-15 JSEP rf 0.500 0.522 0. 658 0. 688 0.721 0.754 0.790 0. 826 0. 864 0.941 1.021 1. 106 1. 318 3. 426 0o JSEP
JSEP pieces of white cardboard in ascending order of r .
Twenty members of the -I. I. T. community served as subjects, for all of whom English was their native language. Each subject was seated at a table under normal room light and was instructed to choose the character in each trajectory that was as much like an O as a D. Each subject was tested individually, and the order of presenta-tion of the two trajectories was counterbalanced.
The PFR for SYIMIETRY might have the following form: present
Functional SYTIMMETRY:
f
>
a
not present
The goal, then, is to find a function, f, of some physical variables and a threshold, a, which can be used together to predict letter labeling along both O-D trajectories. (Along any single trajectory there are many functions and thresholds that will work; the general problem is to find a rule that holds along a number of different trajectories.) A variety of hypotheses were generated concerning the specific form of the function f: possible arguments for f are 0], 0r, df, dr, r., and rr. Analysis of the data indicates that the
subjects' labeling criterion along both O-D trajectories can be described by using rp alone. Along T1, the mean value of ri for the ambiguous stimuli is .724 (-r = . 065) and along T2 the mean value is .732 (or- =.074); these values are not statistically
dif-r
ferent (t1 9 =1.36). Other variables were tested, for example, 6fp-r' df/d r , df, fe, but across T1 and T2 all of these "simple" combinations are not consistent.
The data indicate that for r < .728 inch the characters are more likely to be called O than D; however, the character
C
has r f < .728 inch and yet it is more likely to be called D than 0, and the character ] has straight sides (r = cc) yet it is an O. Clearly then, the letter label cannot depend just on the left side of the character. It is more likely that each half of the character is categorized as functionally curved or functionally straight (based on r < .728) and then a comparison is made between the two categoriza-tions. If both sides are categorized alike, then the character is an O; otherwise it isa D. This hypothesis is consistent with the data that were obtained; along both T1 and T , each character had rr < .728 and hence the right sides were all functionally curved,
and so letter label could be predicted by looking at rf alone. Experiment 2 was under-taken to investigate this hypothesis of categorical perception of curvature.
2.
Experiment
2
The purpose of this experiment was to investigate the mapping from physical curva-ture to functional curvacurva-ture using geometrical shapes, and then to determine whether JSEP the obtained mapping is consistent with the results of Experiment 1 in which letterlike
(XV. COGNITIVE INFORMATION PROCESSING)
shapes were used.
The left portion of each stimulus from T
1in Experiment 1 was reproduced in the
JSEP
center of a 2. 5 X 2. 5 inch black and white photograph.
The 28 stimuli thus were
com-posed of arcs, concave to the right, ranging from a semicircle (r= .5 inch) to a straight
line (r=
0);the stimuli were mounted on white cardboard in ascending order of r.
Twenty members of the M. I. T. community served as subjects, for all of whom
English was their native language, and none of them had participated in Experiment 1.
(Twenty-two subjects were tested.
Two of these subjects, however, chose the first
perceptually curved stimulus.
This performance was significantly different from
the performance of all other subjects and hence data from these subjects were not
used in the analysis.) Each subject was told that the experiment concerned shape
recognition and that his task was to choose the shape that was as much like the
straight line as it was like the half circle.
The radius of curvature for the
ambig-uous character chosen by each subject was recorded; the mean value across
sub-jects was r
=
.716 inch (G-r
=
. 128 inch).
This value is not statistically different from
the threshold value determined in Experiment 1 (t
3 8= . 345) in which letterlike shapes
were used.
The results of both experiments indicate the following PFR for CURVATURE:
present
Functional CURVATURE:
r
<
h X 0. 72
notpresent
The character height, h, was inserted in this PFR under the assumption that the PFR
is scale-invariant.
Note also that the PFR may be subject to contextual effects
sim-ilar to those discussed by Kuklinski.
53.
Summary
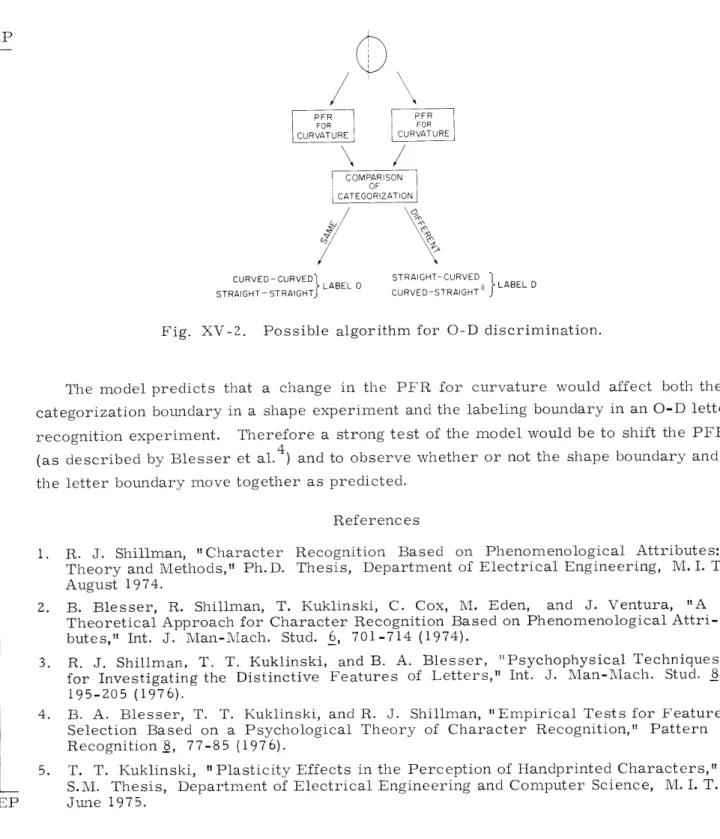
The results of Experiments 1 and 2 are consistent with the following algorithm for
determining letter labels for characters (composed of circular segments) from O-D
trajectories (see Fig. XV-2):
1. The character is broken into left and right parts.
2.
Each part is independently categorized as functionally straight or curved by PFR
for CURVATURE.
3.
The two categorizations are compared. If the two sides are categorized alike,
the character is labeled O; otherwise it is called a D.
The Straight-Straight result was obtained in a different experiment not reported here;
the Curved-Straight case has not been investigated in detail and hence the result
JSEP I PFR PFR FOR FOR CURVATURE CURVATURE COMPARISON
OF
CATEGORIZATIONCURVED-CURVED LABEL O STRAIGHT-CURVED LABEL D
STRAIGHT -STRAIGHTJ CURVED-STRAIGHT L
Fig. XV-2. Possible algorithm for O-D discrimination.
The model predicts that a change in the PFR for curvature would affect both the categorization boundary in a shape experiment and the labeling boundary in an O-D letter recognition experiment. Therefore a strong test of the model would be to shift the PFR (as described by Blesser et al.4) and to observe whether or not the shape boundary and the letter boundary move together as predicted.
References
1. R. J. Shillman, "Character Recognition Based on Phenomenological Attributes: Theory and Methods," Ph.D. Thesis, Department of Electrical Engineering, M. I. T., August 1974.
2. B. Blesser, R. Shillman, T. Kuklinski, C. Cox, M. Eden, and J. Ventura, "A Theoretical Approach for Character Recognition Based on Phenomenological Attri-butes," Int. J. Man-IMach. Stud. 6, 701-714 (1974).
3. R. J. Shillman, T. T. Kuklinski, and B. A. Blesser, "Psychophysical Techniques for Investigating the Distinctive Features of Letters," Int. J. Man-Mach. Stud. 8,
195-205 (1976).
4. B. A. Blesser, T. T. Kuklinski, and R. J. Shillman, "Empirical Tests for Feature Selection Based on a Psychological Theory of Character Recognition," Pattern Recognition'8, 77-85 (1976).
5. T. T. Kuklinski, "Plasticity Effects in the Perception of Handprinted Characters," S.M . Thesis, Department of Electrical Engineering and Computer Science, M. I. T., JSEP June 1975.
(XV. COGNITIVE INFORMATION PROCESSING)
B.
AUTOMATIC RECOGNITION OF THICK STROKE CHARACTERS
JSEP
Joint Services Electronics Program (Contract DAAB07-75-C- 1346) National Science Foundation (Grant ENG74-24344)
Robert J. Shillman
The functional attribute LEG has been proposed1 as the feature that distinguishes Y from V, F from C, P from D, H from U, and A from O. In psychological experiments with thin-line characters (e. g., characters having stroke widths ; .15 mm), we found2 that letter labels could be obtained by using the following physical-to-functional rule
(PFR):
present Functional LEG:
I
1/L
< 0. 17not
present
The rule states that if the physical distance from the lower end of the stroke to the inter-section (k1) is greater than 17% of the entire stroke length (L), then in a neutral context
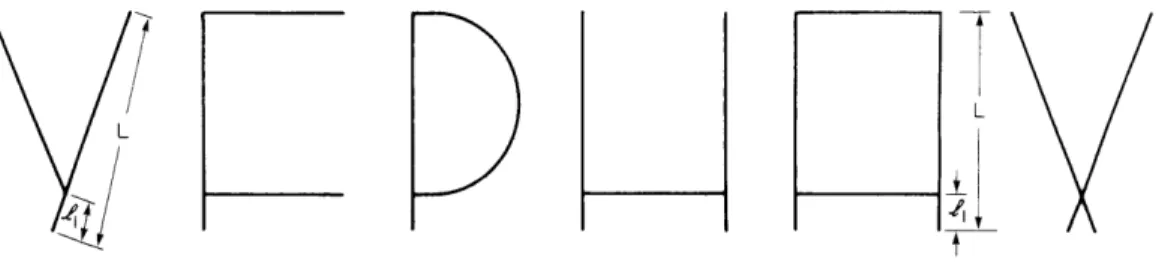
the character is more likely to be called Y ( or F, P, H, A) (see Fig. XV-3).
L
Fig. XV-3. Five characters that are ambiguous because of the transitional state of the functional attribute LEG.
When using "real life" characters, problems arise with computer implementation of this algorithm; for example, typical handprinted characters are not carefully con-structed with straight lines having fine stroke width. Lines drawn with No. 2 pencils typically vary in width from .4 mm to 1. 2 mm. If characters are 6.4 mm high (1/4"), we find stroke width-to-character height ratios (w/h) of 1/16 to 3/16. Figure XV-4 illustrates a typical stimulus character used by Shillman together with three other char-acters having more realistic w/h values. For these characters, it is impossible to apply the PFR for LEG directly, since it is not clear how to measure the length
£1.
In an investigation of this problem, Chow3 found that subjects mapped thick-stroke characters from a V-Y trajectory to functionally equivalent (i. e., having the same letter label)JSEP Y
SKELETON w/h= /IO w/h= 1/8 w/h= 1/6
Fig. XV-4. A skeleton character and 3 characters having realistic w/h values.
in Fig. XV-5. Although this rule for computing f1 /L is the best data fit of Chow' s
hypotheses, the difference between the empirical and the predicted results became greater with the increasing value of w/h. A possible explanation of this deviation is that the perceived length of fl (as defined in Fig. XV-5) decreases with increasing
stroke thickness because of an illusion. It is often observed that a fat person appears shorter than he actually is. The 1 -A estimation of the heights (or lengths) of objects
of different widths is a frequent occurrence Fig. XV-5. in our daily lives (e. g., estimating the height Measurement of k1/E on a character of a wall vs the length of a board, estimating composed of thick strokes. the length of a piece of cloth vs the length of
a piece of thread). In view of common knowl-edge that wide objects appear shorter than narrow objects of the same physical height and in view of the great interest and effort that psychologists have accorded visual illusions,4 it is surprising that there has been no quantitative investigation of the effect of width on the perception of length. The following experiment was carried out to investigate the hypothesis that thick lines appear to be shorter than thin lines of the same length.
Fourteen subjects (M. I. T. students) compared 16 vertical lines of various lengths and widths with a given set of 32 thin vertical lines referred to henceforth as the standard set. For each of the sixteen stimulus lines, each subject was instructed to select the line from the standard set having the same length. The sixteen stimulus lines comprised 4 sets of different widths (W = .40, 3. 81, 6. 35, and 8. 89 mm) at each of four different lengths (LA = 28. 5, 31. 0, 33. 5, and 36. 0 mm); the four thin stimulus lines were of the
same width as the standard lines and served as controls. Each stimulus line was on a separate black-and-white photograph (13 X 10 cm). The standard set of 32 thin com-parison lines was on one large black-and-white photograph (30 X 56 cm); the standard lines varied uniformly in length from 18.3 mm to 38.0 mm, were spaced 1.27 cm apart, and stood vertically from a common baseline. Four different interline separations between the stimulus line and the comparison lines were investigated(d= 2.54, 7.62, 12.7, JSEP and 22.9 cm). Four different masks were used to control the horizontal distance between
(XV. COGNITIVE INFORMATION PROCESSING) a stimulus line and a particular standard line to which it was being compared. Each mask was constructed of white cardboard (23 X 40 cm) and had a vertical viewing window (11.4 X 1. 9 cm) that was placed a fixed distance to the right of a marked position where
a stimulus photograph was glued temporarily. A viewing frame kept the standard set vertical, approximately perpendicular to the line of sight, approximately 2 ft from the place where the subject was seated. By sliding the mask along a horizontal groove at the base of the viewing frame, the subject could compare the given stimulus line, which was temporarily glued to the mask, with each of the standard lines as they appeared through the viewing window. The mask-stimulus pairs were presented in random order; each subject worked at his own pace and the 64 judgments (16 stimuli at each of four different comparison distances) were completed in approximately 45 minutes.
Figure XV-6 shows the mean perceived length Lp vs the actual length LA for each
JSEP 38 36 E 34 o J 32 30 28 0 38 - 32 30 a 28
Fig. XV-6.
28 30 32 34 36 38 LA -Actuol Length (mm) (o) 0 28 30 32 34 36 LA- Actual Length (mm) (C) LA- Actuoal Length (mm) ( b) 38 0 28 30 32 34 36 L - Actual Length (mm)Mean perceived length vs actual length for four different linewidths at four different comparison distances, d: (a) d= 2. 54 cm, (b) d = 7. 62 cm, (c) d = 12. 7 cm, (d) d = 22. 9 cm. The diagonal line Lp = LA is the predicted locus for accurate
JSEP I Fig. XV-7. o x 0 w wW U w _ J 0. E -c a-0) 0, 0 0 E a-20 24 length vs comparison Error bars indicate of 56 judgments (one line-length times for
stimulus line at each of four comparison distances d; the diagonal line is the predicted locus for accurate performance in the length perception task. The results are unam-biguous; at each of the four comparison distances, the perceived lengths of the control
stimuli are accurately judged (P > .4 by sign test), whereas the thicker stimuli are per-ceived as shorter than they actually are. Figure XV-7 summarizes the data; the
-4
apparent shortening of thick lines is reliable across subjects (P < 10-4 by sign test at each of the four comparison distances) and reliable across stimuli (P < 10-5 by sign test). The possibility that the observed illusion is due to extraneous effects, such as mode of presentation5 or visual context, is ruled out by the accurate performance on the control stimuli.
The asymptotic behavior illustrated in Fig. XV-7 is revealing; the illusion increases until ~12 cm (approximately 150 of visual angle) after which it remains constant. (The
relationship between asymptotic value of length contraction and linewidth appears to be linear in the range investigated: Percent Underestimation = .65 X W (mm) - .75, r =
.992 (r > 0, P > .99). The least-square line going through (0, 0) has a .50 slope.) These
0 4 8 12 16
d -Comparison Distance (cm)
Mean percent underestimation of line distance for each of four linewidths. the standard deviation of the mean judgment for each of four different each subject). 5.0 4.0 3.0 2.0 1.0 0.0 -1.0 -2.0 JSEP
(XV. COGNITIVE INFORMATION PROCESSING)
factors, together with subjects' comments, suggest two possible modes of line-length JSEP comparison. The lines could be compared by visually scanning across the tops of the
lines because all of the lines rise from a common baseline; this procedure could only be relied upon for small comparison distances, and would be unreliable for larger dis-tances. It appears that with separations greater than ~15', subjects mentally encode the length of the stimulus line and then compare the encoded value with the standard line. The fact that subjects reported that the thick lines "looked short" indicates that the error is in the encoding process rather than in the subsequent comparison.
The data indicate that for characters having stroke widths greater than . 4 mm the PFR for LEG can be applied as shown in Fig. XV-5, but the threshold value must be modified to take into account the perceived shortening of £1 in the following manner:
present Functional LEG
I
/L 0.17not
(1 -. 005 W mm) not present References1. R. J. Shillman, T. T. Kuklinski, and B. A. Blesser, "Psychophysical Techniques
for Investigating the Distinctive Features of Letters," Int. J. Mlan-Mach. Stud. 8, 195-205 (1976).
2. R. J. Shillman, "Character Recognition Based on Phenomenological Attributes: Theory and Methods," Ph.D. Thesis, Department of Electrical Engineering, M. I. T., August 1974.
3. C. Chow, "Effect of Line Width on Recognition of Vs and Ys," S.B. Thesis, Depart-ment of Electrical Engineering and Computer Science, M. I. T., May 1975.
4. J. 0. Robinson, The Psychology of Visual Illusions (Hutchinson, London, 1972). 5. T. M. Kunnapas, "Influence of Frame Size on the Apparent Length of a Line," J. Exp.
Psychol. 50, 168-170 (1955).
6. C. T. Merryman and F. Restle, "Perceptual Displacement of a Test Mark toward
JSEP C. AUDIO RESPONSE FOR REMOTE TERMINALS
Joint Services Electronics Program (Contract DAAB07-75-C-1346) Jonathan Allen
The design of two special processors has been completed, and one has been con-structed. First, we have constructed a parameter generator processor that converts a narrow phonetic transcription of the utterance to a set of vocal-tract model control parameters. This processor is designed around the AM2901 microprocessor, and uses 4K RAM memory for both program and data. We are now recasting the parametric
algorithms in terms of the new instruction set.
Second, we have designed an all-digital terminal analog synthesizer, which serves as a vocal-tract model. This design uses serial arithmetic, retains 24 bits of precision, and is capable of exercising up to 32 second-order difference equations at a 10-kHz
sample rate. This capability is controlled by a small microprogram, so that the same hardware can support several different models. Implementation of the 90-dip circuit JSEP should be complete by the third quarter of this year.