Publisher’s version / Version de l'éditeur:
Canadian Acoustics, 29, September 3, pp. 60-61, 2001-09-01
READ THESE TERMS AND CONDITIONS CAREFULLY BEFORE USING THIS WEBSITE. https://nrc-publications.canada.ca/eng/copyright
Vous avez des questions? Nous pouvons vous aider. Pour communiquer directement avec un auteur, consultez la
première page de la revue dans laquelle son article a été publié afin de trouver ses coordonnées. Si vous n’arrivez pas à les repérer, communiquez avec nous à PublicationsArchive-ArchivesPublications@nrc-cnrc.gc.ca.
Questions? Contact the NRC Publications Archive team at
PublicationsArchive-ArchivesPublications@nrc-cnrc.gc.ca. If you wish to email the authors directly, please see the first page of the publication for their contact information.
NRC Publications Archive
Archives des publications du CNRC
This publication could be one of several versions: author’s original, accepted manuscript or the publisher’s version. / La version de cette publication peut être l’une des suivantes : la version prépublication de l’auteur, la version acceptée du manuscrit ou la version de l’éditeur.
Access and use of this website and the material on it are subject to the Terms and Conditions set forth at
In-situ sound insulation measurement when a room is very absorptive
Nightingale, T. R. T.; Halliwell, R. E.
https://publications-cnrc.canada.ca/fra/droits
L’accès à ce site Web et l’utilisation de son contenu sont assujettis aux conditions présentées dans le site LISEZ CES CONDITIONS ATTENTIVEMENT AVANT D’UTILISER CE SITE WEB.
NRC Publications Record / Notice d'Archives des publications de CNRC:
https://nrc-publications.canada.ca/eng/view/object/?id=478212dc-8a61-49f7-9569-3e5e9fe9c0d9
https://publications-cnrc.canada.ca/fra/voir/objet/?id=478212dc-8a61-49f7-9569-3e5e9fe9c0d9
In-situ sound insulation measurement when a room is
very absorptive
Nightingale, T.R.T.; Halliwell, R.E.
NRCC-45020
A version of this document is published in / Une version de ce document se trouve dans :
Canadian Acoustics, v. 29, no. 3, Sept. 2001, pp. 60-61
IN-SITU SOUND INSULATION MEASUREMENT WHEN A ROOM IS VERY ABSORPTIVE
Trevor RT Nightingale, Robin Halliwell
Institute for Research in Construction, National Research Council, Ottawa, Ontario, Canada K1A OR6
INTRODUCTION
When a noise source is placed in a room the resulting acoustic energy will be contained in two fields, reverberant and direct. The relative magnitude depends primarily on the amount of absorption, room dimensions, and distance from the source. Transmission loss test methods (ASTM E90, E336, ISO 140) assume that the energy density of the reverberant field will dominate. Consequently, laboratory test chambers are large and have little absorption to ensure that the reverberant field dominates, and the sampling positions are located away from sources. Unfortunately, for in-situ measurements there may be significant absorption in the rooms that may cause a marked deviation from these idealized conditions. This paper investigates the sensitivity of the ASTM E336 to absorption in either the source or receiving room and its effect on the number of microphones needed to sample the resulting field.
MEASUREMENT METHOD AND METRIC
The metric used by most European objective based building codes is the weighted apparent sound reduction index (R’w
ISO 140-4), a single number rating derived from sound pressure level difference measurements made without suppressing flanking and normalized to the area of the separating partition and the receiving room reverberation time (RT). A similar result is obtained when ASTM E336 is applied without suppressing flanking paths. In this summary paper the resulting measure is referred to as the “apparent transmission loss”, (ATL) and is computed using,
ú
û
ù
ê
ë
é
⋅
+
ú
ú
û
ù
ê
ê
ë
é
−
ú
ú
û
ù
ê
ê
ë
é
=
å
å
å
= = = N i N i P N i PRT
N
V
S
Log
N
Log
N
Log
ATL
i receive i source 1 60 1 10 1 10161
.
0
10
10
1
10
10
1
10
, , (1)where P is the resulting sound pressure level (SPL) at the ith sampling position, N is the number of positions in the room, S is the area of the separating element, while V and RT60 are volume
and the reverberation time of the receiving room, respectively. Measurements were made using the four-room Flanking Transmission Facility at the NRC/IRC in which realistic sound transmission paths in multifamily dwellings, including flanking, between rooms can be evaluated under controlled conditions. Each room (volume 35-50 m3) had three incoherent sources below 1.2 kHz and one above this. Nine microphone positions satisfying the ASTM E336 location requirements sampled the SPL.
The ATL was measured in both directions between the three possible room pairs: horizontally separated by a partition wall, vertically separated by a floor, and diagonally where there was no common element (in this special case the normalization area was set to 10m2). These measurements were made for three absorption conditions, Minimum, Partial, and Maximum. Sheets of 50-mm thick open cell foam were placed on room surfaces not involved in a transmission path. This allowed for coverage on three room surfaces, each orthogonal to the others.
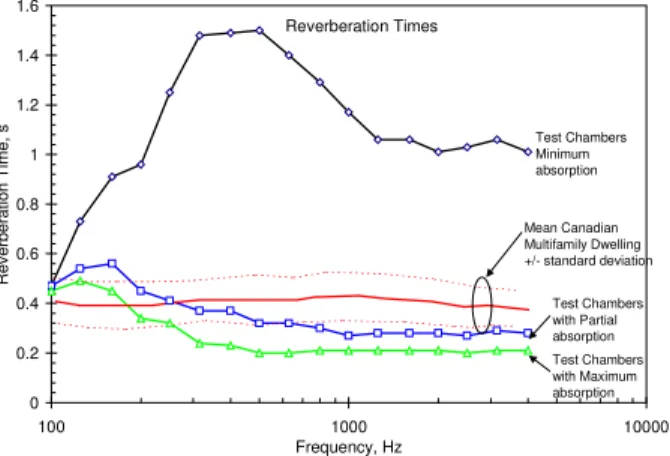
Figure 1 shows that the Partial condition has a receiving room RT that is typically within one standard deviation of the mean
value measured in 300 Canadian multifamily dwellings[1]. The maximum condition represents an extreme case.
Reverberation Times 0 0.2 0.4 0.6 0.8 1 1.2 1.4 1.6 100 1000 10000 Frequency, Hz R e v e rberat ion T im e , s Test Chambers Minimum absorption Mean Canadian Multifamily Dwelling +/- standard deviation Test Chambers with Partial absorption Test Chambers with Maximum absorption
Figure 1: RT for the three absorption conditions examined in this study and the mean for 300 Canadian multifamily dwellings.
MEASURED RESULTS
When all nine microphone positions are used to sample the source and receiving room the mean change in measured ATL (averaged for the three possible room pairs) relative to the case when there is Minimum absorption is typically less than 2.5 dB as shown in Figure 2.
Mean Changes in Apparent Transmission Loss Due to Adding Absorption
-1.5 -1.0 -0.5 0.0 0.5 1.0 1.5 2.0 2.5 63 125 250 500 1k 2k 4k Frequency, Hz C hange, dB re Mi ni mum A b s o rpt ion C ondi ti on
Partial Absorption in Receiving Room Maximum Absorption in Receiving Room Partial Absorption in Source Room Maximum Absorption in Source Room
Figure 2: Change in measured ATL due to adding absorption to either the receiving room or source room.
Below about 200 Hz adding the absorption to either the source or receiving rooms had minimal effect which is consistent with the change in the RT which was not as large as in the mid and high frequencies. A significant change occurred in the frequency range, 250-500 Hz, especially when absorption was added to the source room. A physical explanation for this is not known. However, there was also a significant change in this range when absorption was added to the receiving room so it is speculated that this is related to room dimensions which tended to be similar in two of the three orthogonal directions. Above 500 Hz the change due to adding absorption was typically less than 1.5 dB. If ASTM E413
were applied the resulting change in the single number rating would be typically 1 with a maximum change of 1.
ASTM and ISO test methods use the concept of energy balance to express the power transmitted into the receiving room in terms of the resulting SPL (which is assumed to be reverberant) and the room absorption. If the receiving room does not satisfy the necessary conditions then the resulting receiving room SPL will not vary as -10Log(A) where A is the receiving room absorption in m2. Figure 3, shows that although the correct trends are observed there is a greater change in the absorption correction term than the receiving room SPL. This may indicate the presence of a strong direct field the magnitude of which does not depend on the room absorption.
Change in Receiving Room SPL and Change in 10Log(A) Term
0 2 4 6 8 10 63 125 250 500 1k 2k 4k Frequency, Hz C hange i n Quanti ty , dB re no abs or pti o n
SPL Change -- Partial Absorption SPL Change -- Maximum Absorption 10log(A) Change -- Partial Absorption 10log(A) Change -- Maximum Absorption
Figure 3: Change in receive SPL and absorption correction term.
SENSITIVITY TO ROOM SAMPLING
To investigate the sensitivity of the measurements to the number of sampling positions, mean values for each quantity were computed using a sub set of 2 through 8 positions of the original nine. The mean values for each possible set of positions were then compared to the mean value for the full set of nine and a standard deviation (STD) computed which was then band averaged, using,
(
)
åå
= =−
−
=
5 1 1 2 , , ,1
5
1
j N i j i value subset j nine all meanX
X
N
STD
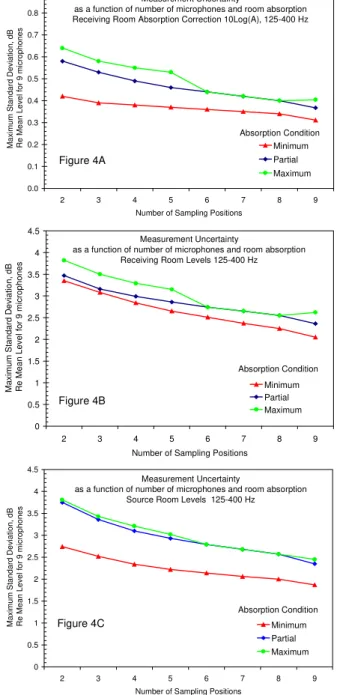
(2) where i is the index to the sampling position and j is the index to the five frequency bands from 125 to 400 Hz, and N is the total number of sampling positions. The Schroeder frequency with Minimum absorption is approximately 400 Hz.In general, Figure 4 shows that the uncertainty (expressed as STD) increases with increasing absorption and/or with reducing the number of sampling positions. The STD of the absorption correction term is an order of magnitude lower than that for the receive or source SPL. It shoud be noted that the measurements below 1.2 kHz were made using three incoherent sources and reducing the number will increase uncertainty in SPL estimates.
DISCUSSION AND CONCLUSIONS
Since the overall accuracy of the ATL will be determined by the sum of all the uncertainties, the uncertainty of the room correction term, 10Log(A), was insignificant relative to those for the SPL. The change in estimates of the mean SPL proved to be sensitive to the number of sampling positions when the room had
significant absorption. Increasing the amount of absorption increased the uncertainty. Thus, the results indicate that measurements in rooms having absorption typical of furnished multifamily dwellings are possible if the room volumes are adequately sampled.
Measurement Uncertainty
as a function of number of microphones and room absorption Receiving Room Absorption Correction 10Log(A), 125-400 Hz
0.0 0.1 0.2 0.3 0.4 0.5 0.6 0.7 0.8 0.9 9 8 7 6 5 4 3 2
Number of Sampling Positions
Max imum S tandard D e v iat ion, dB R e Mean Lev el f o r 9 mi c rophone s Minimum Partial Maximum Absorption Condition Figure 4A Measurement Uncertainty
as a function of number of microphones and room absorption Receiving Room Levels 125-400 Hz
0 0.5 1 1.5 2 2.5 3 3.5 4 4.5 9 8 7 6 5 4 3 2
Number of Sampling Positions
Max imum S tandar d D e v iat ion, dB R e Mean Lev el f o r 9 mic rophones Minimum Partial Maximum Absorption Condition Figure 4B Measurement Uncertainty
as a function of number of microphones and room absorption Source Room Levels 125-400 Hz
0 0.5 1 1.5 2 2.5 3 3.5 4 4.5 9 8 7 6 5 4 3 2
Number of Sampling Positions
Max imum S tandard D e v iat ion, dB R e Mean Lev el f o r 9 mi c rophone s Minimum Partial Maximum Absorption Condition Figure 4C
Figure 4: Uncertainty in measures as a function of absorption conditions and number of sampling positions.
REFERENCES
1.) J.S. Bradley, “Acoustical measurements in some Canadian homes,” Canadian Acoustics, Vol. 14, No. 4, 1986, pp. 19-21, 24-25.