Publisher’s version / Version de l'éditeur:
Proceedings of the 16th International Conference on Port and Ocean Engineering under Arctic Conditions POAC舗01, 2, pp. 1019-1028, 2001-08-12
READ THESE TERMS AND CONDITIONS CAREFULLY BEFORE USING THIS WEBSITE. https://nrc-publications.canada.ca/eng/copyright
Vous avez des questions? Nous pouvons vous aider. Pour communiquer directement avec un auteur, consultez la première page de la revue dans laquelle son article a été publié afin de trouver ses coordonnées. Si vous n’arrivez pas à les repérer, communiquez avec nous à [email protected].
Questions? Contact the NRC Publications Archive team at
[email protected]. If you wish to email the authors directly, please see the first page of the publication for their contact information.
NRC Publications Archive
Archives des publications du CNRC
This publication could be one of several versions: author’s original, accepted manuscript or the publisher’s version. / La version de cette publication peut être l’une des suivantes : la version prépublication de l’auteur, la version acceptée du manuscrit ou la version de l’éditeur.
Access and use of this website and the material on it are subject to the Terms and Conditions set forth at
Iceberg risk to seabed installations on the Grand Banks
Croasdale, Ken; Brown, Rob; Campbell, Patrick; Crocker, Greg; Jordaan, Ian; King, Tony; McKenna, Richard; Myers, Robert
https://publications-cnrc.canada.ca/fra/droits
L’accès à ce site Web et l’utilisation de son contenu sont assujettis aux conditions présentées dans le site LISEZ CES CONDITIONS ATTENTIVEMENT AVANT D’UTILISER CE SITE WEB.
NRC Publications Record / Notice d'Archives des publications de CNRC: https://nrc-publications.canada.ca/eng/view/object/?id=9babcf35-63d4-4372-ad1e-49d926b6392b https://publications-cnrc.canada.ca/fra/voir/objet/?id=9babcf35-63d4-4372-ad1e-49d926b6392b
ICEBERG RISK TO SEABED INSTALLATIONS ON THE GRAND BANKS
Ken Croasdale1, Rob Brown2, Patrick Campbell3, Greg Crocker4, Ian Jordaan5, Tony King2, Richard McKenna2, Robert Myers3
1
K.R. Croasdale and Associates, Calgary, AB, CANADA
2
C-CORE, St. John's, NF, CANADA
3
Canadian Seabed Research Ltd., Porter's Lake, NS, CANADA
4
Ballicater Consulting Ltd., Kingston, ON, CANADA
5
Memorial University of Newfoundland, St. John's, NF, CANADA
ABSTRACT
The design of seabed installations and pipelines on the Grand Banks is influenced by the presence of icebergs. Particularly for those installations placed below the mudline, scouring icebergs are of concern. In the present study, data from the Grand Banks Scour Catalogue (GBSC) including a recent update from wellsite surveys were summarized for the northeastern portion of the Grand Banks. Scour frequency was determined from the historical presence of icebergs, drift speeds and iceberg draft data, and was compared with frequency estimates derived from the observed density of scour marks on the seabed and the likely maximum age of these marks (2500 years). The probability of iceberg contact with installations below the mud-line was determined from the dimensions of the scour marks (from the GBSC) and their frequency. In addition, iceberg scour mechanisms were investigated through a comprehensive probabilistic model of the process, incorporating iceberg hydrostatic characteristics and seabed reaction forces.
POAC ‘0 1
Ottawa, Canada
Proceedings of the 16 International Conference onth Port and Ocean Engineering under Arctic Conditions POAC’01 August 12-17, 2001 Ottawa, Ontario, Canada
INTRODUCTION
On Canada’s East Coast, seabed facilities are at risk of contact and potential damage from icebergs. Safe and economic utilization of subsea technologies requires that the risk of damage be reduced to an acceptable level. The aim of the present study was to consolidate and assess our current knowledge base of iceberg scour on the Grand Banks, and establish a risk framework from which intelligent decisions can be made regarding the relative benefits and costs of different protection methods. Full details of this study are found in KRCA (2000). Critical knowledge gaps, and prioritised recommendations for R&D to address these deficiencies have been provided.
SCOUR DATA FOR THE BRAND BANKS Grand Banks Scour Catalogue
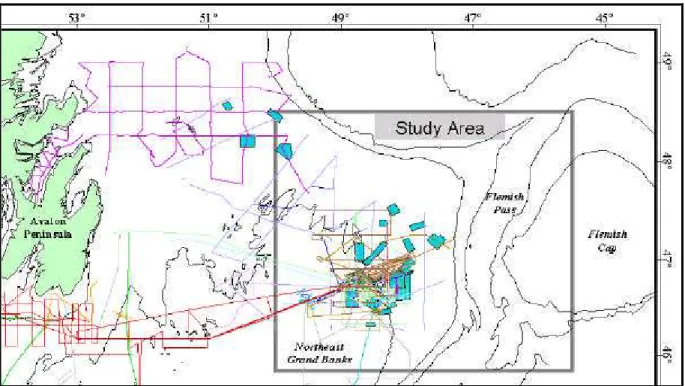
The Grand Banks Scour Catalogue (GBSC) is a compilation of many individual seabed surveys and is an up-to-date compilation of all ice scour data collected in the region since 1979. The GBSC now contains records of 5720 scour features including 3887 individual scours (furrows or linear features) and 1773 iceberg created pits (craters or areal features) (Canadian Seabed Research, 2000). The present study focuses on the area shown in Figure 1.
Figure 1 Study area showing survey lines and survey areas
Scour Density
Scour density can be inferred from sidescan and multibeam sonar. Characteristics of many of these devices are given in KRCA (2000). The GBSC has been used to assess scour density (number of scours/km2). It is noted that the highest scour densities are associated with the
most recent surveys using modern higher resolution equipment - this suggests scour events were either not visible on the lower resolution data or not interpreted on these earlier surveys. Scours in sand in water depths less than about 100m are periodically reworked and ultimately destroyed by bottom currents, so scour densities in sand are significantly less than recorded in gravels and other soils. Interpreter variability can lead to a minimum of 30% variation in scour density estimates.
Mean scour density values were calculated within selected bathymetric intervals. The mean scour density is 0.56 scours/km2 for the total survey coverage in water depths of less than 110m, and 0.86 scours/km2 for the total coverage in water depths greater than 110m. The highest mean density, at 1.2-1.3 scours/ km2, occurs between 100-150m water depths. Lower density in deeper water may be related to a smaller number of deep ice keels. The progressively lower mean density values in shallower water are probably due to the reworking of scoured sediments by increased levels of hydrodynamic activity which has led to the obliteration of some scours over time, particularly those formed in sands.
Scour Frequency
In regions where scours are more frequent, repetitive surveys give the best assessment of scour frequency - which is a vital ingredient for risk assessment. On the Grand Banks, determining scour frequency is a major issue for accurate risk assessment. Repetitive surveys have been conducted in a few areas of the Grand Banks e.g. in the North Hibernia region in 1979 and 1990. All but one of these repetitive mapping surveys have detected no new scours over the period covered. In only one survey was one new scour detected in 11 years suggesting a scour frequency of 1.9x10 -4 /km2/yr (Table 1).
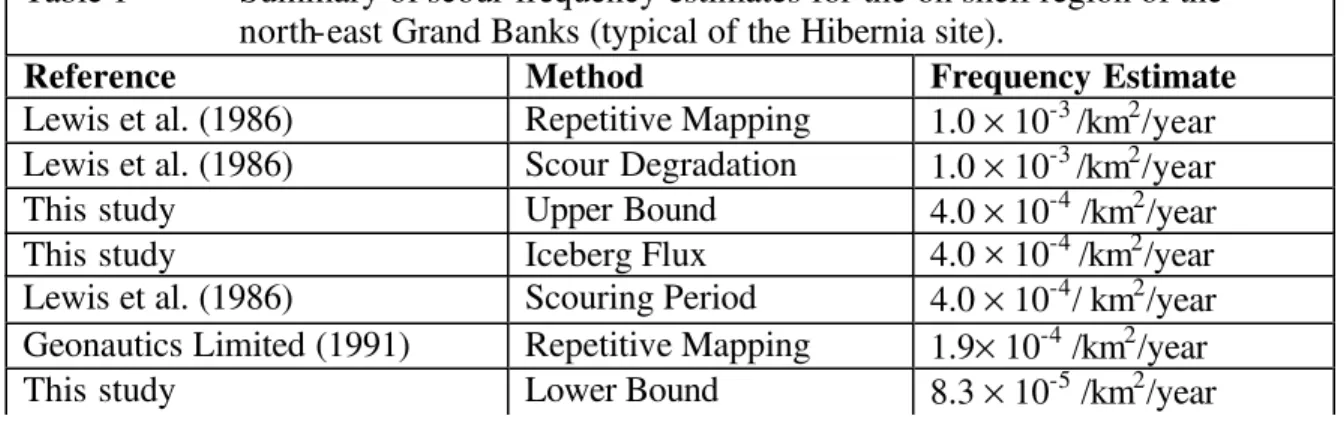
One bounding approach is to assume that all detectable scours occurred over a certain geological time period - the longest being about 12,000 years before present and the shortest being about 2500 years. For the Hibernia region, this yields a lower bound frequency of 8.3 x 10 -5 /km2/year and an upper bound of 4.0 x 10⁻⁴ /km2/year (Table 1).
Other methods of establishing scour frequency are based on either scour dating or on a statistical analysis of iceberg fluxes, drift rates and draft distributions. The assessment of scour frequency from iceberg flux is an extension of the methodology of assessing collision frequencies with surface piercing platforms. It offers a potentially less uncertain approach to
Table 1 Summary of scour frequency estimates for the on-shelf region of the north-east Grand Banks (typical of the Hibernia site).
Reference Method Frequency Estimate
Lewis et al. (1986) Repetitive Mapping 1.0 × 10⁻³ /km2/year
Lewis et al. (1986) Scour Degradation 1.0 × 10⁻³ /km2/year
This study Upper Bound 4.0 × 10⁻⁴ /km2/year
This study Iceberg Flux 4.0 × 10⁻⁴ /km2/year
Lewis et al. (1986) Scouring Period 4.0 × 10⁻⁴
/ km2/year Geonautics Limited (1991) Repetitive Mapping 1.9× 10⁻⁴ /km2/year
the problem. It also allows a coherent transition from scour frequency to collision frequency with sea floor structures of various heights. This approach has been used in a simple fashion for the Hibernia region and yields about 4x10⁻⁴/km2/year (Table 1).
Scour Dimensions
Scour depth data suffer from the limitations of instrument resolution, which leads to underestimation of shallow scours and statistics biased to deeper scours. On the other hand, the older deeper scours may have infilled preferentially. As well, variability in scour depth across the scour width and length may be important for determining risk to seabed installations.
Scour lengths are often simply recorded as the length visible in the survey, even though the scour extends beyond. This means that longer scours are often under-represented in the database. The present length statistics (e.g. Table 2) do not include corrections for survey swath width.
Table 2 Comparison of scour characteristics from present study (P.S.) and Terra Nova (1997)
Length (m) Width (m) Depth (m) Mean Std. Mean Std. Mean Std.
Terra Nova 565 618 25 14 0.60 0.30
P.S. (all) 542 743 26 17 0.72 (0.39)† 0.70
P.S.(≤110m water depth) 560 714 24 17 0.50 (0.29)† 0.40
P.S.(>110m water depth) 523 775 28 18 0.88 (0.68)† 0.82
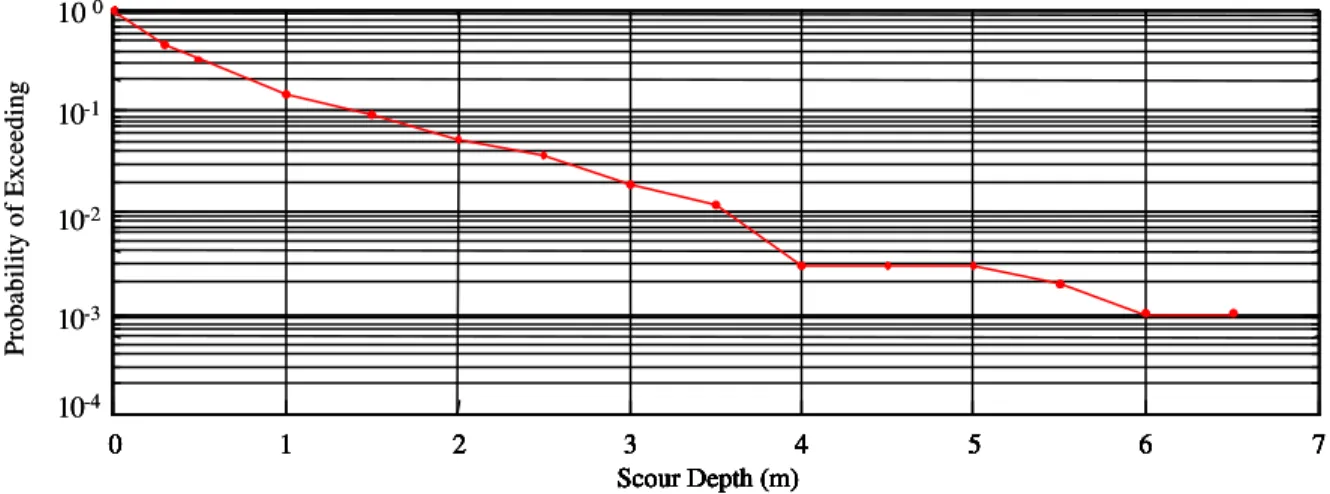
†
mean depth values in brackets were calculated from exceedence curves, e.g. Figure 2 The maximum scour depth in the GBSC is 7m, and this occurred in the 150 - 170m water depth range. In the 90 - 110m water depth range, the maximum depth is 3m with a mean of 0.48m. The overall depth distribution for the study area is given in Figure 2. In the 90 - 110m water depth range, mean and maximum widths are 26m and 200m respectively and lengths are 650m (mean) and 9,400m (maximum). The data from the present study are listed in Table 2 and compared with data summarized for the Terra Nova development. In general, weak correlations were found to exist between scour characteristics such as depth, width, length, water depth, sediment type and orientation.
ICEBERG SCOURING MECHANISMS Iceberg Scour Model
Scour depth limits due to iceberg strength depend on the geometry of the keel, as well as the ice and soil strengths. These complex interactions have been investigated in a comprehensive model of environmental driving forces, ice scour forces, iceberg characterization and hydrostatics. McKenna et al. (1999) document some of these issues, but considerable development has been made since then. The present model includes iceberg hydrostatics in pitch and heave, seabed slope, kinetic energy effects, and the environmental driving forces - wind, wave, tidal current, inertial current and wind-driven Ekman current. This model is
applied within a Monte Carlo simulation framework to estimate scour length and depth distributions.
Figure 2 Depth distribution for all scours in the survey area (including pits)
The operation of the model is a two-step process for each iceberg. The first step considers free drift of the iceberg before contact with the seabed and drift is simulated from the balance of environmental forces. The final step involves the dissipation of the iceberg's kinetic energy from the sum of scour and environmental forces, and through the adjustment of iceberg heave, pitch angle and scour depth. The scour length can the n be computed when the iceberg has depleted its kinetic energy and when the scour forces exceed the driving forces.
Under the PRISE program, C-CORE developed an improved model for computing horizontal and vertical soil forces due to scouring ice features. It is based, in part, on centrifuge experiments conducted at C-CORE. Since details of this model and the data are proprietary in nature, the scour force model presented by Been et al. (1990) is used here. The model uses effective strength parameters and assumes drained conditions during scouring. Assumptions include:
• ice keels are wide compared with keel depth and soil reaction forces are calculated on a unit width basis;
• the approach does not include normal soil reaction force below the keel, nor the sliding resistance on the base of the scour due to the normal force; and
• based on the PRISE work, it is believed that the model presented by Been et al. (1990) underestimates soil forces and therefore overestimates scour depth.
Modelled Iceberg Behaviour
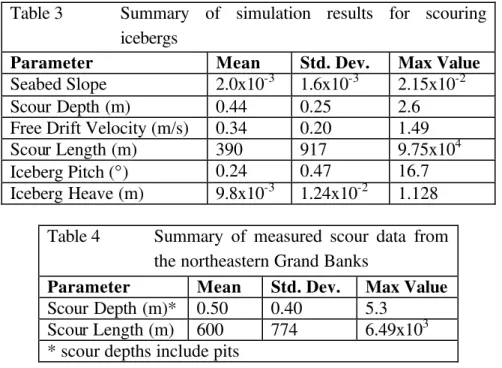
A review of environmental driving forces indicates that current, winds and waves are sufficient to induce scour to the depth levels observed (e.g. to about 2.6m). As well, modelled scour lengths of several kilometers appear to be quite likely and these ma tch the data. The same analysis gives typical results for iceberg heave and pitch during the scouring process. Mean values are quite small e.g. 0.24 degrees pitch and 0.01m heave. However, maximum values are 17º pitch and 1.1m heave.
0 1 2 3 4 5 6 7 Scour Depth (m) 0 1 2 3 4 5 6 7 Scour Depth (m) 0 1 2 3 4 5 6 7 Scour Depth (m) 0 1 2 3 4 5 6 7 Scour Depth (m) Probability of Exceeding 10-1 10-4 10-3 10-2 10 0 0 1 2 3 4 5 6 7 Scour Depth (m) 0 1 2 3 4 5 6 7 Scour Depth (m) 0 1 2 3 4 5 6 7 Scour Depth (m) 0 1 2 3 4 5 6 7 Scour Depth (m) Probability of Exceeding 10-1 10-4 10-3 10-2 10 0
A comparison of some basic statistics of iceberg scour behaviour for the modelled and measured results is given in Tables 3 and 4. There has been no attempt to fit the model to the data and all input distributions are representative of conditions in this area. A significant difference is found in the modelled scour lengths, which is quite sensitive to the assumed iceberg hydrostatics. Since information on underwater iceberg shape is limited, the hydrostatic characterization of icebergs is identified as a significant uncertainty when modelling the scour process.
Table 3 Summary of simulation results for scouring
icebergs
Parameter Mean Std. Dev. Max Value
Seabed Slope 2.0x10⁻³ 1.6x10⁻³ 2.15x10⁻²
Scour Depth (m) 0.44 0.25 2.6
Free Drift Velocity (m/s) 0.34 0.20 1.49
Scour Length (m) 390 917 9.75x10⁴
Iceberg Pitch (°) 0.24 0.47 16.7
Iceberg Heave (m) 9.8x10⁻³ 1.24x10⁻² 1.128
Table 4 Summary of measured scour data from the northeastern Grand Banks
Parameter Mean Std. Dev. Max Value
Scour Depth (m)* 0.50 0.40 5.3
Scour Length (m) 600 774 6.49x10³
* scour depths include pits
ICEBERG RISK TO SEABED FACILITIES Target Safety Level
In reviewing potentially relevant standards (e.g. CSA S471, 1992), it was concluded that wellheads should be considered Safety Class 1, since failure could lead to significant hydrocarbon release. In this case, the CSA Standard recommends an annual target safety level of 10-5. The annual target level for a single well or a well cluster installation (including glory holes) is therefore 10-5. Up to about ten entities can be treated individually at the 10-5 level. If the number of wells or clusters exceeds ten, it is recommended that the overall safety level be maintained at 10-4, thereby increasing the safety requirement for each installation.
Iceberg Risk to Seabed Installations
The risk of iceberg contact with a variety of subsea installations has been considered. Experience suggests they can be classified according to whether they are buried beneath or penetrate above the mudline. In the first instance, only scouring icebergs are of concern, while freely floating icebergs are also of concern in the latter case.
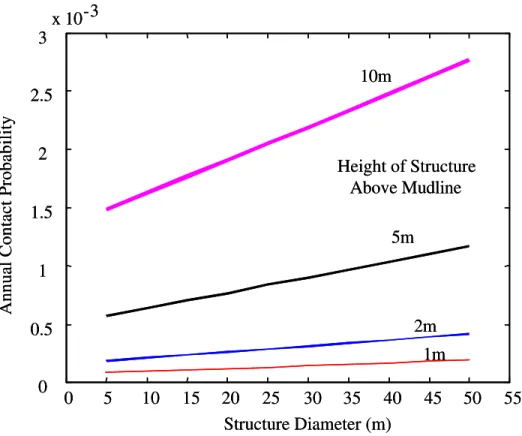
The annual contact probability from freely floating icebergs can be estimated from the average iceberg population (per unit area), average drift speed, and the sum of iceberg keel and structure widths at the point of contact. Annual contact probability is approximately 2 × 10⁻³ for a 10 m high by 25 m diameter structure in about 100 m of water on the NE Grand Banks. Results for other structure dimensions are shown in Figure 3 and details of the calculations are given in KRCA (2000). The annual probability of contact from scouring icebergs for a structure placed below the mudline is less than 10-5. Although contact probability from scouring icebergs depends on the scour frequency and scour dimensions, the advantages of burial below the mudline are significant.
Figure 3 Annual contact probabilities calculated for free-floating icebergs and structures above the mudline
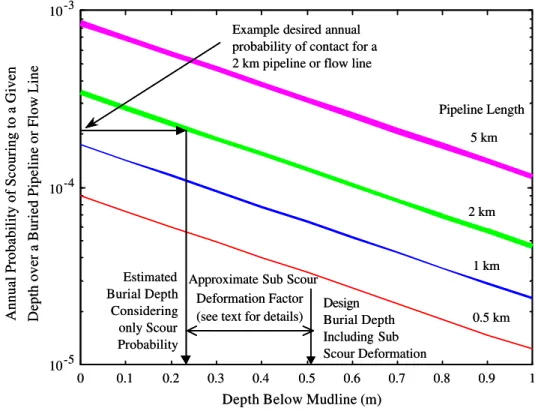
For scouring icebergs, the risk of contact decreases with increasing burial depth. For holes smaller than the scour width, the probability of contact decreases according to the probability of exceedence for the scour depth distribution. Typically, an order of ma gnitude reduction in contact probability can be achieved by burial 1 m below the mudline. For large holes, the iceberg may also pitch into the hole thereby increasing the risk of contact. This has been approximated from the excess draft distribution for scouring icebergs derived from a numerical model of the scour process for the NE Grand Banks. The probability of iceberg contact depends on the extent of the structure and the position of the top of the structure relative to the mudline.
0 5 10 15 20 25 30 35 40 45 50 55 0 0.5 1 1.5 2 2.5 3 x 10⁻³ Structure Diameter (m)
Annual Contact Probability
10m 5m 2m 1m Height of Structure Above Mudline 0 5 10 15 20 25 30 35 40 45 50 55 0 0.5 1 1.5 2 2.5 3 x 10⁻³ Structure Diameter (m)
Annual Contact Probability
10m 5m 2m 1m Height of Structure Above Mudline
In many cases, the reliability of an installation will be much greater than would be inferred by equating iceberg contact with release of hydrocarbons to the environment. A significant safety margin can be achieved for wellhead installations by considering the effectiveness of automatic shut-off valves in the wellbore.
Figure 4 Method for determining design burial depth for a 2 km flow line
ICEBERG RISK TO MARINE PIPELINES Risk Considerations
Risk of damage to a buried subsea pipeline depends on the scour frequency, scour length, scour depth and pipeline length. Based on the iceberg scour data presented earlier in this paper, the annual frequency of iceberg scours over buried pipelines has been estimated. The results illustrated in Figure 4 assume a uniform distribution of scour orientations. Sub-scour soil deformations should also be considered in the risk assessment process and a typical value is shown in the figure (more detail given in KRCA, 2000). For the NE Grand Banks, the annual probability of iceberg damage for a backfilled pipeline with a cover depth of 1 m is estimated at between 10-5 and 10-4 per km. Of this, between 10-3 and 10-4 per km is the probability of any iceberg scouring across the pipeline and the remainder is the probability of a scour reaching sufficient depth to damage the pipeline.
For offshore pipelines, the state of practice has not reached a full reliability based design. Many codes, including the section of CSA Z662 (1999) pertaining to offshore pipelines, require the verification of limit states under the application of the 100-year design
0 0.1 0.2 0.3 0.4 0.5 0.6 0.7 0.8 0.9 1
10-5
10-4
10-3
Depth Below Mudline (m)
Annual Probability of Scouring to a Given Depth over a Buried Pipeline or Flow Line
Example desired annual probability of contact for a 2 km pipeline or flow line
Estimated Burial Depth Considering only Scour Probability Design Burial Depth Including Sub Scour Deformation Approximate Sub Scour
Deformation Factor 0.5 km 1 km 2 km 5 km Pipeline Length
(see text for details)
0 0.1 0.2 0.3 0.4 0.5 0.6 0.7 0.8 0.9 1
10-5
10-4
10-3
Depth Below Mudline (m)
Annual Probability of Scouring to a Given Depth over a Buried Pipeline or Flow Line
Example desired annual probability of contact for a 2 km pipeline or flow line
Estimated Burial Depth Considering only Scour Probability Design Burial Depth Including Sub Scour Deformation Approximate Sub Scour
Deformation Factor 0.5 km 1 km 2 km 5 km Pipeline Length
environmental load. Since ice scours impart displacements to buried pipelines, design scours are characterized typically in terms of their depth and width.
Buried Pipeline Response to Iceberg Scour
A finite element analysis was conducted to assess the influence of sub-scour soil deformation on a buried pipeline. It is shown (in KRCA, 2000) that for a scour depth of 1.5m and a 914mm pipeline with the pipe crown 1m below the scour, the peak tensile strain in the pipe is approximately 2% (the CSA requires verification of strain limits greater than 0.75%). Required cover depths will be less for shallower scours. Pipe response tends to be relatively sensitive to scour dimensions, pipeline material, diameter, wall thickness and soil parameters.
SUMMARY
Assessment of R&D Needs
Due to the foresight of the Geological Survey of Canada and others, there are considerable amounts of iceberg scour data for the Grand Banks. The data are now maintained in the Grand Banks Scour Catalogue (Canadian Seabed Research, 2000). There are some limitations of accuracy due to sensor resolution and interpreter subjectivity and skill, but the data are very important input to risk assessment and the design of seafloor facilities. Although the data give good information on scour density, the extraction of scour frequency, which is the starting point for accurate risk assessment, is not so easy. Because the scouring rate is so low, the use of repetitive scour surveys has, to date, not been able to provide adequate data to reliably assess scouring frequency. Scour depth data are also important in assessing the risk of buried facilities and are subject to some uncertainties due to instrument resolution limits.
With the data available at this time, and recognizing the uncertainties noted above, the contact frequency with a typical individual sea floor facility is estimated to be 10-4 to 10-3. According to the risk philosophy laid out in CSA S471, and assuming contact leads to significant oil discharge, then this risk is too high. It is recognized that contact by an iceberg with a structure such as a wellhead does not necessarily lead to an uncontrolled discharge (because of wellbore control valves). Nevertheless, most operators have chosen to reduce this risk by putting the top of such equipment below the mud line. However, because of uncertainties in both scour frequency and scour depths, the risk level as a function of depth of burial is subject to uncertainty.
Recommendations for Future Work
R&D required to reduce the uncertainties in scour frequency and scour depth can be related to two separate lines of approach. These are either (i) use the scour record, or (ii) simulation of scour statistics from iceberg statistics combined with ice/seafloor interaction and limit models. It is recommended that both these approaches be exercised and refined. In fact, when both approaches give similar risk values we might expect that the outcome has some credibility. It should be noted that the second approach is also required to assess risk to structures that protrude above the sea floor.
ACKNOWLEDGEMENTS
Funding for this work to K.R. Croasdale and Associates was provided by the National Research Council Canada through the PERD Ice-Structure Interaction Program.
REFERENCES
Been, K., Palmer, A. and Comfort, G. (1990). Analysis of Subscour Stresses and Probability of Ice Scour-Induced Damage for Buried Submarine Pipelines, Report to PERD/COGLA, Department of Energy, Mines and Resources, Government of Canada, 204p.
Canadian Seabed Research Ltd. (2000) The 1999 update of the Grand Banks Scour Catalogue. Contract report for the Geological Survey of Canada, Atlantic.
CSA S471 (1992) General requirements, design criteria, the environment, and loads. Standard CAN/CSA-S471-92.
CSA Z662 (1999) Oil and gas pipeline systems, 3rd Edition. Standard CAN/CSA Z662-99. Geonautics Limited (1991). East Coast Repetitive Mapping, 1979/1990. Environmental Studies Research Funds Report.
KRCA (2000) Study of iceberg scour and risk in the Grand Banks region, PERD/CHC Report 31-26, available at www.chc.nrc.ca/english/Cold%20Regions/PERD/perd.htm (collaboration between K. R. Croasdale & Associates, Ballicater Consulting, Canadian Seabed Research, C-CORE and Ian Jordaan & Associates).
Lewis, C., Parrot, D., d’Apollonia, S., Gaskill, H., and Barrie, J. (1986). Methods of estimating iceberg scour rates on the Grand Banks of Newfoundland, In: Ice Scour and Seabed Engineering, ESRF Report No. 49, p. 229-254.
McKenna, R.F, Crocker, G. and Paulin, M.J. (1999) Modelling Iceberg Scour Processes on the Northeast Grand Banks, in Proceedings of 18th International Conference on Offshore Mechanics and Arctic Engineering (OMAE ’99), St. John’s, NF, Canada.
Terra Nova (1997) Terra Nova Development Application, Design Environmental Criteria, Prepared by Petro-Canada on Behalf of the Terra Nova Proponents (on CD ROM).