Supplementary Information for:
Quantification of Methane Sources in the Athabasca Oil Sands
Region of Alberta by Aircraft Mass-Balance
S. Baray
1, A. Darlington
2, M. Gordon
3, K.L. Hayden
2, Amy Leithead
2, S.-M. Li
2, P.S.K. Liu
2, R.L.
Mittermeier
2, S.G. Moussa
2, J. O’Brien
2, R. Staebler
2, M. Wolde
4, D. Worthy
5, R. McLaren
15
1. Centre for Atmospheric Chemistry, York University, Toronto 2. Air Quality Research Division, Environment and Climate Change Canada, Toronto 3. Earth and Space Science and Engineering, York University, Toronto 4. National Research Council of Canada, Ottawa 5. Climate Research Division, Environment and Climate Change Canada, Toronto, Canada Corresponding authors: Robert McLaren (rmclaren@yorku.ca) & Katherine Hayden (katherine.hayden@canada.ca)
Assessment of Uncertainties
10
Tables S1-6 show the results of the sensitivity analysis to estimate contributions to total uncertainty.
Parameters contributing to uncertainties depend on the mass balance method used and the screen-based
(Eq. 1) or the box-approach (Eq. 2). Minor uncertainties that contribute to both methods are errors in the
CH
4mixing ratio measurement and wind measurements. CH
4measurement errors from the instrument
are <1%. Measurements of trace species from other instruments were used qualitatively to deduce
15plume origins, thus they do not contribute to total uncertainties. In a previous study, a Monte Carlo
simulation was used to demonstrate the wind measurements contribute <1% to the change in
uncertainties (Gordon et al., 2016). A significant source of uncertainty for both mass balance methods is
the extrapolation of CH
4mixing ratios to the surface for ground-level plumes. Surface extrapolation
uncertainties are highly variable with flight, consistent with the literature. Cambaliza et al. (2014) found
20surface extrapolation uncertainties to be 4, 9 and 16% for three different mass balance flights downwind
of Indianapolis to determine CH
4fluxes, and Gordon et al., 2016 found this to be 15% and 26% for two
Oil Sands flights for the CNRL facility. The uncertainty depends on the range of surface mixing ratios
resulting from fitting varying extrapolation methods. We derive a range of possible emissions rates by
directly overhead (Aug 16 Flight 4A, SML and SUN). Half-guassian extrapolations are used where fits
are above constraints (r
2>0.40). Future studies can further minimize these uncertainties with
simultaneous ground-level mixing ratio measurements.
Additional uncertainties specific to the box-approach (Eq. 2) are assessed according to the methodology
5described in Gordon et al., 2016. Contributing factors are: (1) the uncertainty in the box-top height
(affecting the E
CHand E
CVterms), estimated by reducing the box height by 100 m, (2) changes in air
mass density within the volume of the box (affecting E
CM), estimated using the minimum and maximum
of pressure and temperature ratios derived from surrounding meteorological stations, (3) inclusion of
the estimated vertical turbulence term (E
CVT), and (4) uncertainty in the mean CH
4mixing ratio at the
10
box-top (affecting E
CV) determined from the 95% confidence interval (2σ/√n) of interpolated
measurements. These terms are recalculated according to the range of possible input parameters in order
to derive resulting uncertainties in the emissions rates. Screen-approach specific uncertainties (Eq. 1)
are mostly due to the variability in the background mixing ratio [CH
4]
B, determined using the outer
edges of the screen away from plume sources (screen flights) and upwind measurements (box flights).
15For each flight measurements from multiple background regions (>1km) occurring closely in time are
used as possible inputs, which are identified clearly due to the high CH
4mixing ratios observed from
plumes. Other sources of uncertainty are the vertical extent of the screen (upper bound, z) and the
horizontal boundaries (s
1-s
2) of individually characterized plumes. These plume boundaries are
expanded and contracted to derive a range of possible integrals.
20Uncertainties for each mass balance flight are added in quadrature to derive a range of possible
emissions rates. Estimates for the same source category within a facility, as well as total estimates for
the same facility, are treated as independent estimates and combined using an error-weighted mean
(1/
σ
2).
Meteorological Conditions
Tables S1-6 (bottom) present various flight details and meteorology. Flights used are those with a high
number of aircraft transects (
≥6) that show full characterization of plume vertical extent. Boundary
layer heights are determined using visual inspection of dew point temperature alongside LIDAR
backscatter reports from ground-site AMS13 during flight times. Ground temperature and wind
5direction measurements are based on ground-site data at AMS13 over the course of the day. Wind
speeds shown are from interpolated screens ± 1σ.
10
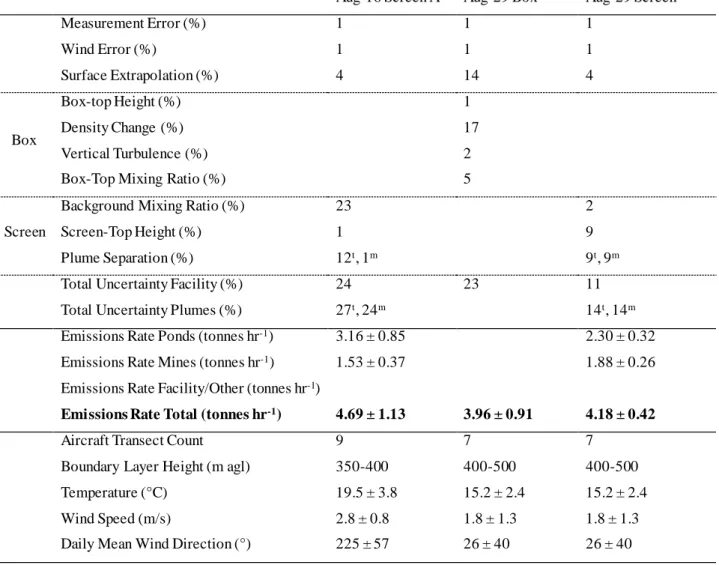
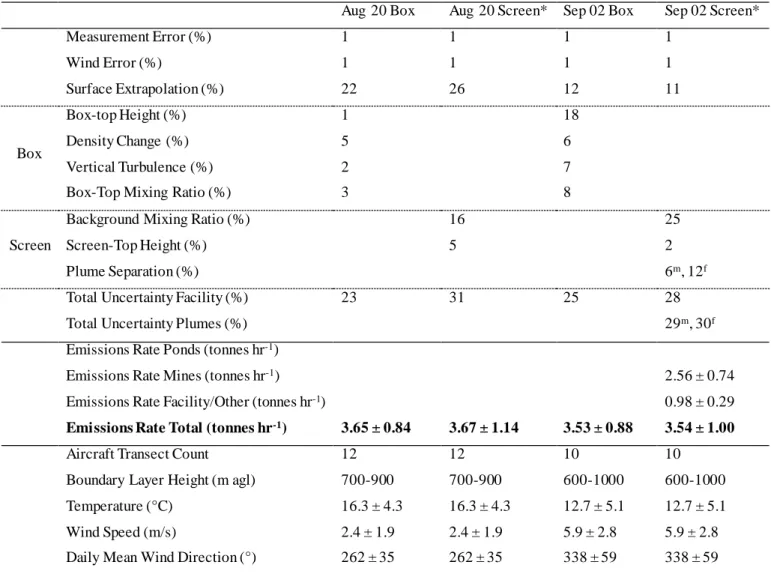
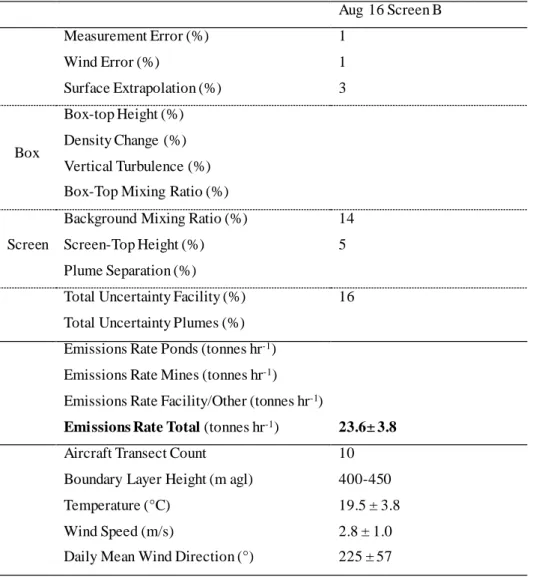
Table S1-6: Top: Sensitivity analysis displaying uncertainty contributions (1σ) shown in percent
change from the best-estimate emissions rate, added in quadrature for totals. Uncertainties in
individual plumes are noted with superscripts for tailings ponds (t), mines (m) and facility/other
(f). Screen estimates using an overlapping subset of downwind measurements from a box flight of
the same day are shown with an asterisk (*). Middle: List of emissions rates for source categories
15
and facility totals in tonnes CH
4per hour (tonnes hr
-1). Bottom: Various aircraft flight details and
meteorological parameters.
Table S1: Syncrude Mildred Lake (SML)
Aug 14 Box Aug 14 Screen A* Aug 14 Screen B Aug 16 Screen A Measurement Error (%) 1 1 1 1 Wind Error (%) 1 1 1 1 Surface Extrapolation (%) 4 11 3 28 Box Box-top Height (%) 15 Density Change (%) 11 Vertical Turbulence (%) 2
Box-Top Mixing Ratio (%) 4
Screen
Background Mixing Ratio (%) 13 19 8
Screen-Top Height (%) 6 6 1
Plume Separation (%) 6t, 11m 5t, 12m 5t, 8m
Total Uncertainty Facility (%) 20 19 21 30
Total Uncertainty Plumes (%) 20t, 22m 21t, 24m 30t, 31m
Emissions Rate Ponds (tonnes hr-1) 6.38 ± 1.23 5.83 ± 1.22 8.63 ± 2.59 Emissions Rate Mines (tonnes hr-1) 2.71 ± 0.60 2.67 ± 0.64 3.07 ± 0.95 Emissions Rate Facility/Other (tonnes hr-1)
Emissions Rate Total (tonnes hr-1) 7.68 ± 1.54 9.10 ± 1.73 8.50 ± 1.79 11.82 ± 3.55
Aircraft Transect Count 6 6 8 9
Boundary Layer Height (m agl) 360-400 360-400 400-600 350-400
Temperature (°C) 20.8 ± 6.0 20.8 ± 6.0 20.8 ± 6.0 19.5 ± 3.8
Wind Speed (m/s) 3.1 ± 2.5 3.1 ± 2.5 5.1 ± 1.6 2.8 ± 0.8
Daily Mean Wind Direction (°) 220 ± 37 220 ± 37 220 ± 37 225 ± 57
Table S2: Suncor Energy OSG (SUN)
Aug 16 Screen A Aug 29 Box Aug 29 Screen*
Measurement Error (%) 1 1 1 Wind Error (%) 1 1 1 Surface Extrapolation (%) 4 14 4 Box Box-top Height (%) 1 Density Change (%) 17 Vertical Turbulence (%) 2
Box-Top Mixing Ratio (%) 5
Screen
Background Mixing Ratio (%) 23 2
Screen-Top Height (%) 1 9
Plume Separation (%) 12t, 1m 9t, 9m
Total Uncertainty Facility (%) 24 23 11
Total Uncertainty Plumes (%) 27t, 24m 14t, 14m
Emissions Rate Ponds (tonnes hr-1) 3.16 ± 0.85 2.30 ± 0.32 Emissions Rate Mines (tonnes hr-1) 1.53 ± 0.37 1.88 ± 0.26 Emissions Rate Facility/Other (tonnes hr-1)
Emissions Rate Total (tonnes hr-1) 4.69 ± 1.13 3.96 ± 0.91 4.18 ± 0.42
Aircraft Transect Count 9 7 7
Boundary Layer Height (m agl) 350-400 400-500 400-500
Temperature (°C) 19.5 ± 3.8 15.2 ± 2.4 15.2 ± 2.4
Wind Speed (m/s) 2.8 ± 0.8 1.8 ± 1.3 1.8 ± 1.3
Daily Mean Wind Direction (°) 225 ± 57 26 ± 40 26 ± 40
Table S3: Canadian National Resources Limited Horizon (CNRL)
Aug 20 Box Aug 20 Screen* Sep 02 Box Sep 02 Screen*
Measurement Error (%) 1 1 1 1 Wind Error (%) 1 1 1 1 Surface Extrapolation (%) 22 26 12 11 Box Box-top Height (%) 1 18 Density Change (%) 5 6 Vertical Turbulence (%) 2 7
Box-Top Mixing Ratio (%) 3 8
Screen
Background Mixing Ratio (%) 16 25
Screen-Top Height (%) 5 2
Plume Separation (%) 6m, 12f
Total Uncertainty Facility (%) 23 31 25 28
Total Uncertainty Plumes (%) 29m, 30f
Emissions Rate Ponds (tonnes hr-1)
Emissions Rate Mines (tonnes hr-1) 2.56 ± 0.74
Emissions Rate Facility/Other (tonnes hr-1) 0.98 ± 0.29
Emissions Rate Total (tonnes hr-1) 3.65 ± 0.84 3.67 ± 1.14 3.53 ± 0.88 3.54 ± 1.00
Aircraft Transect Count 12 12 10 10
Boundary Layer Height (m agl) 700-900 700-900 600-1000 600-1000
Temperature (°C) 16.3 ± 4.3 16.3 ± 4.3 12.7 ± 5.1 12.7 ± 5.1
Wind Speed (m/s) 2.4 ± 1.9 2.4 ± 1.9 5.9 ± 2.8 5.9 ± 2.8
Daily Mean Wind Direction (°) 262 ± 35 262 ± 35 338 ± 59 338 ± 59
5
Table S4: Shell Albian and Jackpine (SAJ)
Aug 21 Box Aug 21 Screen* Sep 06 Box Sep 06 Screen*
Measurement Error (%) 1 1 1 1 Wind Error (%) 1 1 1 1 Surface Extrapolation (%) 5 7 12 7 Box Box-top Height (%) 8 5 Density Change (%) 10 16 Vertical Turbulence (%) 5 2
Box-Top Mixing Ratio (%) 9 7
Screen
Background Mixing Ratio (%) 27 17
Screen-Top Height (%) 10 5
Plume Separation (%)
Total Uncertainty Facility (%) 18 30 22 20
Total Uncertainty Plumes (%) Emissions Rate Ponds (tonnes hr-1)
Emissions Rate Mines (tonnes hr-1) 1.44 ± 0.43 1.18 ± 0.24
Emissions Rate Facility/Other (tonnes hr-1)
Emissions Rate Total (tonnes hr-1) 1.60 ± 0.29 1.44 ± 0.43 1.25 ± 0.28 1.18 ± 0.24
Aircraft Transect Count 10 10 10 10
Boundary Layer Height (m agl) 1200-1500 1200-1500 900-1200 900-1200
Temperature (°C) 16.5 ± 3.6 16.5 ± 3.6 14.8 ± 6.2 14.8 ± 6.2
Wind Speed (m/s) 1.3 ± 0.8 1.3 ± 0.8 4.3 ± 0.9 4.3 ± 0.9
Daily Mean Wind Direction (°) 258 ± 50 258 ± 50 7 ± 50 7 ± 50
Table S5: Syncrude Aurora (SAU)
Aug 29 Box Aug 29 Screen* Sep 06 Screen*
Measurement Error (%) 1 1 1 Wind Error (%) 1 1 1 Surface Extrapolation (%) 10 14 6 Box Box-top Height (%) 4 Density Change (%) 9 Vertical Turbulence (%) 2
Box-Top Mixing Ratio (%) 3
Screen
Background Mixing Ratio (%) 11 13
Screen-Top Height (%) 4 13
Plume Separation (%)
Total Uncertainty Facility (%) 15 19 20
Total Uncertainty Plumes (%)
Emissions Rate Ponds (tonnes hr-1)
Emissions Rate Mines (tonnes hr-1) 1.29 ± 0.25 1.56 ± 0.31
Emissions Rate Facility/Other (tonnes hr-1)
Emissions Rate Total (tonnes hr-1) 1.70 ± 0.26 1.29 ± 0.25 1.56 ± 0.31
Aircraft Transect Count 3 3 10
Boundary Layer Height (m agl) 400-500 400-500 900-1200
Temperature (°C) 15.2 ± 2.4 15.2 ± 2.4 14.8 ± 6.2
Wind Speed (m/s) 2.3 ± 0.7 2.3 ± 0.7 4.3 ± 0.9
Daily Mean Wind Direction (°) 26 ± 40 26 ± 40 7 ± 50
5
Table S6: Total Oil Sands Screen
Aug 16 Screen B Measurement Error (%) 1 Wind Error (%) 1 Surface Extrapolation (%) 3 Box Box-top Height (%) Density Change (%) Vertical Turbulence (%) Box-Top Mixing Ratio (%)Screen
Background Mixing Ratio (%) 14
Screen-Top Height (%) 5
Plume Separation (%)
Total Uncertainty Facility (%) 16 Total Uncertainty Plumes (%) Emissions Rate Ponds (tonnes hr-1)
Emissions Rate Mines (tonnes hr-1)
Emissions Rate Facility/Other (tonnes hr-1)
Emissions Rate Total (tonnes hr-1) 23.6± 3.8
Aircraft Transect Count 10
Boundary Layer Height (m agl) 400-450
Temperature (°C) 19.5 ± 3.8
Wind Speed (m/s) 2.8 ± 1.0
Daily Mean Wind Direction (°) 225 ± 57