Closed Loop Supply Chain Waste Reduction Through Predictive Modelling
and Process Analysis
by Hans P. Kobor
B.S. Mechanical Engineering, United States Military Academy, 2011
Submitted to the MIT Sloan School of Management and the Department of Mechanical Engineering in Partial Fulfillment of the Requirements for the Degrees of
Master of Business Administration and
Master of Science in Mechanical Engineering
In conjunction with the Leaders for Global Operations Program at the Massachusetts Institute of Technology
June 2019
0 2019 Hans P. Kobor All rights reserved.
The author hereby grants to MIT permission to reproduce and to distribute publicly paper and electronic copies of this thesis document in whole or in part in any medium now known or hereafter created,
ignature
of AuthorSignature redacted
Certified b Certified b Certified b Accepted Accepted Mechanical Engineering MIT Sloan School of Management May 7, 2019
Signature redacted
.uan Pabloi 'Ama, Thesis Supervisor Richard S. Leghorn (1939) Career Development Professor, MIT Sloan School of Management
__________
Signature redacted
Duane Boning, Thes' Supervisor Clarence J. LeBel Professor, Electrical EngineYing and Computer Science
__
Signature redacted
rma, Thesis Reader Fred Fort Flowers (1941) and Daniel Fort Flowers (1941) Prfe5 1Engineering
__________
Signature red acted
Nico as adjiconstantinou Chair, Mechanical Engineering C mmittee on Graduate Students Deparment of Mechanical Engineering
___________
Signature redacted
Maura Herson rTT1T Assistant Dean, MBA Program, MIT Sloan School of Management
Closed Loop Supply Chain Waste
Reduction
Through Predictive Modelling
and Process Analysis
by Hans Kobor
Submitted to the MIT Sloan School of Management and the Department of Mechanical Engineering on May 7, 2019 in Partial Fulfillment of the Requirements for the Degrees of Master of Business
Administration and Master of Science in Mechanical Engineering.
Abstract
Verizon distributes Customer Premises Equipment (CPE) such as set top boxes, broadband routers, and WiFi extenders to Fios customers via a variety of paths; for example: direct ship to customer (either for self-install or for later installation by a field technician), delivery via field technicians, or retail store pickup (primarily for self-install). Each method has its own benefits and shortcomings due to impacts on metrics such as inventory levels, shipping costs, on-time delivery, and system complexity. Although the majority of shipments are successfully activated in the customer's home, a non-trivial percentage results in unused returns or inventory shrinkage. These undesirable results represent a significant amount of wasted resources. This thesis is focused on identifying and realizing cost savings in the Fios supply chain through reduction in waste associated with unsuccessful shipments.
In order to effectively analyze the closed-loop supply chain, accurate and reliable process mapping is critical. Interviews with key stakeholders, together with order and shipment data analysis yielded a complete picture of the ecosystem's processes and infrastructure. Process mining techniques augmented this understanding, using event log data to identify and map equipment and information flows across the supply chain. All together this analysis is used to identify order cancellations as a key source of waste.
To limit waste, it is necessary to conduct analysis both internal to Verizon's processes and externally, to determine if there are customer trends leading to order termination. Process mining was used for the internal analysis and, while it helped identify singular cases in which process abnormalities were associated with undesirable outcomes, its current form proved unsuited for root cause analysis. Internal analysis did, however, illuminate opportunities for improvement in radio-frequency identification (RFID) usage and protocols across the supply chain. Current systems can result in poor visibility of equipment as it moves within some segments of the supply chain. The actual monetary impact is difficult to determine but likely to increase as the importance of RFID increases.
External analysis is conducted through predictive modelling. Using a variety of data sources, a model with over 80% sensitivity and a low false positive rate is achieved. Operationalizing this model through real time incorporation with sales was explored but found to be overly complex. Instead, the random forest model yielded policy changes guided by the features with the highest importance. A pilot is currently in development to test the efficacy of suggested changes, as the model implies significant savings opportunity.
Thesis Supervisor: Duane Boning
Clarence J. LeBel Professor, Electrical Engineering and Computer Science
Thesis Supervisor: Juan Pablo Vielma
Acknowledgments
First and foremost, I would like to express my gratitude to the entire Verizon Global Supply Chain organization for their support and collaboration throughout the project, especially my supervisor, Steve Baum. He facilitated this project as a rich learning experience; his shared expertise and candid discussion helped me grow both personally and professionally. Sincerest thanks also go to my colleagues in the group, particularly Ernesto Allwood, and Jen Canlas. They were instrumental in helping me retrieve, contextualize, and process mountains of data from myriad sources. Special thanks also go to Alan Rompala, Sam Mastruserio, Matt Moore, and Frank Frontiera. Their guidance and eagerness to share knowledge provided me with the environment and tools to succeed.
I would also like to thank my faculty advisors, Duane Boning and Juan Pablo Vielma. Each was a wonderful source of knowledge and ideas, and their guidance was instrumental in shaping the direction of the project.
The LGO staff, particularly Patty Eames and Ted Equi, also deserve acknowledgement for their support and guidance during not only the internship, but also the entire LGO program.
Finally, I would like to thank my wife Lauren for her tremendous love and support. Her
monumental strength and ability to manage the kids while we were apart allowed me to stay focused and succeed on the project and throughout the program. She is my rock, and I could not have done this without her.
Table of Contents
Abstract ... 3
Acknow ledgm ents... 5
Table of Contents...7 List of Figures ... 9 List of Tables ... 10 1 Introduction... 11 1.1 V erizon Background ... 11 1.2 V erizon Fios... 12
1.3 W ireline/Fios Supply Chain... 13
1.4 Problem Statem ent ... 15
1.5 Research M ethodology ... 15
1.6 Thesis Structure ... 15
2 Literature Review ... 17
2.1 Closed Loop Supply Chains and Reverse Logistics: Overview ... 17
2.2 Big Data and Predictive Analytics in Supply Chains... 19
2.3 Radio Frequency Identification Im plem entation and V erification ... 22
3 Understanding Current Operations: M odelling Existing System s ... 25
3.1 Fios Supply Chain Organization and Challenges... 25
3.2 D ata Sources and Pitfalls ... 26
3.3 Characterization of Existing Shipm ent Results... 27
3.4 Analysis of Device Tracking Technologies and Current U sage ... 29
3.5 Process M ining to Understand System Interactions and Trends... 31
3.5.1 Process M ining Description ... 32
3.5.2 Application and Results ... 33
4 Predictive M odelling for Order Cancellations ... 36
4.1 M ethod and M otivations ... 36
4.1.1 M otivation and Goals for Predictive M odel... 36
4.1.2 M ethods: D ata Sources and Treatm ent ... 37
4.1.3 M ethods: Evaluation Criteria ... 38
4.2 M odel Selection and Results... 39
4.2.1 D escription of Techniques ... 39
4.3 M odel Tuning and R esults ... 42
4.3.1 Ordering Data Modelling ... 42
4.3.2 Sales D ata M odelling ... 47
4.4 Application and Analysis ... 51
4.4.1 Ordering System Model Application... 51
4.4.2 Sales Model Application ... 53
SC onclusion ... ... 54
5.1 G eneralized Lessons ... 54
5.1.1 Process Analysis Insights ... ... 54
5.1.2 Predictive M odelling Insights... ... 55
5.2 R ecom m endations ... 55
5.2.1 Recommendations - Predictive Model... ... ... 55
5.2.2 Recom m endations - Process Changes ... ... 56
5.3 Recom m endations for Future Research... 57
5.3.1 Future Research - Predictive M odel... 57
5.3.2 Future Research - Process Analysis ... 58
List of Figures
Fig ure 1-1: Fios Service Area ... 12
Figure 2-1: M ajor Components and Activities of a CLSC ... 17
Figure 2-2: CLSC Return Shipment Tim ing ... 18
Figure 2-3: RFID Components and Functionality ... 23
Figure 3-1: Order Inform ation Flow ... 26
Figure 3-2: Clean and Screen Returns by Type ... 28
Figure 3-3: Unused Return Order Status... 28
Figure 3-4: Inventory Process Flow ... 30
Figure 3-5: Conform ance Checking in Process M ining... 33
Figure 3-6: Process Discovery in Logistics ... 34
Figure 4-1: Sample ROC Curve... 39
Figure 4-2: Sample Decision Tree ... 40
Figure 4-3: Sample Partial AUC... 43
Figure 4-4: Order M odel Tuned Random Forest ... 44
Figure 4-5: Order M odel Tuned AdaBoost... 44
Figure 4-6: Order M odel Tuned M odel Comparison... 45
Figure 4-7: Order M odel AdaBoost Confusion M atrix... 45
Figure 4-8: Order Model ROC and Partial ROC Curves with Treated Data Sets...46
Figure 4-9: Sales M odel Tuned Random Forest ... 47
Figure 4-10: Sales M odel Tuned AdaBoost... 48
Figure 4-11: Sales M odel Comparison of AdaBoost and RF ... 48
Figure 4-12: Sales M odel Confusion M atrices ... 49
Figure 4-13: Sales M odel ROC Curve Comparison ... 49
Figure 4-14: Order M odel Top 10 Feature Importances ... 51
Figure 4-15: Door to Door Sales Cancellation Profile... 52
List of Tables
Table 2-1: Analytics Methods and Examples ... 20
Table 2-2: Comparing learning algorithms (ranked from * to **** (best model))...21
Table 2-3: Formulae and interpretation of accuracy, precision and recall scores...22
Table 3-1: Key Stakeholders and Motivations... 25
Table 3-2: D ata Concerns by Source ... 27
Table 4-1: Order Model Metrics with Threshold=0.5... 46
Table 4-2: Sales Model Metrics with Threshold=0.5 ... 50
1
Introduction
This thesis presents techniques to analyze and improve the efficiency of a closed loop supply chain and reduce the waste associated with certain operational decisions and technologies. The thesis presents a predictive model that can be employed to limit unused and wasteful shipments. Model discussion depicts a solution to optimize parameters for a low false positive rate despite a highly class-imbalanced data set. In addition, this thesis presents a technique to understand complex system interactions and process flows. Finally, we discuss device tracking technology within the supply chain and its operational usage and impact. This chapter provides a brief overview of Verizon as a whole, and of Fios and its supply chain operations. Additionally, this chapter provides an overview of potentially problematic features within the system, and the methodologies with which the project was approached.
1.1
Verizon Background
Verizon is an American multinational conglomerate and a global leader in communications. The company was founded in 2000 as a merger between Bell Atlantic and GTE Corporation. Over the last 19 years the company has grown through dozens of mergers and acquisitions with some of the most prominent names in American technology, including Yahoo, MCI, AOL, and Alltel, among others. Today, Verizon is a leading provider of communications, information, and entertainment products and services to consumers, businesses, and government agencies worldwide. In 2018, the company earned $11.6 Billion in EBITDA (earnings before interest, taxes, and depreciation) on $130.9 billion in total revenue. At the time of this project, the company was divided into three main segments: Wireless, Wireline, and Enterprise.
* Wireless - provides wireless voice and data services, as well as equipment sales
* Wireline - broadband video, voice, and data, corporate networking solutions, data center, and cloud services for residences and small businesses.
* Enterprise - provides cloud-based solutions for corporate and government entities, delivering security, mobility, and information-sharing solutions.
This organizational structure has since been changed, effective January 1, 2019 to enable the business to focus more directly on the rollout and deployment of 5G networks across the United States. The new structure divides the business into three new segments: Consumer, Business, and Media.
* Consumer - includes the consumer segment of the company's wireless and wireline businesses " Business - includes products and services sold to businesses and government from both the
* Media - based on the Oath Group and its media properties, this segment focuses on generating and disseminating media content, advertising, and technology
Although it is important to recognize the changing dynamics of the business, for the purpose of this document, analysis is conducted according to the old wireless/wireline structure to avoid confusion.
1.2 Verizon Fios
Verizon's Fios service provides television, internet, and voice services to residential and small business customers in the mid-Atlantic and northeastern United States through a 100% fiber optic network, as illustrated in Figure 1-1 [2]. Fios serves about 6 million internet and 4.5 million TV subscribers and is a major portion of the wireline business, accounting for about 40% of the unit's total revenue. Fios marketing emphasizes high data transfer speeds, excellent reliability, and best-in-segment customer service. Despite these excellent qualities, Fios overall subscription growth has slowed in recent years to about 2.5% per year, and that growth is entirely from internet services. TV subscription has
experienced a net decrease in customers over the past two years, as streaming services such as Netflix and Hulu have taken their toll on the Cable TV industry [1]. In addition to this slow growth rate, in 2013, Verizon sold its Fios network assets in California, Texas, and Florida. As a result, Fios operates in a relatively limited service area.
Figure 1-1: Fios Service Area
Given the decision to limit the geographical service area of Fios and the lack of substantial organic growth, the business unit is considered to be in the mature portion of its lifecycle [2]. As a result, controlling costs is a key metric within the business, and this thesis focuses on costs within the Fios supply chain in particular.
1.3
Wireline/Fios Supply Chain
Fios services require certain pieces of equipment at the customer's home to ensure network functionality and a positive customer experience. For a typical "triple-play" bundle customer (the most common type), there are three main pieces of required equipment: Optical Network Terminal (ONT), Router, and Set-top box. The ONT is the interface between the fiber optic network and the in-home network. The router receives input from the ONT via coaxial or Ethernet cable and transfers information between the ONT and in-home devices via either wi-fi or Ethernet. The set-top box receives television
signal from either the ONT or router (depending on device) and provides basic TV viewing, with the potential for adding DVR capabilities.
An ONT is required in any house to enable Fios services, and customers are required to rent Verizon-provided set-top boxes as part of their TV subscription. Customers are able to provide their own router and abstain from renting or purchasing a Verizon router; however, any customer with internet speeds higher than 100 Megabytes per second is required to rent or purchase the newest router, the BHR4. Fios customers are also encouraged to purchase or rent wi-fi network extenders (FNEs) to ensure quality internet coverage throughout the home. Although there are only four device types (ONT, STB, Router, FNE), there are multiple legacy devices that are prevalent across the network, resulting in over 20 managed SKUs. The wireline supply chain group manages the forward and reverse logistics for all of these devices and plays a critical role in ensuring a quality customer experience at installation and in the event of needed timely replacements or repairs.
In order to ensure proper distribution and delivery, the supply chain operates three distinct channels for forward logistics:
" Retail: Customers may pick up or purchase devices at Verizon retail stores
* Garage Work Centers (GWCs): Installation and repair technicians work out of GWCs, which maintain a small inventory of most SKUs. Technicians frequently pull devices out of GWC inventory to complete both installation and repair orders.
* Direct to consumer (DTC): Many customers receive direct shipments of equipment from the regional distribution center (RDC) to their home. This is a frequent channel for both repair and installation orders. For installation orders, the devices are shipped to the customer and then a technician arrives on the scheduled date to conduct the installation. This arrangement is known as "Direct Ship." DTC repair orders are typically overnighted
to the customer with a return box for the defective device. This is known as a "dropship" order.
Each of these distribution channels is operational for reverse logistics as well. Customers frequently drop equipment off at retail stores or mail devices back to the RDC. Technicians also regularly bring defective equipment to the GWC for return to the RDC.
The focal point for the Fios supply chain is the RDC. There are two such facilities and each are located in eastern Pennsylvania. They are operated by separate third party logistics providers (3PLs). Each RDC receives bulk shipments from manufacturers and suppliers, which it allocates through the aforementioned distribution channels. The RDCs process over 500,000 shipments and returns per month. They also maintain buffer stock inventory for the supply chain. The eastern Pennsylvania location is centralized within the Fios service area and allows for overnight shipments of equipment for repair order to any customer home. It also allows easy resupply of GWCs and retail stores, which receive
replenishment shipments frequently. All shipments are sent through small parcel carriers such as FedEx,
UPS, or USPS.
In addition to forward logistics, there is a clean-and-screen facility co-located with one of the RDCs and run by a separate third party service provider. This facility is responsible for receiving used equipment from end users, inspecting it for damage, repairing it, testing it to ensure functionality, and cleaning it. If a device is broken and unrepairable it is returned to the manufacturer (for warrantied items) or scrapped. Once a functional device is tested and cleaned, it is placed back in RDC inventory for reuse with a new customer. This practice allows Verizon to limit its new equipment purchasing costs while ensuring that the customer receives quality equipment.
As Section 2.1 will discuss, certain aspects of the Fios supply chain are common across a wide variety of industries. In particular, clean and screen and reverse logistics have become ubiquitous in the modern economy. The rise of online shopping has required all manner of businesses to process returned goods and return them to use when possible. The forward supply chain of Fios, as characterized by centralized RDCs and varied local distribution channels, is also common across industries. Overall, many problems inherent in the Fios supply chain are frequently seen across a broad spectrum of business, particularly those operating in service-focused industries.
1.4
Problem Statement
Every supply chain suffers from inefficiencies and waste. This thesis conveys the results of efforts to reduce waste associated with the shipment of Verizon Fios customer premise equipment (CPE). CPE, such as set top boxes, broadband routers, and WiFi extenders, is shipped to Fios customers via the three channels previously mentioned. Each method has its own benefits and shortcomings due to impacts on metrics such as inventory, shipping costs, on-time delivery, and system complexity. Although the majority of shipments are successfully activated in the customer's home, a non-trivial percentage results
in unused returns or inventory shrinkage. These undesirable results represent a significant amount of wasted resources. This project analyzes the system and presents a framework to find cost savings in the Fios supply chain by reducing the waste resulting from such unsuccessful shipments. It also presents findings related to technology employed within the supply chain such as RFID that may also relate to inefficiencies and waste.
1.5
Research Methodology
Identifying the key differences between how a system currently works and how it is ideally meant to function will highlight critical savings opportunities. Thus, the first phase of this project involves building a basic understanding of the current Fios business, its underlying processes, and the data that drives decision-making. Through a literature review, interviews with key stakeholders across the supply chain, data collection from the various key systems, and analysis of shipment data, this phase identifies particularly strong targets for savings opportunities. Once these key features are identified, the project pursues a two-pronged approach. This involves focusing work on "internal" process analyses to identify shortcomings in Fios internal business practices and systems, alongside "external" analysis to control for factors outside of the system. External analysis leads to predictive models capable of limiting waste through prevention of shipments with an elevated risk of customer cancellation.
1.6
Thesis Structure
This thesis is organized into six chapters. The content of each chapter is summarized below.
* Chapter 1: This chapter provides an introduction to Verizon, Fios, and the Fios supply chain. In addition, this chapter includes a brief problem statement, description of research methodology, and thesis structure.
* Chapter 2: A brief literature review summarizes previous academic research work that relates to efficiency within closed loop supply chains, device tracking technologies, and consumer behavior predictions
" Chapter 3: This chapter focuses on the Fios supply chain's operations, organizational processes, data collection systems, and key data which produced initial insights. This chapter also includes analysis of device tracking technologies employed within the supply chain. Finally, it details the techniques used to analyze the current system via process mining techniques.
" Chapter 4: The formulation and results of predictive modelling efforts are presented. The limitations of the model are highlighted, as well as the proposed applications.
* Chapter 5: The conclusion of the thesis includes recommendations on the application of
predictive modelling within closed loop supply chains. In addition, specific recommendations for Verizon Fios supply chain are presented. Opportunities for future research in process mining, organizational dynamics, and predictive modelling are identified.
2 Literature Review
Companies across the world are increasingly incorporating reverse logistics and closed loop supply chains into their operations. These arrangements, when feasible, can have positive impacts on supply chain costs, efficiency, and environmental impact. In addition, data collection and supply chain tracking technology has made significant advances in recent decades, allowing unprecedented visibility of the movement of goods, as well as the advent of "big data" and analytics within supply chains. This chapter reviews recent research and market trends surrounding these topics.
2.1 Closed Loop Supply Chains and Reverse Logistics: Overview
Reverse logistics is defined as "The process of planning, implementing, and controlling the efficient, cost effective flow of raw materials, in-process inventory, finished goods and related
information from the point of consumption to the point of origin for the purpose of recapturing value or proper disposal" [4]. When a reverse logistics mechanism is combined with a product's standard forward logistics system, a closed loop supply chain (CLSC) is formed. Among other things, a proper CLSC requires establishment of mechanisms for retrieval, refurbishment, remanufacturing, and recycling or disposal of used equipment. Figure 2-1 describes the major components of a typical CLSC [6].
Figure 2-1: Major Components and Activities of a CLSC FarmdLegis"i
Raw MaMIW P NoT Awnibly Dstr
L=W---For many companies, the initiation of closed loop supply chains was the result of legal directives
mandating collection and recovery efforts for certain types of waste. However, in recent years, numerous
industries have come to understand the potential for value creation in CLSCs. Toffel lists the following as
some of the prime motives for companies to pursue product recovery through reverse logistics
[5]:
* Reducing production costs
* Promoting an image of environmental sustainability * Meeting customer demands
* Protecting aftermarkets * Preempting regulation
Although the article was written through the lens of product recovery in manufacturing, these same motives apply to the Fios supply chain. For example, "meeting customer demands" may refer to the desire
of most Fios customers to rent their equipment in lieu of outright purchases. This arrangement
necessitates a mechanism to receive used goods at the end of the equipment's life cycle (or the customer's tenure), and thus a CLSC is an important component in the Fios business model.
There are numerous challenges to operating a CLSC, and one of the most commonly discussed in literature is the retrieval of equipment. Sahyouni notes that there are typically two main types of return: commercial and end-of-life. Commercial returns are often a result of customer preferences or product defects. End-of-life returns are the result of product life cycles and new product introduction. Figure 2-2
displays the typical timing distribution of these return types. In the same study it is noted that, due to inadequate incorporation of reverse logistics into supply chain planning, "companies now face a considerable challenge in designing a reverse supply chain network that will meet returns processing needs while complementing their existing forward distribution system" [7].
Figure 2-2: CLSC Return Shipment Timing durky stWge
Introductory -- C orrc rebom
sta- - End-m narum
dombunt n *"" donant
mod. m
A Deloitte strategic review also highlights difficulties of equipment retrieval, particularly in the predictability of return volumes. It argues: "reverse logistics happens in response to an action of a customer or supply chain actor and as such is extremely difficult to anticipate or plan for by a company" [8]. Verizon mitigates some of the return volume risk by employing a 3PL provider to process, test, and
refurbish its returns. Under this agreement, Verizon pays per unit processed and is therefore insulated from daily shipment fluctuations in volume which may create short-term labor shortages or overages.
Despite these challenges, the importance of reverse logistics continues to grow around the world. By Deloitte's estimate, reverse logistics has annual cost in the U.S. of about 200 billion USD. In order to minimize these costs and ensure successful operation of CLSCs, Deloitte recommends the following as key factors for success:
" Optimize forward logistics - Minimize customer returns by implementing the correct strategy in forward logistics to limit impacts on the reverse flow
* Synergies - Merge forward and reserve flows
* Product return policy - Product return policies should not only be looked at from a commercial perspective though should be considered from a logistics and operational point of view as well. " Consolidation of flows - The success of a reverse flow depends on the degree of convergence
between the financial flow, operational flow as well as the information flow [8].
Verizon has addressed synergies by collocating its reverse and forward logistics facilities and it continuously works to optimize its forward logistics to mitigate waste. The Fios supply chain generates data during each transaction and movement of goods within the system. Thus, there are significant opportunities to mitigate waste through analysis of processes, technologies, and big data analytics.
2.2
Big Data and Predictive Analytics in Supply Chains
Due to its somewhat nascent nature, "big data" lacks universal definition. This thesis will use Gartner's definition, which describes big data as "high-volume, high-velocity and/or high-variety information assets that enable enhanced insight, decision-making, and process automation" [9]. Using big data, researchers generally approach problems using three categories of analytic method. Table 2-1 defines the methods and provides brief examples [9]. At first glance, it may appear that prescriptive and predictive analytics serve similar purposes since they are both forward looking. There is, however, a key distinction. Predictive analytics merely describe a potential future outcome, whereas prescriptive techniques recommend specific actions and generally seek to understand the predicted impact of these actions on performance.
Table 2-1: Analytics Methods and Examples
-Analytics Method Definition Use Case Examples
Used to describe or mimic the system or process under study and answer the question of what is happening
Used to prescribe to the decision-maker some "optimal" set of policies and answers the question of what will be happening
Provide a projection of system or process performance into the future and answer the question of what will be happening
- Supply chain mapping - Model risk analysis
- Model supply chain flexibility
- Production planning e Project selection - Profit Maximization - Vehicle routing - Demand forecasting - Returns predictions
This thesis is focused primarily on predictive analytics within reverse logistics, specifically predicting customer cancellations. Literature on this specific topic is somewhat sparse, but one particular study by Deshmukh outlines some of the key challenges with such an undertaking [11]. The first of these is model selection. Various machine learning and optimization programs are feasible in this use case, but Table 2-2 outlines a comparative study between different techniques across several features [11]. The key takeaway from this table is that it is critical to understand the conditions under which a certain technique outperforms others for a given problem.
Descriptive
Prescriptive
Table 2-2: Comparing learning algorithms (ranked from * to **** (best model))
Mkdw cokTeckiwes ____
CniaMn Meifs Decio. Tiees Nead Newed Nve Buyes kNN
Speed wge qece o de- o
asxes nd &e mer afimmce
Sped da **** **** **** * s*
Td,--e u mmes V-- * a- ****
TaIlane t eeo *s ** ** ** *
Delgwedien my/-- ru sea**.* (e da ass & d ,
~cc
Toenme k** e * -- ** a*
Tck ds. to aW 4s ssne ae&
A second challenge in predicting customer cancellations is that the data is typically imbalanced, with far fewer cancellations than completed orders. In order to mitigate the effects of this imbalance, two techniques are proposed: (1) down-sampling the majority class or over-sampling the minority class or both, and (2) cost-sensitive learning, i.e., assigning a high cost to misclassification [11]. In addition, imbalance-treated random forests and gradient boosted classifiers are identified as high performing techniques for this type of data set.
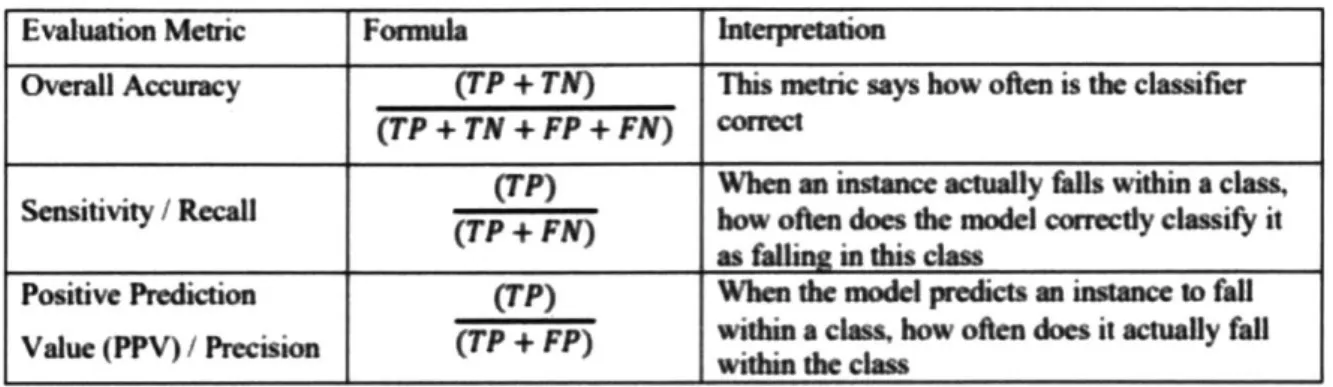
Finally, a third challenge outlined by Deshmukh is the choice of evaluation metrics. It is noted that overall model accuracy is not appropriate to evaluate highly imbalanced data sets. Using this metric, a model built using a dataset containing 1% cancellations would be viewed as 99% accurate if it simply predicted zero cancellations. In this case, sensitivity and precision are more appropriate performance metrics. Table 2-3 shows the formula and interpretation for each evaluation metric [11].
Table 2-3: Formulae and interpretation of accuracy, precision and recall scores
Evaluation Metric Formula Interpreation
Overall Accuracy (TP + TN) This metric says how often is the classifier
(TP+TN+FP+FN) MI
t / Recall (TP+ FN) (TP) how ofen does dhe model correctly classify itWhen an instance actually falls within a class,
as falling this class
Positive Prediction (TP) When the moe predicts an intanc 10 fall
Value (PPV) / Precision (TP + FP) within a clam. how often does it actually fall I within
the
classIn addition to these challenges, another issue that confronts predictive modelling is the idea of concept drift. According to this idea subtle changes in processes over time alter the underlying probability distributions of the data. The effect is that learning models trained on old data may be inconsistent with new data [15]. In order to mitigate the effect of this, Chen proposes implementation of incremental learning, whereby the data stream is divided into chunks and classifiers are trained on each data chunk and combined to predict outcomes in the newest data chunk [15].
Although the prospects of building strong predictive models are good, Hazen provides an insightful warning: "The modern world is data rich and thus big data analytics is likely here to say. However, management decisions are only as good as the data on which they are based" [9]. Thus, any organization which purports to make use of big data analytics must first lay the groundwork of reliable IT
infrastructure and data collection methods. In addition, Hazen describes socialization of analytics as another major challenge. He argues that transitioning an organization to rely on big data analytics requires careful strategic planning and careful consideration of the cultural and organizational ramifications of such a tectonic shift in business focus. Although Verizon has laid a strong foundation for incorporation of big data analytics into supply chain decision-making, this thesis outlines some impacts of problems with consistency of data that may inhibit the effectiveness of predictive modelling or its implementation.
2.3
Radio Frequency Identification Implementation and Verification
A major factor in the advent of big data is the proliferation of cost-effective data collection and device tracking technologies. Radio frequency identification (RFID) tags are at the forefront of this revolution. These devices were first introduced commercially in the 1980s via active, or battery powered, tags. These tags were prohibitively expensive and generally used only for the tracking and management of extremely valuable property. The more recent introduction of passive RFID technology has drastically
reduced the cost and increased the accessibility of RFID tags across the economy [12]. Today, Statista estimates global annual RFID sales to be about 17 Billion USD, with double digit annual growth rates over the next decade [13].
Figure 2-3 depicts key RFID system components and functionality. Each RFID tag is embedded with a microchip that contains identification data such as an Electronic Product Code (EPC). The microchip can also incorporate functionality beyond simple identification, including integrated sensors, read/write storage, encryption and access control. The tag is typically attached to an item, case or pallet, and the enterprise RFID database is updated to reflect the EPC/serial number pairing. RFID scans are conducted with readers. These devices contain small antennae that emit electromagnetic waves which form a magnetic field when they "couple" with antenna on the RFID tag. The tag draws power from the magnetic field and uses it to power the microchips' circuits. The microchip then modulates the received signal in accordance with its identification or programmed code and transmits or reflects a radio frequency signal. The modulation is in turn picked up by the reader, which decodes the information contained in the transponder and depending upon the reader configuration, either stores the information, acts upon it, or transmits the information to the host computer and database [12].
Figure 2-3: RFID Components and Functionality
Tag
sms
RFID Tag (not to scale)
The Fios supply chain is equipped with EPC-encoded passive RFID tags on the vast majority of its customer premise equipment. Each tag contains company identification, an item description, and item serial number. The organization employs a mix of bar code scanning and RFID scans. Typically, palletized or boxed equipment at centralized facilities is identified using bar code scans for shipments, and RFID scans are used for individual item inventory at more remote locations.
The widespread implementation of RFID has numerous supply chain benefits. Attaran identifies a few such benefits when compared to existing device tracking technologies [22]:
* Enhanced visibility along the supply chain * Speedy and accurate information retrieval * Accurate asset tracking
* Better-quality information * Improved productivity * Reduced operating costs * Improved business process * Improved quality & reliability
He also notes that RFID tags are capable of storing far more information than bar codes. In addition, the ability to scan multiple RFID tags simultaneously and without direct line of sight is a drastic
improvement over often-tedious barcode scanning technology. These improvements allow the potential for supply chain automation on an unprecedented scale, as it is possible to establish scanning protocols that allow real-time updates of inventory and goods movement all across the supply chain, from order
fulfillment to reverse logistics.
The widespread implementation of RFID in supply chains is not without challenges. RFID tags are more expensive than simple barcodes and it is often difficult to articulate a positive return on investment in the technology. In addition, RFID is a wireless technology and, as such, poses some potential security concerns to users regarding the compromise of data during wireless transmission,
storage of data, and security of storage sites [13]. It is theoretically possible for an RFID tag with read/write capability to have its EPC information altered by nefarious third parties, or for competitors to glean information on the movement of goods via RFID interception. Some of the security issues have been addressed by RFID vendors by employing varying querying protocols, jamming, encryption, and other techniques. Despite these challenges, RFID technology is capable of providing a significant boost to supply chain productivity and visibility. The Fios supply chain employs RFID on a broad scale, and plans are in place to broaden usage of the technology to allow higher granularity data generation. As this thesis will discuss, there are significant improvements that should be made to RFID information flows before such widespread change should occur.
3
Understanding Current Operations: Modelling Existing Systems
This chapter discusses the results of initial system analyses. It discusses the organizational structure and nature of the existing system and the collection of data from a variety of disparate sources. This chapter also includes analysis of device tracking technologies within the Fios supply chain, and presents a key opportunity for process improvement related to those technologies. Finally, process mining is
discussed as a means to understand event sequences and system interactions.
3.1 Fios Supply Chain Organization and Challenges
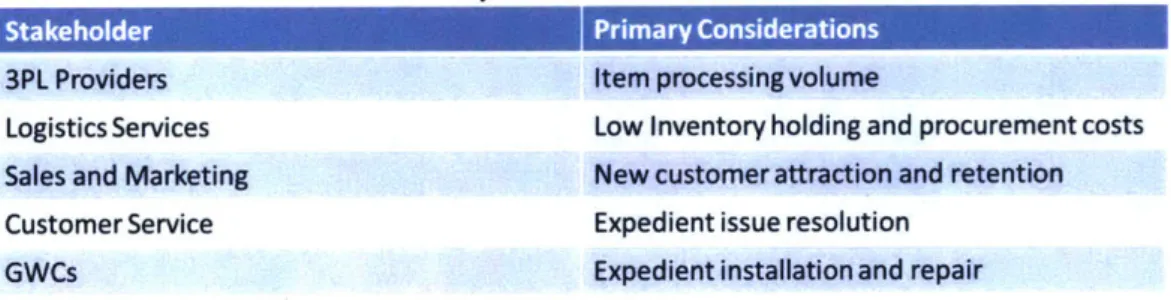
The first step in solving any significant problem is understanding the underlying systems and structures. A key component of the supply chain are its constituent stakeholders. Table 3-1 outlines some of these key stakeholders in the movement and delivery of products, as well as their primary
considerations as defined by their performance metrics.
Table 3-1: Key Stakeholders and Motivations
Stakeholder Primary Considerations
3PL Providers Item processing volume
Logistics Services Low Inventory holding and procurement costs
Sales and Marketing New customer attraction and retention
Customer Service Expedient issue resolution
GWCs Expedient installation and repair
Across the supply chain, there is a wide disparity of motivations and goals between various organizations. These goals, rooted in individual and organizational performance metrics, are often highly logical for the specific organization but when viewed holistically they can be seen to drive the overall business away from a global optimal solution. A strong example of this can be seen in customer service. One the most important performance metrics for customer service representatives is short call duration. This is a logical metric designed to increase the efficiency of the company's call center employees (it should be noted that other metrics are in place to ensure a positive customer experience). One of the easiest ways to potentially please a customer and quickly end a call is to ship replacement equipment to the customer's home overnight. Therefore, a customer service representative may choose to drop-ship after pursuing only the simplest of remedies.
A similar example can be seen in the performance of repair technicians. They are highly motivated to complete each job as quickly as possible. As a result, there is incentive to simply replace potentially faulty equipment instead of initially committing to in-depth troubleshooting. Clean and screen
testing results indicate that a vast majority of returned devices are fully functional. Thus, a system which incentivizes short duration technician visits may actually result in the unnecessary use of additional equipment. These examples depict possible sources of inefficiencies within the holistic CLSC, but a topic of further research may seek to understand the tradeoffs between constituent organizational incentives and the impact on the overall business.
3.2 Data Sources and Pitfalls
In addition to the stakeholders, it is also critical to understand the IT infrastructure within the supply chain. As mentioned in Section 1-1, Verizon is the child of numerous mergers and acquisitions. Constant flux and steady growth throughout the company's history have resulted in a wide range of data systems (each with its own unique set of success metrics) which drive the Fios supply chain. Figure 3-1 maps information flow for a hypothetical direct ship order.
Figure 3-1: Order Information Flow
a y Sysem 3
Z System 4
In this flow, an order is initially placed through a sales processing system, which sends information to the customer premise equipment system, resulting in an order placement in Verizon's logistics software. This program then coordinates with the 3PL provider's system to initiate the shipment. Notification of the completed shipment initiates system updates in the reverse order, and the logistics tracking software also updates inventory records in the company's enterprise resource planning software. Outside of this shipment flow, there is also a system which oversees the provisioning of internet and TV services to the customer which must be updated with correct equipment shipment information. Failure to do so can result in equipment installation or service activation difficulties.
a problem. Unfortunately, analysis of shipment data from each system shows non-insignificant
discrepancies between systems. As a result of these data transfer issues, it can be difficult to determine which data sets are accurate for specific features. Table 3-2 outlines some of the common apparent data issues within the primary systems, in addition to the system-to-system mismatches.
Table 3-2: Data Concerns by Source
System-Description Common Problems
Clean and Screen / 3PL * Missing receipts (multiple shipments of devices with no
intervening receipt)
- Item received same day as shipped from RDC Logistics Tracking * Due date mismatches
- Order status discrepancies
Customer Premise - Simultaneous activations/deactivations
Provisioning e Missing aggregate repair order data
Ultimately, it is clear that no single source of data within this system provides sufficient accurate information to conduct analysis with any assurance of veracity. It is necessary to produce combined data sets, focused on a particular type of equipment, and cherry-pick the most accurate features from each constituent data system. Using these combined data sets, it is possible to garner insights to guide specific areas to research further in the quest to eliminate waste.
3.3
Characterization of Existing Shipment Results
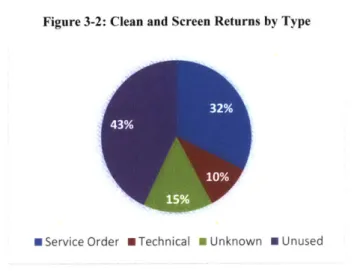
Although neither complex nor challenging, basic analysis of the aforementioned data is worth discussing in brief, simply to convey the scale of the problem and motivations for further lines of effort. Figure 3-2 shows the prevalence of unused returns at clean and screen, by type. These devices arrived back at the RDC having never been activated on the network, and typically still in the original packaging.
They are of particular concern because they represent pure waste, in terms of shipment, 3PL processing, and inventory holding costs.
Figure 3-2: Clean and Screen Returns by Type
U Service Order U Technical U Unknown U Unused
This result shows the existence of major barriers to efficiency within the CLSC, but further analysis demonstrates that direct shipments on technician installation orders are the main source of unused returns. In fact, new technician installs account for about two-thirds of direct shipments to customers, but over 85% of unused return volume. Even further, Figure 3-3 shows that cancelled orders are the primary driver of unused returns.
Figure 3-3: Unused Return Order Status
Others-2%
Cancelle
71%
It is important to note that the reason Verizon ships equipment for new technician install orders is to limit inventory levels at its hundreds of GWCs. Technicians frequently draw equipment from GWC inventory for installation and repair orders, but the direct shipment program is simply another option that allows Verizon to centrally hold inventory at the RDC to limit the effects of demand variability. Thus, the direct shipment program is not entirely wrought with waste, and does serve to lower Verizon's supply chain costs. It can, however, be improved.
From these initial insights and the preceding infrastructure mapping, two lines of effort are pursued. First, it is obvious that increased understanding of internal processes and systems is required. Thus, device tracking systems, particularly RFID, are investigated to examine existing usage and opportunities for future employment. In addition, process mining is pursued as a potential means to increase understanding of process flows and identify information barriers. Second, predictive efforts to limit shipments resulting in cancellations resulted in a random forest model to be discussed in Chapter 4.
3.4
Analysis of Device Tracking Technologies and Current Usage
As discussed in Chapter 2, RFID usage has become a significant asset for supply chain managers across the globe, and Verizon is no different. The company currently employs RFID on the majority of its customer premise equipment to provide asset visibility from the RDC all the way to device installation. These RFIDs are installed directly onto the equipment by the OEM, and the tag information is transferred into Verizon's database at or around the time of physical receipt at the RDC. Bulk tracking and
transactions at the RDC are generally conducted via barcode scanning; palletized and boxed equipment generally has consolidated barcodes on the outside and the system recognizes that a scan for one device is a scan for all devices in the container. RFID becomes a critical component further down the supply chain to track movement of individual devices.
In order to investigate the use and effectiveness of RFID for inventory tracking, we visited a GWC to understand the process and discuss any difficulties with the end user: the GWC "store keepers". These individuals are entrusted with accountability for the GWC's equipment and conduct RFID-based
inventories on a daily basis. Each garage has two inventory categories: "T" stock and "S" stock. T stock, or "truck stock" refers to devices ready to move or already on a truck for delivery to a customer premise. S-stock denotes devices that are in GWC inventory that have not been made ready for use. This
distinction is critical because replenishment orders are placed automatically based on S-stock levels. Figure 3-4 shows the flow of equipment and information through the GWC.
Figure 3-4: Inventory Process Flow
In this process, equipment arrives early in the morning, typically prior to the arrival of any GWC personnel. Devices are automatically received into GWC inventory S-stock when the delivery driver scans the pallet barcode. Store keepers bar code scan the equipment to confirm the morning's automatic receipt and place the equipment on shelves for use. Later in the morning, after the garage's technicians have departed to serve customers, the store keepers conduct an RFID scan to inventory the garage's equipment. Any RFID-labelled equipment that is not detected in this scan is automatically placed into T-stock as it is assumed to be with a technician. If this inventory brings the GWC S-T-stock below a certain threshold level, a replenishment order is automatically generated for equipment to arrive the following morning.
This system is extremely efficient when everything is running smoothly. It typically allows a storekeeper to conduct daily inventories of hundreds of items in less than 15 minutes. However, RFID usage in this garage provides an excellent case study in the value of the "Gemba" Lean concept, which alludes to visiting the place where value is created. In this case, the GWC's storekeepers informed us and demonstrated that numerous devices are equipped with readable tags that are unidentifiable to Verizon's ERP system. In one particular example, we observed an inventory scan of a pallet containing 80 devices. The initial scan of these devices detected 80 RFID tags, as expected. However, when this list of tags was transferred from the scanner into the ERP system, a small number of tags were rejected as invalid with no associated serial number. As a result, the ERP system was automatically updated to reflect an S-stock inventory count that was reduced by the number of rejected tags. This result was duplicated numerous times and according to the store keeper had been a recurring problem for quite some time, particularly with used devices coming from the clean and screen facility. This anecdotal evidence is immediately
verifiable with available data. A comparison of the RFID tagged assets database with the ERP's inventory database shows some mismatches and some missing data. One random sample of over 1000 serial
numbers showed that greater than 5% of devices in the ERP inventory were either not present in the RFID tagged assets database, or had a mismatched serial number.
Although root causes of the problem are still under investigation, this episode highlights a key issue with RFID that is not discussed at length in the literature: use of RFID, particularly in conjunction with 3PL providers, adds complexity to a company's IT systems and careful consideration must be made to ensure the fidelity of data. In this case, early signs indicate that data transfer between 3PL providers and Verizon is sometimes incomplete. When a device returns to the clean and screen facility and the RFID tag is unreadable, a replacement tag is issued and programmed to match the device. The tag identification information should then be transferred to Verizon to allow an update within the ERP database. It appears that this transfer of data from the 3PL to Verizon is not always occurring on a consistent basis.
It is difficult to determine the immediate impact of this problem on the supply chain due to the "snapshot" nature of the relevant data (the database only displays the current information for a device and lacks transaction history). It is likely, however, that such missing data has resulted in inefficient
operations in the past and will continue to do so unless rectified. The main source of this inefficiency lies in the daily inventory's automatic updates of on-hand inventory and subsequent automatically triggered replenishment orders. In a hypothetical scenario in which Verizon lacks the RFID EPC information on just 10% of refurbished devices, automatic replenishment orders will frequently result in premature
shipments of equipment (before the physical inventory count actually reaches the target threshold). As a result, Verizon incurs significant additional inventory costs and many key supply chain planning factors such as days of supply become skewed. As mentioned in Section 2-2, management decisions are only as good as the data on which they are based.
3.5
Process Mining to Understand System Interactions and Trends
Sections 3-1 and 3-2 show examples of challenges associated with complex organizational and IT structures. As a result of these types of challenges, there is some uncertainty for key decision makers regarding both data and process fidelity. In order to better understand this uncertainty, this research seeks to map true process flows of both information and inventory in order to ascertain where reality may be deviating from the published, idealized processes. The goal is twofold: (1) to establish an updated realistic
process flow, and (2) to use process mining to ascertain whether any specific deviations from the "normal" pathways are resulting in wasteful shipments or returns.
3.5.1 Process Mining Description
Process mining is a relatively new concept that refers generally to techniques that allow users to extract data from event logs. Researchers claim that it serves as the missing link between model-based process analysis and data-oriented analysis techniques, allowing users to perform fact based business process management [14]. The starting point for process mining is the aforementioned event log. Each event in such a log refers to an activity (i.e., a well-defined step in some process) and is related to a particular case (i.e., a process instance). The events belonging to a case are ordered and can be seen as one "run" or "trace" of the process. Event logs may store additional information about events such as the resource (i.e., person or device) executing or initiating the activity, the timestamp of the event, or data elements recorded with the event (e.g., the size of an order) [14].
There are three main types of process mining outlined in the literature. The first type of process mining is discovery. Process discovery is the most prominent process mining technique and it involves taking an event log and producing a model without any prior knowledge of the process. The second type of process mining is conformance. Here, an existing process model is compared with an event log of the same process. Conformance checking can be used to check if reality, as recorded in the log, conforms to the model and vice versa. Figure 3-5 depicts an example a process map from process mining compared to its idealized model.
Figure 3-5: Conformance Checking in Process Mining *-p *-- pd .. I..
Ideal
F
~rocess,
el
317 M 40 4 .11The third type of process mining is enhancement. Here, the idea is to extend or improve an existing process model by using information about the actual process recorded in some event log. Whereas conformance checking measures the alignment between model and reality, this third type of process mining aims at changing or extending the a priori model. For instance, by using timestamps in the event log one can extend the model to show bottlenecks, service levels, and throughput times [14].
There are a number of both commercial and open source tools with which to conduct analysis. In order to avoid incurring costs for this exploratory work, we chose to work with a pair of open source tools: the 'R' package bupaR, and the open source software ProM Tools. BupaR is significantly more user friendly and produces far more aesthetically pleasing outputs, but ProM Tools is far more versatile for the expert user.
3.5.2 Application and Results
Within the Verizon IT infrastructure, event log data is sparse. To limit file storage sizes, many databases store only the snapshot of device activity, depicting only the most recent transaction. There are, however, a few systems that store such event data in an aggregated format that proved easy to extract. One such system is the logistics management software that Verizon uses. The event logs from this database allow the researcher to trace the movement of a device from the RDC shelf to the customer's
Process
house and back to clean and screen. Figure 3-6a depicts the process flow for the event logs within this system, and 3-6b highlights the main transactions that occur.
Figure 3-6: Process Discovery in Logistics
(a) (b)
The key takeaway from Figure 3-6 is that, while the main process flow is discernable based on volume along that path, there are significant deviations from the normal process flow that occur on a regular basis. These pathways are sometimes entirely illogical, such as a device moving from "delivered to customer" straight to "in stock at RDC." This may be accurate, and devices may skip steps in the process at certain times, but more likely it is an indicator of poor data (either from poor collection or missing transactions). Efforts to expand the mapping by combining multiple systems are severely bogged down by these "outlier" transactions. The maps become largely unreadable, and the dominant flow path is difficult to discern.
After generating initial process maps, we endeavor to compare the processes that result in 'negative,' or wasteful outcomes, against those with positive outcomes. In this case, a positive outcome means an activation at a customer's premise, whereas a negative outcome means any other circumstance, e.g., unused return to clean and screen, delivered but never activated, etc. These comparisons show that there is significant process variability across the entire population, but the 'bad' population is far more random in its transaction sequences. Out of hundreds of bad shipments, the most common 'trace' sequence only accounts for 2% of the population. The good shipments were slightly less variable, although not nearly as regular as one would expect given that those shipments were all ultimately activated and theoretically should have followed a similar flow of transactions. The most common 'trace' sequence for good shipments accounts for about 15% of the population.
Process mining shows significant potential to yield key insights into process flows. It is relatively simple to conduct discovery process mining to create a new process map. Using process mining
techniques on data from the individual Fios systems, we are able to map out information and equipment flows, and identify the dominant paths within that system. Complications arise, however, when we attempt to integrate data from multiple systems. Discrepancies between systems present a significant data validation challenge and varied data formats between systems prove difficult to integrate. As a result of these challenges, we are currently unable to integrate and map process flows across the entire Fios supply chain with any sort of certainty. This may become possible in the future if the company seeks to unify or integrate its disparate systems into a more comprehensive solution.
4
Predictive Modelling for Order Cancellations
This chapter describes the methods and techniques used to build a predictive model that reliably predicts customer cancellations, as well as the key considerations that are required. Section 4-1 describes the motivation behind such efforts and briefly describes the data sources and evaluation criteria used to select the model.
4.1
Method and Motivations
This section outlines the reasoning behind the predictive model and some of its key considerations. In addition, it discusses data sources and methods employed.
4.1.1 Motivation and Goals for Predictive Model
In Section 3.4 we outline the results of a simple Fios shipment outcome analysis. The key
opportunity for predictive analytics is identified as shipments on cancelled orders, which overwhelmingly result in unused returns or missing equipment. These lost items and unused returns cost Verizon millions of dollars per year in direct device acquisition costs, clean and screen costs, and packaging and shipment costs. Recognizing that there is at least some inherent random nature in the behavior of customers, the stated goal of this model is to produce actionable insights that can limit the waste resulting from these shipments. Some of the considerations for the construction of this model include:
* Implementability: the model must be simple to disseminate and provide real-time predictions on orders. If used in a prescriptive manner to make shipment decisions, the model must be incorporated into the workflow of sales associates, and so it must be quick, user-friendly, and clear in its result.
* Accessibility of data: the model must be built using data that is available at the time of order placement. Although a plethora of data is available for a rearward looking researcher, model features are not useful for predictive modelling unless they are actually predictive. * Interpretability and communicability: In order for management to make decisions, they
must first understand the model and its results. Clear methods to visualize models are imperative in business settings.
* Impact on inventory: the primary reason for the existence of the direct shipment program is to limit GWC inventory. False positives (erroneous cancellation predictions) would result in equipment being installed from GWC inventory that would have otherwise been shipped. It is therefore imperative to limit false positives in the final model.