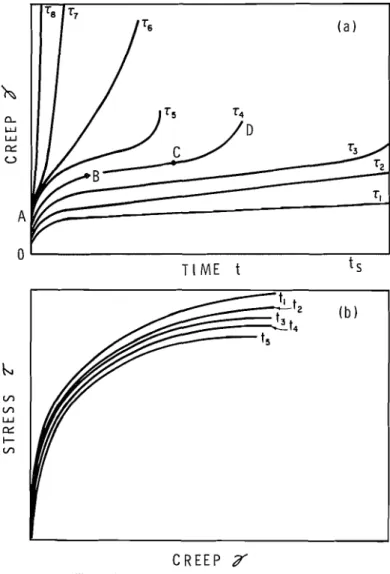
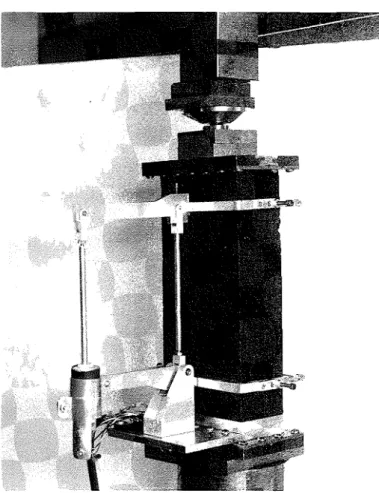
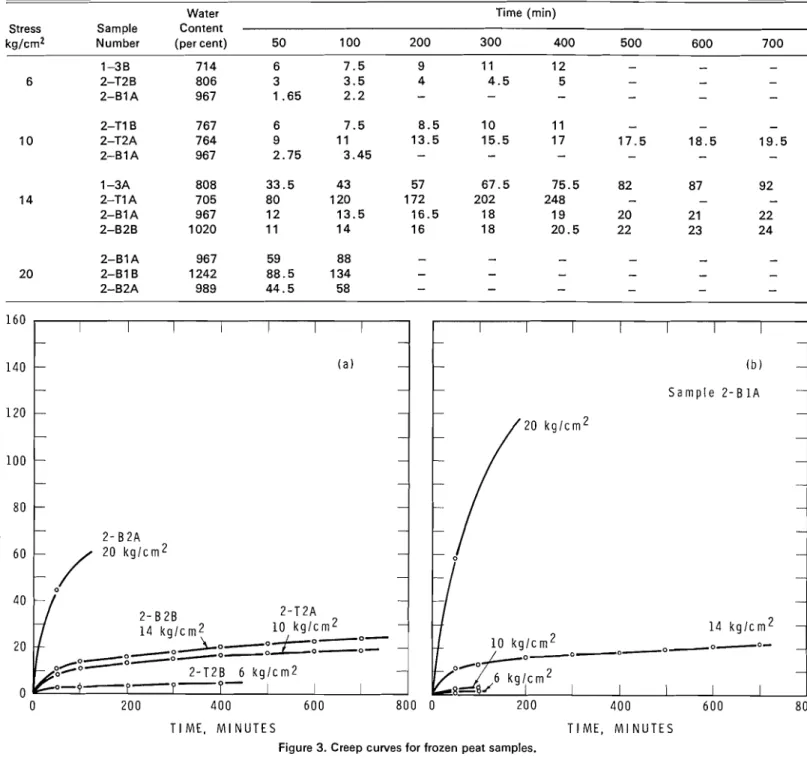
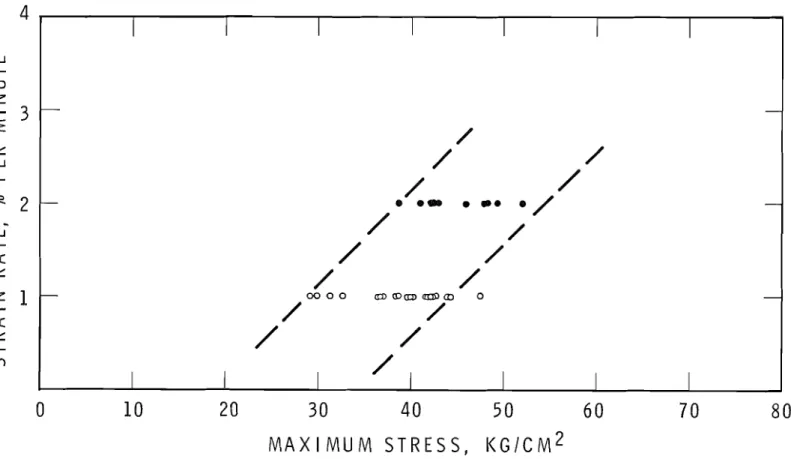
Strength and deformation tests on frozen peat
Texte intégral
Figure
Documents relatifs
Ubiquitin E3 ligases involved in CHK1 ubiquitination and degradation during normal cell cycle progression or in response to DNA damage include two Cullin RING Ligase (CRL)
Dans la troisième partie, les fils de MAH ont été assemblés par tissage manuel, sur un métier circulaire, pour produire des substituts vasculaires de petit diamètre.. Afin
(tableau 9.23.12.B).. Le calcul relativement récent des linteaux des murs extérieurs soutenus par des poteaux de 38 x 64 mm se fonde sur les dimensions des éléments d'ossature
In general, pinching provides a path of quasiconformal deformations of a hyperbolic Riemann surface, whose Beltrami differential is supported in a neighborhood of a finite disjoint
Handling I Areas in which flammable liquids or combustible liquids are transferred from one storage tank or container to another, or are used in such a way as to release
The differentiation of ES cells, incubated or not with AA, was eval- uated using (i) cell morphology and specific function (such as spontaneously beating cells for cardiac
Since the number of edges in real-world social networks tends to be in millions or even billions, we need to exploit some generalization model across activation probabilities to
