Publisher’s version / Version de l'éditeur:
Vous avez des questions? Nous pouvons vous aider. Pour communiquer directement avec un auteur, consultez la première page de la revue dans laquelle son article a été publié afin de trouver ses coordonnées. Si vous n’arrivez pas à les repérer, communiquez avec nous à [email protected].
Questions? Contact the NRC Publications Archive team at
[email protected]. If you wish to email the authors directly, please see the first page of the publication for their contact information.
https://publications-cnrc.canada.ca/fra/droits
L’accès à ce site Web et l’utilisation de son contenu sont assujettis aux conditions présentées dans le site LISEZ CES CONDITIONS ATTENTIVEMENT AVANT D’UTILISER CE SITE WEB.
AWWA 2003 Annual Conference, pp. 1-12, 2003-06-15
READ THESE TERMS AND CONDITIONS CAREFULLY BEFORE USING THIS WEBSITE. https://nrc-publications.canada.ca/eng/copyright
NRC Publications Archive Record / Notice des Archives des publications du CNRC : https://nrc-publications.canada.ca/eng/view/object/?id=f6657f3d-4ea5-47e5-ad62-33f1068098db https://publications-cnrc.canada.ca/fra/voir/objet/?id=f6657f3d-4ea5-47e5-ad62-33f1068098db
NRC Publications Archive
Archives des publications du CNRC
This publication could be one of several versions: author’s original, accepted manuscript or the publisher’s version. / La version de cette publication peut être l’une des suivantes : la version prépublication de l’auteur, la version acceptée du manuscrit ou la version de l’éditeur.
Access and use of this website and the material on it are subject to the Terms and Conditions set forth at
Water main assets: from deterioration to renewal
Water main assets: from deterioration to renewal
Kleiner, Y.; Rajani, B.
NRCC-46273
A version of this document is published in / Une version de ce document se trouve dans : AWWA Annual Conference, Anaheim, Ca., U.S.A., June 15-19, 2003, pp. 1-12
Water main assets: from deterioration to renewal
Yehuda Kleiner and Balvant Rajani
Institute for Research in Construction, National Research Council (NRC), Ottawa, ON, Canada K1A 0R6
Abstract: The deterioration of water mains is taking its toll on water utilities across the world. It is imperative that this deterioration be accurately quantified in order to
implement effective renewal plans for water distribution systems. With hundreds and even thousands of buried pipes, it is often prohibitively expensive to directly inspect every water main in a distribution network. Identifying water main breakage patterns over time is an effective and inexpensive alternative to measuring the structural deterioration of a water distribution system.
Breakage rates of water mains are affected by many factors, pipe-intrinsic, environmental and operational. An effective water main renewal plan must consider future breakage rates, and to forecast breakage rates one must (a) identify the “true” background deterioration rates of the water mains, and (b) quantify the impact of various
environmental factors as well as operational strategies on future breakage rates. The National Research Council of Canada is developing a prototype computer application to help model the deterioration rates of water mains and subsequently plan their renewal. It considers time-dependent factors such as temperature (in the form of freezing index), soil moisture (in the form of rainfall deficit), main replacement rates and cathodic protection (CP) strategies, including hotspot CP as well as systematic retrofit CP.
Non-time-dependent (or static) factors such as pipe characteristics and soil type are considered through water main grouping.
The background ageing rates of water mains enable the projection of their future breakage rates. In addition, the impact of operational strategies such as schedules of cathodic protection (both hotspot and retrofit) and pipe replacement can be superimposed on this background ageing. Subsequently, the life cycle costs of various scenarios operational strategies can be evaluated and fine-tuned to achieve maximum efficiency in resource allocation. Further, because the impact of time-dependent climatic conditions is quantified as well, planners can obtain climate forecasts from the weather bureau (no more that 2-4 years recommended) to evaluate expected year to year variations in the breakage rates.
Introduction
As water mains deteriorate both structurally and functionally, their breakage rates increase, network hydraulic capacity decreases, and water quality in the distribution system may decline. The ideal water main renewal strategy should exploit the full extent of the useful life of the individual pipe, while addressing issues of safety, reliability, water quality, and economic efficiency.
Effective planning for the renewal of water distribution systems requires accurate
quantification of the structural deterioration of water mains. Direct inspection of all water mains in a distribution network is often prohibitively laborious and expensive. The
application of physical models to assess the structural resiliency of each individual pipe is also not realistic in most cases because accurate data are rarely available and are very costly to obtain. Using statistical methods to identify breakage patterns over time is an effective and inexpensive alternative to measuring the structural deterioration of water mains, and indeed in the last twenty years several such methods have been proposed in the literature.
A recent survey comprising 45 water utilities from North America and the UK revealed that only about 30% of water utilities actually use models from the literature to aid them in making decisions regarding water main renewal (Reid 2000). This low rate is an indication that research efforts are often not translated into operational tools but rather remain
academic exercises. WARP (Water Mains Renewal Planner) is a computer program being developed at the Institute for Research in Construction (IRC) of the National Research Council of Canada (NRC). It is designed to facilitate the usage of several models developed at IRC in a decision support tool-box that will help municipal engineers and planners to reach more informed decisions.
A schematic diagram of WARP is provided in Figure 1. The following sections describe some components of WARP, using case studies to illustrate how data are input and how analyses and results are handled.
Multi-variate model to predict water main breaks
The historical patterns of water main breakage rates are a good, easily obtained indicator of the structural deterioration of a water distribution network. Factors affecting pipe breakage rate can be classified as static or dynamic. While static factors include pipe material, diameter, installation practices, soil type, etc., dynamic factors are time-dependent and include environmental (e.g., soil moisture, climate conditions, etc.) as well as operational (pressure, cathodic protection, etc.) factors.
Kleiner and Rajani (2000a & 2000b) proposed a general, multi-variate exponential (or an alternative power) model to consider time-dependent factors in predicting water main breaks. T t x a t N x e x N( )= ( t0) ⋅ (1)
where xt = vector of time-dependent covariates prevailing at time t, N(xt) = number of
breaks resulting from xt, a = vector of parameters corresponding to the covariates x;
Water main grouping
Long-term planning
Scenario generation and analysis:
• Replacement rates
• CP rates
• Breakage rates
• Budget
Expected economic life of pipe
Short-term planning
Forecast breakage rate fluctuations in the short term (2-4 years):
Forecast temperature and precipitation for short-term:
• External source, or
• In-house (Fourier analysis)
Future development: Prioritise individual pipes for replacement
Cost input
• Pipe breakage (direct
indirect, social)
• Pipe replacement
• Cathodic protection
Pipe data Input:
• Pipe/break
characteristics
• Water main inventory
• Breakage history
Data
Climate input:
• Precipitation history
• Temperature history
Cathodic protection input:
• Hotspot • Retrofit • Background ageing • Coefficients (impact) of covariates
Analysis
Multivariate model Rain Deficit Future covariates Retrofit cathodic protectionFreezing Index
Exposure
Hotspot cathodic protection
Figure 1. A schematic depiction of WARP
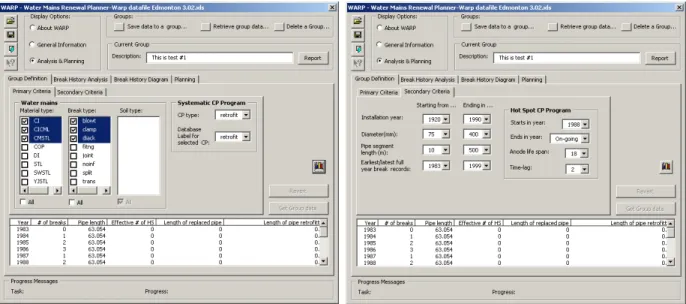
Although the mathematical model is not restricted in the number of covariates it can consider, data availability (or rather unavailability) is usually the limiting factor. This model is applied to groups of water mains that are assumed homogeneous with respect to their deterioration rates. The grouping is typically done by some or all of the static factors (e.g., by size, material, vintage, etc.) for which data are available. Figure 2 illustrates how this is done in WARP.
Figure 2. Creating homogeneous groups of water mains in WARP
Environmental dynamic covariates - climate
The breakage rate of buried pipes can be influenced by climatic conditions in several ways. Kleiner and Rajani (2000b) provided many references to reported observations on the influence of temperature and soil moisture on the frequency of water main breaks. Rajani et al. (1996) showed that differential temperature change between pipe and soil, and also soil shrinkage due to dryness result in the development of stresses in the pipe. Rajani and Zhan (1996) showed that dry soil (expected after an extreme dry season) has low latent heat capacity and will therefore lead to deeper frost penetration in cold regions.
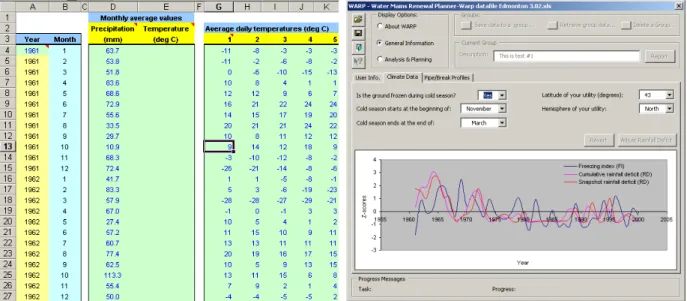
WARP uses freezing index (FI) as a surrogate measure for the severity of winter in a given year. FI is expressed in units of degree-days, and is calculated by summing the average temperature in all days in a given year in which the average temperature was below a pre-defined threshold. The data required to include FI in the analysis comprise average daily temperature records for the period of available water main breakage history.
Rain deficit (RD) is used as a surrogate measure for soil moisture. There are various methods to calculate RD, WARP does it using the Thornwate method (Kleiner and Rajani 2000a,b). As noted before, since soil moisture can influence pipe breakage rate by way of two mechanisms (soil shrinkage during long dry spells and frost penetration during a cold
winter following a dry summer and fall) RD is considered in two ways. RD cumulative accounts for the average soil moisture during a given year, whereas RD snapshot accounts for the soil moisture at the beginning of the cold season. The data required to include RD in the analysis comprise average monthly temperature and precipitation records for the period of available water main breakage history.
In order to avoid dealing with very large and very small values in equation (1), FI and RD are expressed as Z-scores, which are the normalised forms of these variables. Z-scores are in fact the deviations (expressed in standard deviations) of data points from the long-term average value of the data series. Figure 3 illustrates climate data entry in WARP.
Figure 3. Climate data entry in WARP
Operational dynamic covariates – cathodic protection
Cathodic protection (CP) of metallic water mains can often be an effective method of reducing breakage frequency and extending the useful life of pipes. WARP
distinguishes between two types of CP, hotspot and retrofit:
Hotspot cathodic protection (HS CP) is the practice of opportunistic installations of protective anodes at locations of a pipe failure, or other events at which the pipe is exposed. These anodes are typically installed without any means of monitoring and stay in the ground until total depletion, usually without replacement. In equation (1) the
HS CP covariate is taken as the number of active (non-depleted) anodes per unit length
of pipe. Kleiner and Rajani (2002) provide more detail on this procedure. The data required to include HS CP in the analysis comprise breakage records, date of
beginning/end of the HS CP program and estimates of the life expectancy of an anode in the ground.
Retrofit cathodic protection (Retro CP) refers to the practice of systematically protecting existing pipes with galvanic cathodic protection. If an existing water main is electrically discontinuous (e.g., bell and spigot with elastomeric gaskets and no bridging) then an anode is attached to each pipe segment (typically 6 m or 20’ length). If the water main is electrically continuous then usually a bank of anodes in a single anode bed can protect a long stretch of pipe.
Kleiner and Rajani (2002) modelled the impact of retrofit cathodic protection on water main breakage rate as a two-phase process, in which subsequent to a CP retrofit, the pipe breakage rate reduces exponentially over a transition period at the end of which the pipe continues to age (exponential growth of breakage rate) albeit at a lower rate than before protection. The data required to include Retro CP in the analysis comprise only the date of retrofit of individual pipes in the inventory. Retrofit anodes are usually monitored and replaced when fully depleted, thus it is assumed that the slow ageing rate is maintained in perpetuity through the rest of the pipe’s life.
In its current version, WARP cannot accommodate other dynamic covariates such as varying pressure regimes or usage of corrosion inhibitors such as orthophosphate.
However, since variations in these kinds of covariates are typically few and of the form of a step function, they can be handled through segmentation of the analysis period.
Kleiner and Rajani (2002) have shown that cathodic protection (both hotspot and retrofit) can have a significant impact on the economic life of water mains as well as on their life-cycle costs.
Analysis
WARP can perform analyses of historical breakage rates without or with any number of the covariates described earlier. When no covariates are selected, the results indicate an average ageing rate. When one or more covariates are selected, the results reflect background ageing (which is the consistent increase in pipe breakage rate due to corrosion and other steady, continuous deterioration processes) as well as annual variations due to the influence of time-varying, dynamic factors.
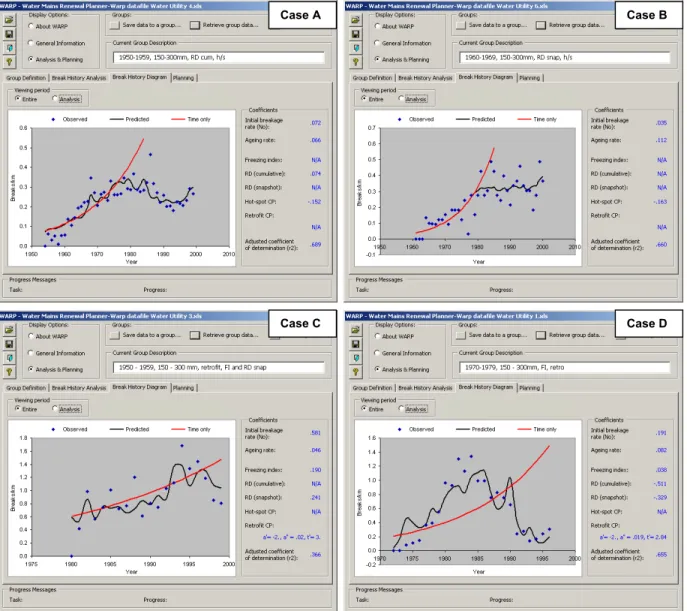
Figure 4 illustrates some analysis results. Figure 4A includes the analysis of a group of water mains (case A) comprising all (423 km) cast iron pipes, 150-300 mm (6”-12”) diameter, installed between 1950 and 1959 in a large city in Western Canada. Breakage records were available since 1954. A hotspot cathodic protection (CP) program was started in 1977. It can be seen that according to the multi-variate model the background ageing rate (in the chart legend it is denoted by “Time only”) was found to be 0.066, which means that without mitigative measures the breakage rate would increase nearly 6.6% annually.
Case D Case C
Case B Case A
Figure 4. Analysis of historical breakage rate in WARP
The effect of the cathodic protection, starting 1977 can clearly be seen. Observing the coefficients used for this analysis, it can be seen that among the climatic covariates only the cumulative rain deficit (RD) was found to contribute to the goodness of fit of the model. This could possibly be explained by the fact that the burial depth of the water mains in this utility is typically 3m (10’). At this depth frost penetration may be minimal and thus freezing index (FI) and snapshot RD may have minimal impact on the breakage rate. It can further be seen that the adjusted coefficient of determination, at a relatively high value of 0.689, reflects quite a good fit.
Figure 4B shows the analysis of a group of water mains (case B) comprising all (33 km) cast iron pipes, 150-300 mm (6”-12”) diameter, installed between 1960 and 1969 in a medium size city in south-central Ontario, Canada. Breakage records were available from 1966. A hotspot cathodic protection program was started in 1979. The background ageing rate was found to be 0.118 (annual breakage rate increase of nearly 11.8%). The effect of
the CP program can clearly be seen, although observed breakage rates seem to be more scattered following the implementation of CP. Among the climatic covariates none was found to contribute to the goodness of fit of the model. This could be explained possibly by the relatively mild climate at this city, however, climatic effects have been observed in other types of pipes in the same water utility. The adjusted coefficient of determination, at a relatively high value of 0.66, reflects quite a good fit.
Figure 4C shows the analysis of a group of water mains (case C) comprising all (45 km) cast iron pipes, 150-300 mm (6”-12”) diameter, installed between 1950 and 1951 in another city in western Canada. Breakage records were available from 1980. A retrofit cathodic protection program was started in the late 1980s and the first 400 m of pipes in this group were retrofitted in 1988. Until 1996 only 700 m of pipes had been retrofitted in total. However, in the years 1997-9 an additional 25 km of pipe were retrofitted. This can be seen clearly in the graph and the model. The background ageing rate was found to be 0.046 (annual breakage rate increase of nearly 4.6%). Among the climatic covariates, FI and snapshot RD were found to contribute to the goodness of fit of the model. It should
be noted that in this case the threshold for calculating FI was taken as –5oC (unlike the
other cases where 0oC was taken as threshold). A possible explanation could be that the
relatively harsh winter at this city, combined with the fact that the water mains were typically buried at a depth of 2.25 m, allowed frost penetration only when temperatures were very low for extended periods of time. The adjusted coefficient of determination, at an intermediate value of 0.366, reflects a moderate fit.
Figure 4D shows the analysis of a group of water mains (case D) comprising all (29 km) ductile iron pipes, 150-300 mm (6”-12”) diameter, installed between 1970 and 1979 in another city in south-central Ontario, Canada. Breakage records were available since 1972. A retrofit cathodic protection program was started in the early 1980s and the first pipes in this group were retrofitted in 1983. The entire group was retrofitted by the end of 1996. This can clearly be seen in the graph and the model. The background ageing rate was found to be 0.079 (annual breakage rate increase of nearly 7.9%), which was quite high, resulting in this aggressive retrofit program for relatively young water mains. The adjusted coefficient of determination, at a relatively high value of 0.655, reflects a good fit.
It should be noteded that sometimes the model displays goodness of fit values that are even lower than the moderate value of case C, especially when the group of water mains contains relatively few pipes with few recorded breaks, or when there are only a few years of data.
Planning
Once the analysis identifies all the parameters and coefficients governing the breakage rates in the water mains, expected future breakage rates can be forecast. If a credible forecast of near-term climatic conditions is available, a detailed breakage rate forecast is possible. A climate forecast can be obtained either from the meteorological services or, if desired, from WARP which provides a rudimentary tool for predicting climate using a Fourier analysis of available climatic time series. This detailed breakage rate forecast
may be practical for a short-term (2-4 years) only. Breakage rate prediction in the long-term involves only background ageing and cathodic protection programs.
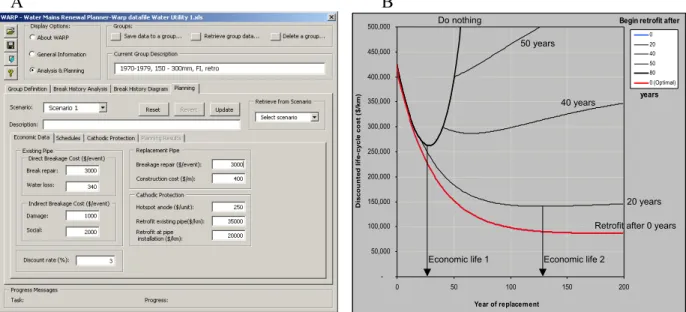
The following is a demonstration of a long-term planning process for case D. After entering costs and economic data, as is illustrated in Figure 5A, a life-cycle cost analysis can be carried out Figure 5B.
A B
Begin retrofit after
years -50,000 100,000 150,000 200,000 250,000 300,000 350,000 400,000 450,000 500,000 0 50 100 150 200 Year of replacement D isco u n ted l if e-cycl e co st ( $/ km ) 0 20 40 50 80 0 (Optimal)
Economic life 1 Economic life 2 Do nothing
50 years
40 years
20 years
Retrofit after 0 years
Figure 5. Cost data input and life-cycle cost analysis
From Figure 5B it can be seen that because the ageing rate of these water mains is quite high (7.9% per year) it would have been most economical to retrofit them upon
installation. That would have minimised their total discounted life-cycle cost. The actual time of retrofit (10-20 years after installation) was nevertheless beneficial because it reduced the total life cycle cost, compared to “do nothing” and also extended the economic life of the water mains from about 35 years (Economic life 1 - with “do
nothing”) to about 125 years (Economic life 2). It should be noted however, that the post-retrofit ageing rate was established based on few data. It would be prudent to re-analyse after several more years of data have been recorded.
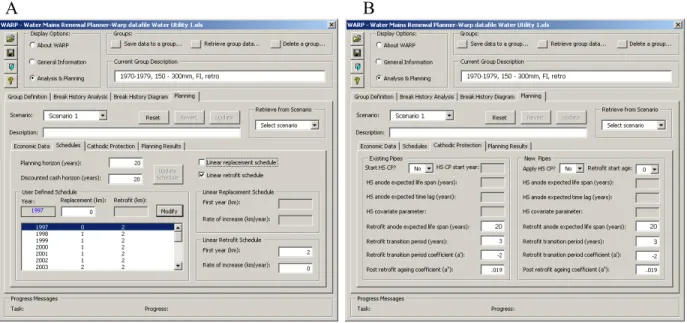
The utility has a group of 123 km of 150 mm CI water mains installed in 1950-60. Specific data as to the response of these mains to retrofit CP are not available because they have not been retrofitted yet. As a first approximation one might assume that their response would be similar to that observed for the DI water mains described above. Suppose that budget limitations do not allow the replacement or the retrofitting of the entire group. WARP allows the exploration of various strategies in order to select the most efficient one.
Figure 6 illustrates how a strategy is defined. After the planning horizon and the
replacement and retrofit schedules are entered (Figure 6A), the coefficients of the retrofit CP are either taken from the analysis results or are modified if better data are available (Figure 6B).
A B
Figure 6. Building planning scenarios in WARP
Note that in the right column of Figure 6B it is assumed that the replacement pipe is metallic, and thus, WARP allows for retrofit CP to be applied to the replacement pipe as well, either at installation or at a later year.
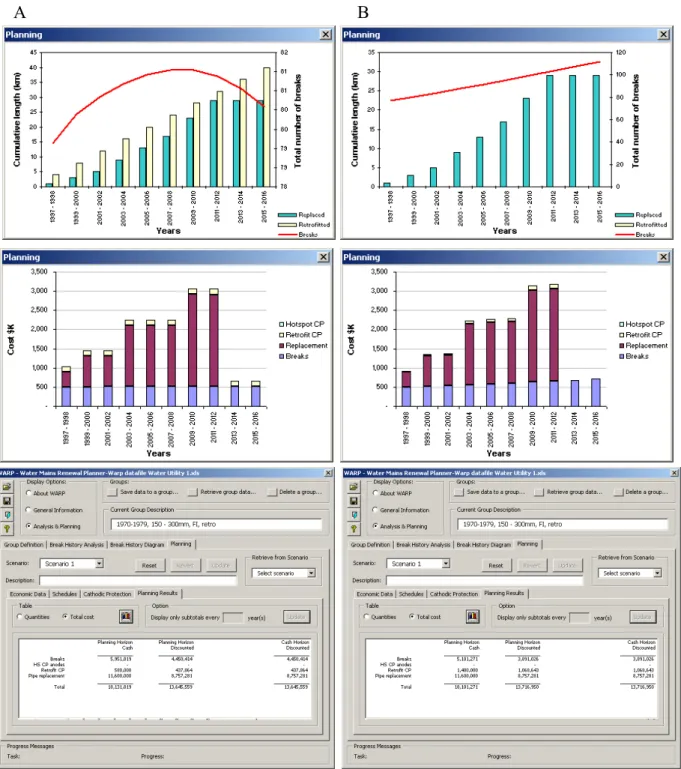
Figure 7 illustrates the comparison between two example strategies. Figure 7A depicts that planning results of a strategy that includes both replacement (including retrofit CP of the new pipe upon installation) and retrofit CP of certain lengths of the existing water mains in each of a 20-year planning horizon. Figure 7B includes only water main
replacement. The analysis results reflect the respective outcomes in terms of total length replaced and retrofitted, projected breakage rate and total costs, both discounted and undiscounted.
A B
Figure 7. Comparing two strategies
Summary
WARP is a decision support tool that helps to model the deterioration rates of water mains and subsequently plan their renewal. The analysis of breakage patterns considers time-dependent factors such as temperature, soil moisture (rainfall deficit), main
replacement rates and cathodic protection (CP) strategies, including hotspot CP as well as 11
methodical retrofit CP. The influence of each of these factors on pipe breakage rate can be quantified to (a) identify the “true” background deterioration rates of buried water mains, and (b) project the impact of various operational strategies on future breakage rates. Static factors affecting breakage rates (e.g., pipe material, diameter, soil) are considered through the grouping of water mains into relatively homogeneous groups. Historical breakage rate patterns are assumed to govern the future behaviour of the water mains. Based on this assumption and with the appropriate economic and cost data, the future impact of various operational strategies can be computed, leading to efficient planning of water main assets.
References
Kleiner, Y., and Rajani, B.B. (2000a). “Considering time-dependent factors in the statistical prediction of water main breaks.” Proc., American Water Works Association Infrastructure Conference, Baltimore. Kleiner, Y., and Rajani, B.B. (2000b). “Forecasting Variations and Trends in Water Main Breaks”,
submitted to the Journal of Infrastructure Systems, ASCE.
Kleiner, Y., and Rajani, B.B. (2002). “Quantifying the effectiveness of cathodic protection in water mains”, NACE International seminar, Northern Area, Montréal Section, Quebéc City, Aug. 2002.
Rajani, B., and Zhan, C. (1996). “On the Estimation of Frost Load.” Canadian Geotechnical J., 33(4), 629-641.
Rajani, B., Zhan, C., and Kuraoka, S. (1996). “Pipe-soil Interaction Analysis for Jointed Water Mains.” Canadian Geotechnical J., 33(3), 393-404.
Reid, F. (2000), unpublished data collected for the research project “Main breaks prediction, prevention and control” under the auspices of the American Water Works Association Research Foundation, Denver.